Agora: Benchmarking the F1 Data
A few weeks ago Agora filed their initial F1 statement (the equivalent of a S1, but for foreign companies listing on a US exchange) and will begin trading under the “API” symbol soon. Agora is a China based company, which will make it quite interesting to see how it’s received in the US markets. A S1 is a document companies file with the SEC in preparation for listing their shares on an exchange like the NYSE or NASDAQ. The document contains a plethora of information on the company including a general overview, up to date financials, risk factors to the business, cap table highlights and much more. The purpose of the detailed information is to help investors (both institutional and retail) make investment decisions. There’s a lot of info to digest, so in the sections below I’ll try and pull out the relevant financial information and benchmark it against recent cloud IPOs.
Agora Overview
From the F1 - “We pioneered Real-Time Engagement Platform-as-a-Service, or RTE-PaaS, and we are the global leader by market share in this rapidly growing industry. Our platform provides developers simple-to-use, highly customizable and widely compatible application programming interfaces, or APIs, to embed real-time video and voice functionalities into their applications without the need to develop the technology or build the underlying infrastructure themselves. The real-time data transmission is handled by our Software-Defined Real-Time Network, or SD-RTN, which is a virtual network overlay on top of the public internet running on more than 200 co-located data centers worldwide. Using sophisticated algorithms, the SD-RTN continually monitors and optimizes data transmission paths through the network to minimize latency and packet loss, enabling high quality real-time engagement across millions of concurrent users. ”
How Agora Makes Money
From the F1 - “Our business employs a freemium model, offering 10,000 free minutes of real-time engagement per month per account, to encourage adoption and innovation by developers and proliferation of real-time engagement use cases. As usage exceeds the allotted free minutes, we charge based on usage and developers become customers. In the month of March 2020 alone, we powered more than 40 billion minutes of real-time engagement for end users in more than 100 countries through more than 10,000 active applications. We define an active application as an application that uses one of our video or voice products for at least one minute in a given month.”"
Valuation
Predicting the valuation of pending IPOs is nearly impossible, and for non-US based companies it’s even harder, but it adds to the fun to make predictions! Agora is particularly tricky due to their huge spike in revenue in Q1 as a result of the Covid-19 pandemic. With this jump it’s nearly impossible to predict what the future NTM (next twelve months) revenue is projected to be (and this number drives valuation). Their March quarter revenue YoY growth rate was 166%, however prior to this quarter they consistently grew ~50% YoY each quarter. For the sake of this analysis I’m assuming a 120% growth rate going forward. I think this gives them credit for a boost, but acknowledges that the March quarter boost probably isn’t sustainable. But who knows :) Given the uncertainty around a Chinese company and future growth, for my valuation I’m assuming a 15x forward multiple (I got to this number by taking a slight discount to Twilio’s multiple which has a very similar business and trades at 17x). Given Agora’s superior unit economics (net retention and payback) I do think they deserve an above average multiple. Assigning a 15x multiple for a 120% growth rate doesn’t seem crazy. With all of that being said - Agora had $87M of revenue over the trailing twelve months. Applying 120% growth to that gets us to $191M of forward revenue. Applying a 15x multiple to this gets us to roughly a a $2.9B company, and this is my prediction! My back of the envelope math implies a $29 share price. The current range the company has indicated is $16 - $18, with the midpoint implying a $1.7B valuation. Typically the initial price range is lower than what the IPO ends up getting priced at, which is also lower than what the IPO ends up trading at on day 1. Below you can see a valuation matrix with implied valuations at different multiples / growth rates.

Benchmark Data
The data shown below is not current data, but data as of each companies IPO. As an example, in the first graph below the LTM revenue for Docusign represents the 4 quarters leading up to their IPO, not the most recent 4 quarters.
If you’d like to see how this compares to current operating metrics / valuations you can check out my weekly newsletter here
Agora is on the smaller end of companies to go public, however they are growing incredibly quickly in our current Covid-19 environment (unclear how long this will last for them). They also have exceptional unit economics (gross margin adjusted CAC payback and net retention), and are almost in the top decile of operating margin
Last Twelve Months (LTM) Revenue

Revenue Growth (YoY Growth of Most Recent Quarter prior to IPO)
Prior to Covid-19 Agora was growing roughly 50% YoY each quarter

Implied ARR (quarterly subscription revenue x 4 in most recent quarter prior to IPO)

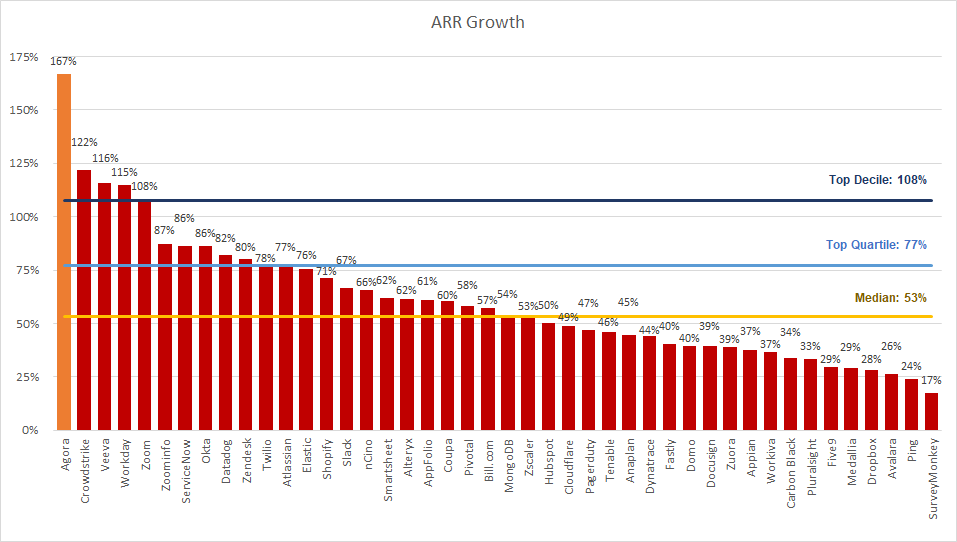
ARR Growth (YoY Growth)

% Subscription Revenue

GAAP Gross Margin

GAAP Operating Margin

Net Revenue Retention
This metric is calculated by taking the annual recurring revenue of a cohort of customers from 1 year ago, and comparing it to the current annual recurring revenue of that same set of customers (even if you experienced churn and that group of customers now only has 9, or anything <10).

Gross Margin Adjusted CAC Payback
(Previous Q S&M) / (Net New ARR x Gross Margin) x 12. This metric demonstrates how long it takes (in months) for a customer to pay back the cost at which it took to acquire them. In the chart below I’m taking the average of the 4 quarters leading up to IPO to remove any seasonality out outliers.

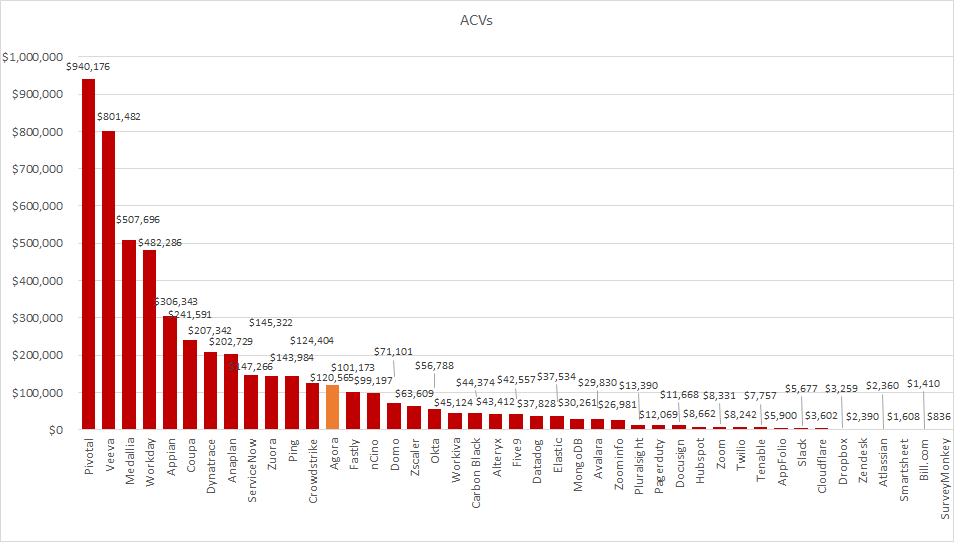
ACVs
This number represents the 1 year subscription value of a customer (ie the average subscription revenue each customer will pay in a 1 year time period). It’s calculated by taking the implied ARR (quarterly subscription rev x 4) and dividing by the total number of customers.

S&M % Rev

R&D % Rev

G&A % Rev


Great article! Thank you. No doubt that this stock gonna be amazing!