Amplitude: Benchmarking the S-1 Data
Yesterday Amplitude filed their initial S-1 statement. They will go public via a direct listing under the ticker AMPL. A S-1 is a document companies file with the SEC in preparation for listing their shares on an exchange like the NYSE or NASDAQ. The document contains a plethora of information on the company including a general overview, up to date financials, risk factors to the business, cap table highlights and much more. The purpose of the detailed information is to help investors (both institutional and retail) make informed investment decisions. There’s a lot of info to digest, so in the sections below I’ll try and pull out the relevant financial information and benchmark it against current cloud businesses. As far as an expected timeline - typically companies launch their roadshow ~3 weeks after filing their initial S-1 (the roadshow launches with an updated S-1 that contains a price range). After the roadshow launch there’s typically ~2 weeks before the stock starts trading. So we’re looking at roughly 5 weeks before any retail investor can buy the stock.
Amplitude Overview
From the S1 - “We are pioneering a new category of software called Digital Optimization. Our Digital Optimization System serves as the command center for businesses to connect digital products to business outcomes. Digital optimization is emerging as a strategic investment for every company to survive in the digital-first world…The way that companies build digital products is going through a fundamental change from being intuition-based to data-driven. Product teams have historically decided what to build based on qualitative gut feel and without a firm understanding of what will drive business results. Today, the best teams are those that build their strategy around product data, which connects the attributes of individual end users with their actual behavior. Product data has become the next untapped growth lever to transform how businesses build products, gain key insights into which features have the greatest business impact, and connect with customers.”
Product Overview
From the S-1: “Our Digital Optimization System consists of the following integrated components:
Amplitude Analytics. We are the #1 ranked product analytics solution. We enable any team with fast, self-service insights into customer behavior – helping them to answer and explore questions, see what features and end-user actions lead to outcomes across the entire customer journey, measure and forecast key metrics, and collaborate as a team on decisions.
Amplitude Recommend. A no-code personalization solution that helps teams increase customer engagement by intelligently adapting digital products and marketing channels to every user – with behavioral and predictive segmentation to build and sync audiences to marketing tools and a self-serve recommendation engine to instantly enable in-product personalization.
Amplitude Experiment. An integrated end-to-end solution that allows teams to better control feature releases, configure product experiences for different end users, and run the end-to-end feature experimentation process from generating a hypothesis to targeting users, rolling out A/B tests, and measuring results.
Amplitude Behavioral Graph. A purpose-built proprietary database for deep, real-time interactive behavioral analysis and behavior-driven personalization – instantly joining, analyzing, and correlating any customer actions to outcomes – like engagement, growth, and loyalty.
Data Management. A real-time data layer for planning, integrating, and managing data sources to create a complete, trustworthy foundation with identity resolution, enterprise-level security, and privacy solutions embedded throughout.”
Market Opportunity
From the S-1: “The ability for businesses to understand how their digital products predictably drive business outcomes has never been more important. Digital optimization has become mission critical to companies of all sizes and in all industries to keep up with the pace of innovation required to survive in the digital-first world. Consequently, we believe the market for digital optimization represents a significant and underpenetrated market opportunity today, which we estimate to be approximately $37 billion in 2021.”
How Amplitude Makes Money
From the S-1: “We generate revenue through selling subscriptions to our platform. We reach customers through an efficient direct sales motion, solution partners, and product-led growth initiatives, including subscription plans to meet the needs of a diverse range of companies. Our pricing model is based on both the platform functionality required by our customers as well as committed event volume. Customers typically look to use our platform for an initial business use case they have identified, such as analytics on a digital product.”
Benchmark Data
The data shown below depicts how the Amplitude data compares to the operating metrics of current public SaaS businesses.
Last Twelve Months (LTM) Revenue
Amplitude’s LTM revenue was $129M
LTM Revenue Growth
Amplitude’s LTM revenue growth was 53%
Quarterly YoY Revenue Growth Trends
Amplitude accelerated nicely over the last quarter
LTM GAAP Gross Margin
Amplitude’s LTM gross margins were 69%
Over the last couple quarters Amplitude’s gross margins have slightly decreased
LTM GAAP Operating Margin
Amplitude’s LTM operating margin was (18%)
Over the last couple quarters Amplitude’s GAAP operating margins have decreased
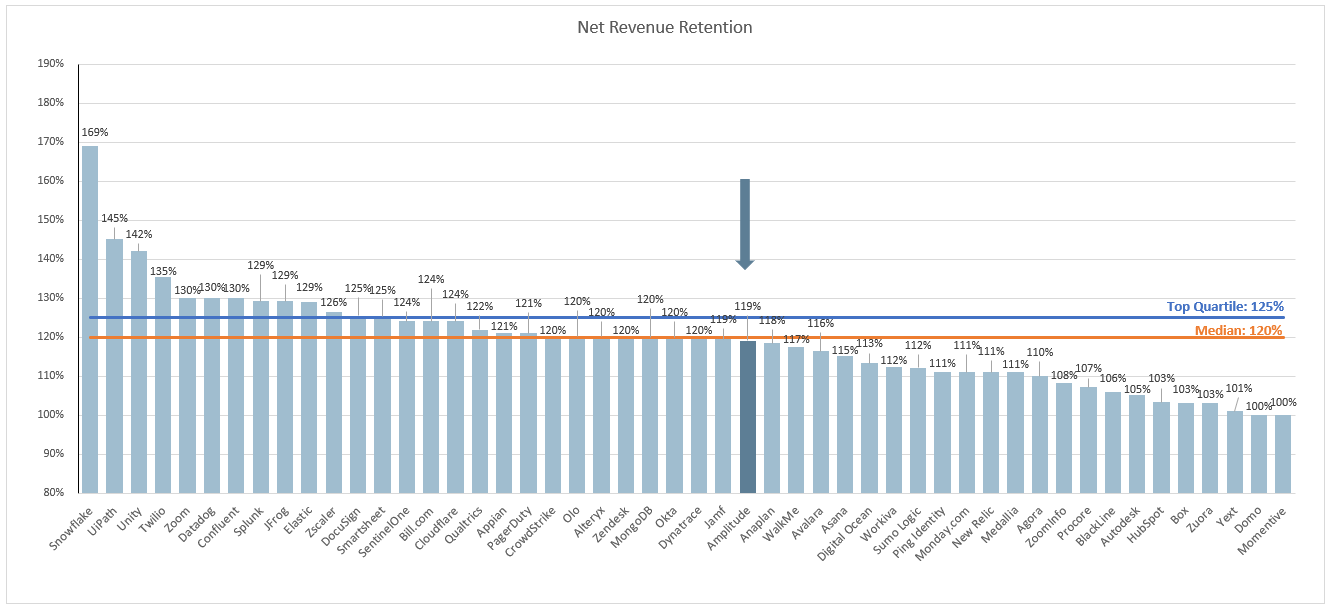
Dollar-Based Net Expansion
This metric is calculated by taking the annual recurring revenue of a cohort of customers from 1 year ago, and comparing it to the current annual recurring revenue of that same set of customers (even if you experienced churn and that group of customers now only has 9, or anything <10).
Here’s how they calculated DBNR: “We calculate dollar-based net retention rate as of a period end by starting with the ARR from the cohort of all customers as of 12 months prior to such period-end (the “Prior Period ARR”). We then calculate the ARR from these same customers as of the current period-end (the “Current Period ARR”). Current Period ARR includes any expansion and is net of contraction or attrition over the last 12 months, but excludes ARR from new customers as well as any overage charges in the current period. We then divide the total Current Period ARR by the total Prior Period ARR to arrive at the point-in-time dollar-based net retention rate. We then calculate the weighted-average of the trailing 12-month point-in-time dollar-based net retention rates, to arrive at the dollar-based net retention rate.”
Amplitude’s DBNR is 119%
Gross Margin Adjusted CAC Payback
(Previous Q S&M) / (Net New ARR x Gross Margin) x 12. This metric demonstrates how long it takes (in months) for a customer to pay back the cost at which it took to acquire them. In the chart below I’m taking the average of the 4 quarters leading up to IPO to normalize the business.
Amplitude’s CAC payback period is 18 months
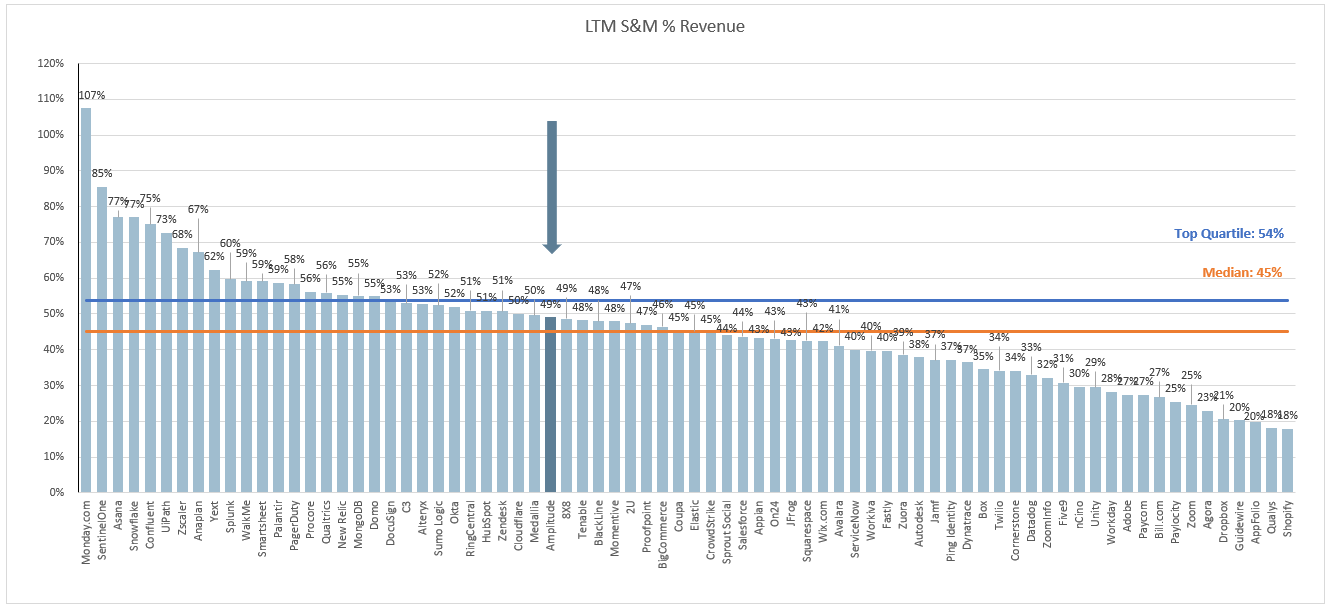
LTM S&M Expense as % of LTM Revenue
Amplitude spent 49% of revenue on sales and marketing expenses over the last 12 months
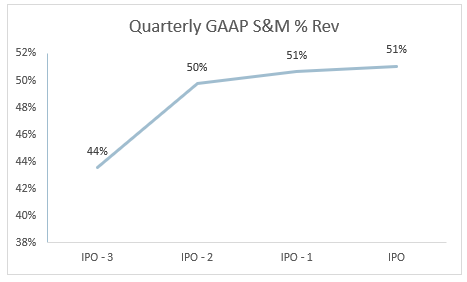
Amplitude’s quarterly spend on S&M has gone up slightly over the last 4 quarters
Rule of 40
In the below chart I’m showing LTM revenue growth + LTM FCF margin.
Amplitude’s Rule of 40 is 49%
This post and the information presented are intended for informational purposes only. The views expressed herein are the author’s alone and do not constitute an offer to sell, or a recommendation to purchase, or a solicitation of an offer to buy, any security, nor a recommendation for any investment product or service. While certain information contained herein has been obtained from sources believed to be reliable, neither the author nor any of his employers or their affiliates have independently verified this information, and its accuracy and completeness cannot be guaranteed. Accordingly, no representation or warranty, express or implied, is made as to, and no reliance should be placed on, the fairness, accuracy, timeliness or completeness of this information. The author and all employers and their affiliated persons assume no liability for this information and no obligation to update the information or analysis contained herein in the future.


Thanks for summarising and providing comparison chart.