Every week I’ll provide updates on the latest trends in cloud software companies. Follow along to stay up to date!
Budget Flush Coming?
Something that has been on my mind recently - will we see a larger than normal budget flush at the end of this year? First - what is a budget flush? A budget flush occurs when companies rush to spend remaining budgeted funds before the fiscal year ends, often due to a "use it or lose it" mentality. This behavior can create a surge in purchasing activity, as organizations look to make strategic investments without losing their allocated funds. For software companies, this phenomenon can be a tailwind, as it drives accelerated deal closures and increased sales velocity, sometimes with less price sensitivity from buyers looking to quickly deplete their budgets. As a result, software vendors often see an uptick in revenue and bookings during these periods.
This concept is nothing new and has been going on for a while. However, if we rewind the clock to a year ago, the budget flush at the end of 2023 felt stronger than most years. When companies reported Q4 ‘23 quarters, sentiment started to emerge that software was “bouncing back.” Turned out it was more of a headfake, and the strength in Q4 was more about budget flush than some structural recovery in software buying.
So why was it stronger than normal last year? We all know 2020 and 2021 was the year of excessive software buying fueled by ZIRP. Coming out of that, every company from the largest enterprise to the smallest startup started thinking very critically about cost optimizations. Where was redundant spend that could be consildated. Where was wasted spend with low ROI. Cost optimizations were everywhere. On top of that, procurement (the process of buying software) became a lot more rigorous. Sales cycles elongated as every vendor that was being considered for purchase was put through many levels of evaluations and approvals.
Even when we got through the majority of cost optimizations and the macro started to ease a bit (concerns about a recession started to lighten, rates stopped going up, etc), all of the muscle memory around stricter procurement stuck. Selling software remained challenging in 2023 - despite budgets starting to grow again. What this lead to was harder than normal selling / buying throughout the year. But then at the end of the year you get into budget flush. Departments never want to give up budget…It’s always easier to do you job and hit your targets with more money! So at the end of the year, no one wants to implicitly tell their higher ups / finance org that they “need less because they spent less.” So instead, this “loose it or loose it” mentality kicks in. If you use all of your budget, you’ll get the same amount (or more) next year. If you use 80% of your budget, the finance team may say “hey great job, looks like we overallocated to you this year we’re going to right size your budget based on this year’s spend and decrease your budget for next year.”
Because selling / buying was more difficult during the year (but budgets were still growing YoY), there was more budget available as part of this “budget flush” in 2023 vs prior years.
As we head into the end of 2024 I wonder if a similar, but even stronger, budget flush will play out. The macro has only gotten stronger. The economy continues to hold on and show signs of strength, and on top of that the Fed has started cutting rates. It feels to me like we saw the same discipline around procurement in 2024 that we saw in 2023, but now there (could) be more budget up for grabs at the end of the year. All of that could create a good setup for software in Q4!
Potentially related, software stocks have performed quite well over the last week, particularly the consumption names. Cloudflare is up 17%. Datadog is up 14%. Mongo is up 16%. Snowflake is up 14%. The hyperscalers (AWS, Azure, GCP) are always some of the first companies to report earnings during earnings season (coming up in 2 weeks), and there’s always a read through for consumption names (meaning people believe there’s a correlation). It feels like there’s optimism in the world that they will report strong quarters which will be a positive signal for the rest of the consumption universe. It’s creating a setup for either 1) a good time to get in before the re-acceleration shows up in the data! or 2) the opportunity to sell the news. Time will tell!
Rates
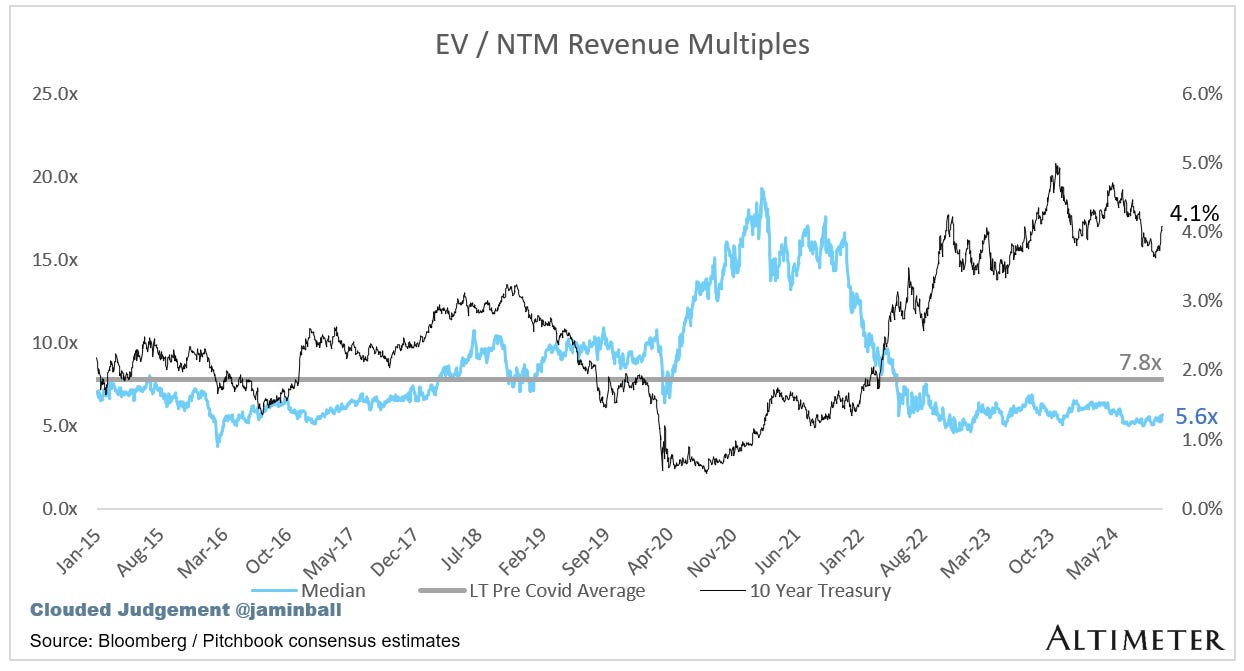
In other news, the 10Y is back over 4%! In the last 2 weeks it’s risen ~15% from 3.6% to 4.1%. Pretty big move! However, the move up is a good thing - it signals the economic data has come in strong, and there are increased odds that there won’t be as much urgency to cut. One fed official this week said he was open to skipping a rate cut at the next Fed meeting in November.
Top 10 EV / NTM Revenue Multiples
Top 10 Weekly Share Price Movement
Update on Multiples
SaaS businesses are generally valued on a multiple of their revenue - in most cases the projected revenue for the next 12 months. Revenue multiples are a shorthand valuation framework. Given most software companies are not profitable, or not generating meaningful FCF, it’s the only metric to compare the entire industry against. Even a DCF is riddled with long term assumptions. The promise of SaaS is that growth in the early years leads to profits in the mature years. Multiples shown below are calculated by taking the Enterprise Value (market cap + debt - cash) / NTM revenue.
Overall Stats:
Overall Median: 5.6x
Top 5 Median: 17.3x
10Y: 4.1%
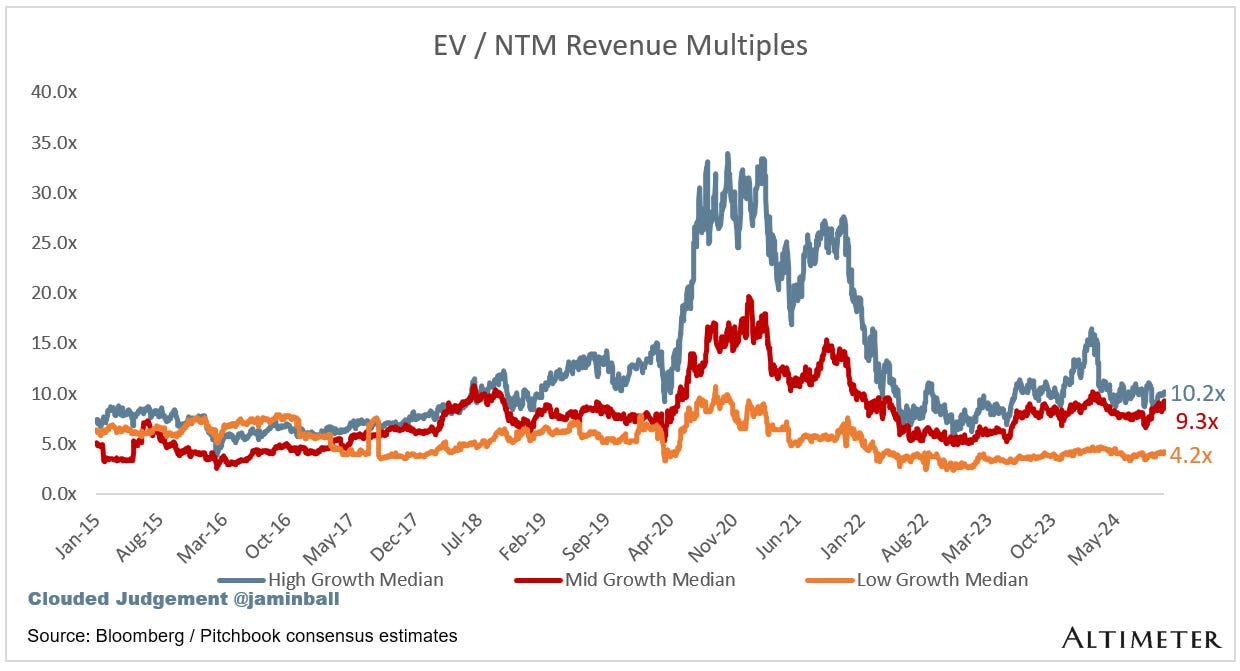
Bucketed by Growth. In the buckets below I consider high growth >27% projected NTM growth (I had to update this, as there’s only 1 company projected to grow >30% after this quarter’s earnings), mid growth 15%-27% and low growth <15%
High Growth Median: 10.2x
Mid Growth Median: 9.3x
Low Growth Median: 4.2x
EV / NTM Rev / NTM Growth
The below chart shows the EV / NTM revenue multiple divided by NTM consensus growth expectations. So a company trading at 20x NTM revenue that is projected to grow 100% would be trading at 0.2x. The goal of this graph is to show how relatively cheap / expensive each stock is relative to their growth expectations
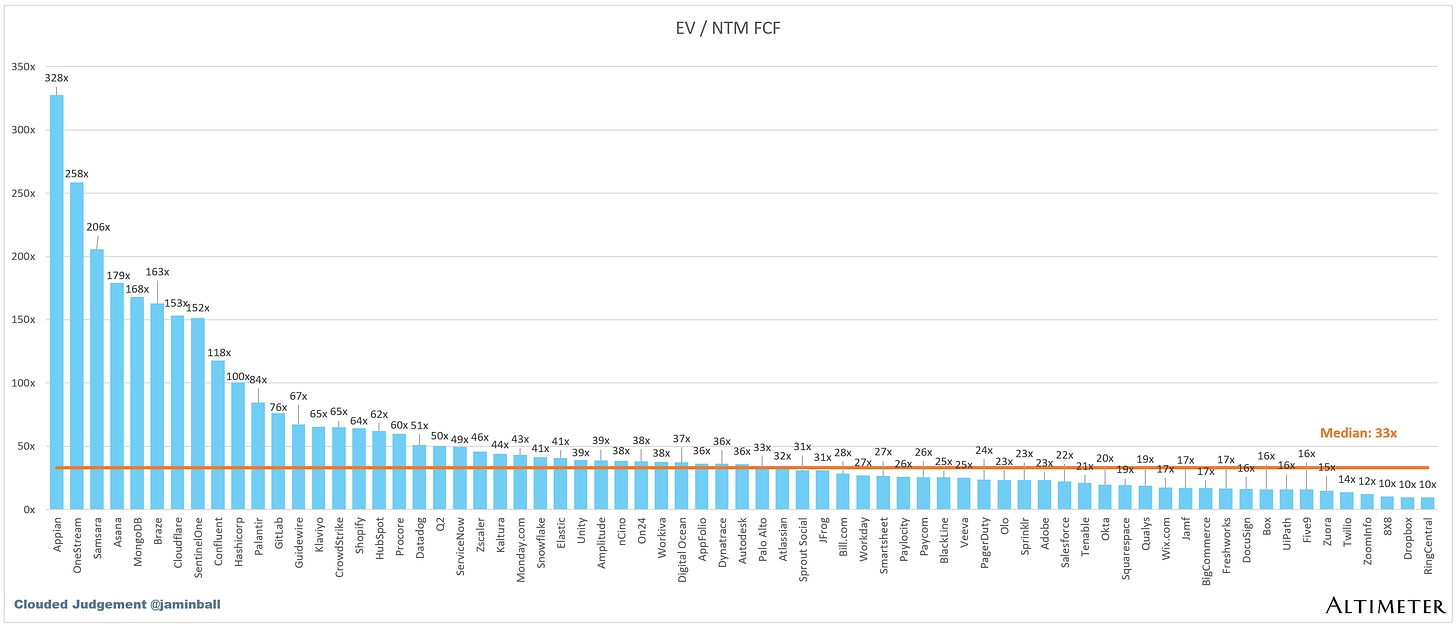
EV / NTM FCF
The line chart shows the median of all companies with a FCF multiple >0x and <100x. I created this subset to show companies where FCF is a relevant valuation metric.
Companies with negative NTM FCF are not listed on the chart
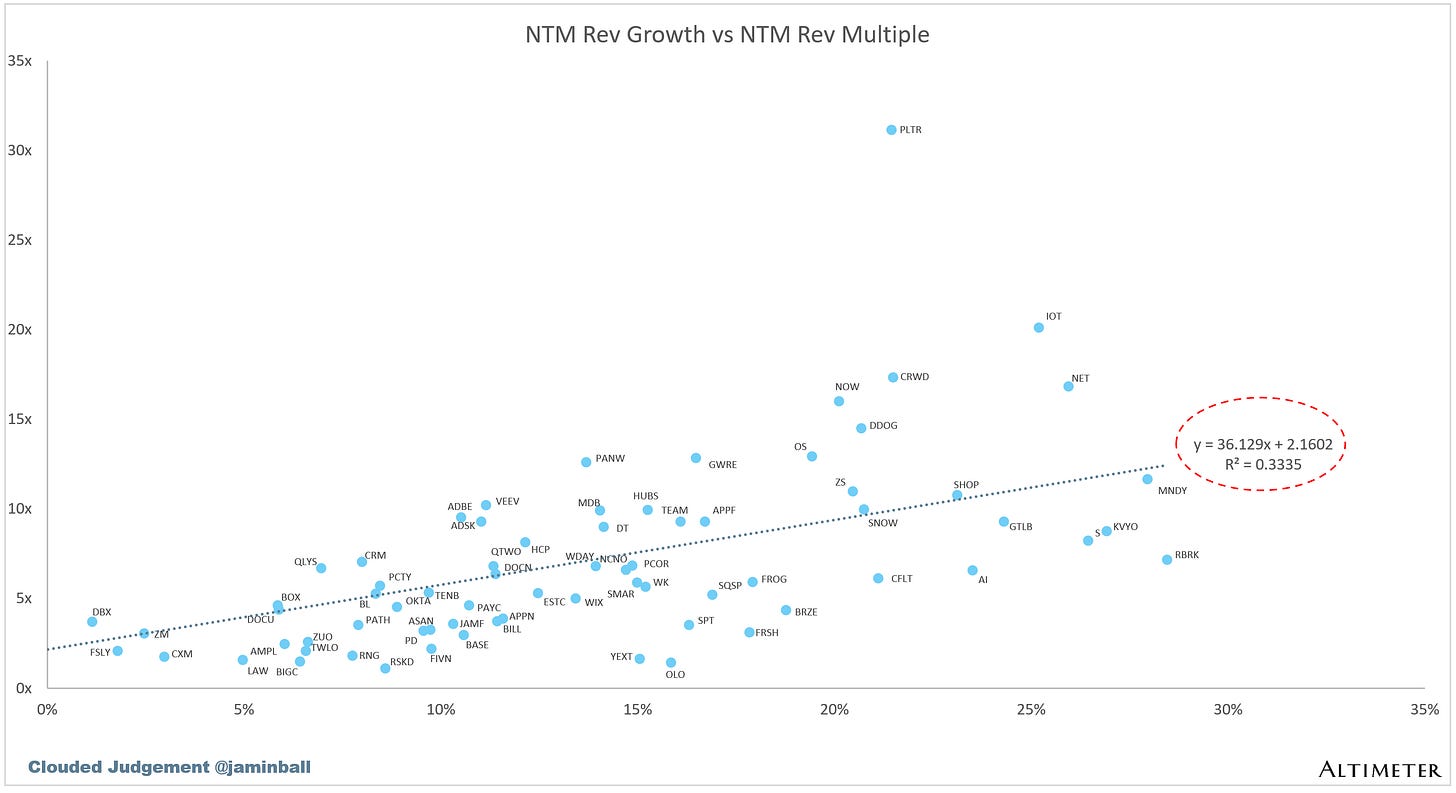
Scatter Plot of EV / NTM Rev Multiple vs NTM Rev Growth
How correlated is growth to valuation multiple?
Operating Metrics
Median NTM growth rate: 12%
Median LTM growth rate: 16%
Median Gross Margin: 75%
Median Operating Margin (9%)
Median FCF Margin: 15%
Median Net Retention: 110%
Median CAC Payback: 41 months
Median S&M % Revenue: 40%
Median R&D % Revenue: 24%
Median G&A % Revenue: 17%
Comps Output
Rule of 40 shows rev growth + FCF margin (both LTM and NTM for growth + margins). FCF calculated as Cash Flow from Operations - Capital Expenditures
GM Adjusted Payback is calculated as: (Previous Q S&M) / (Net New ARR in Q x Gross Margin) x 12 . It shows the number of months it takes for a SaaS business to payback their fully burdened CAC on a gross profit basis. Most public companies don’t report net new ARR, so I’m taking an implied ARR metric (quarterly subscription revenue x 4). Net new ARR is simply the ARR of the current quarter, minus the ARR of the previous quarter. Companies that do not disclose subscription rev have been left out of the analysis and are listed as NA.
Sources used in this post include Bloomberg, Pitchbook and company filings
The information presented in this newsletter is the opinion of the author and does not necessarily reflect the view of any other person or entity, including Altimeter Capital Management, LP ("Altimeter"). The information provided is believed to be from reliable sources but no liability is accepted for any inaccuracies. This is for information purposes and should not be construed as an investment recommendation. Past performance is no guarantee of future performance. Altimeter is an investment adviser registered with the U.S. Securities and Exchange Commission. Registration does not imply a certain level of skill or training.
This post and the information presented are intended for informational purposes only. The views expressed herein are the author’s alone and do not constitute an offer to sell, or a recommendation to purchase, or a solicitation of an offer to buy, any security, nor a recommendation for any investment product or service. While certain information contained herein has been obtained from sources believed to be reliable, neither the author nor any of his employers or their affiliates have independently verified this information, and its accuracy and completeness cannot be guaranteed. Accordingly, no representation or warranty, express or implied, is made as to, and no reliance should be placed on, the fairness, accuracy, timeliness or completeness of this information. The author and all employers and their affiliated persons assume no liability for this information and no obligation to update the information or analysis contained herein in the future.


your calculation of GM Adjusted Payback Period is extremely helpful, thank you
Hey Jamin - these notes are super helpful and I love reading them every week! Is there a reason you don't include some companies like Jack Henry, Intapp, AspenTech, N-able, or Docebo? There are a bunch of other software companies I track, if you'd like me to send them over!