

Every week I’ll provide updates on the latest trends in cloud software companies. Follow along to stay up to date!
Decision Models: The Next Shoe to Drop
Seems like the two hottest trends these days are personal AIs (Instinct, Muse, Grok Bot, Dots from OpenAI, etc) and Decision Models like Jev. I wanted to write a bit today about decision models!
Jev (from the company TypeSafe) has taken the world by storm (it launched mid September, so very recently). Within 24 hours of launching on Vercel’s AI Gateway, Jev was used by ~13% of paid teams. This made it the fastest adopted model in the gateway history! The Information reported they’re talking to investors about raising a round at a $10b valuation. Then this week OpenAI announced their Decisions API, Databricks announced their ai_decide function (powered by a decision model), and Perplexity announced their open weight decision model. In many ways decision models is a continuation of the trend of “choice” when it comes to model types. We started with only frontier models. Then we had open weight models. Are decision models the next shoe to drop?
So what is a decision model and what is all the hype? Decision models take unstructured input and instead of giving you text as an output, they give you a “decision.” (and yes, I know I just used the word in it’s own definition…). A decision could be a binary yes/no, it could be a classifier (pick one of N categories), or a score on an ordered scale (on scale of 1-5 how urgent is this request). On top of the “decision” the model also provides a probability of how sure it is of it’s decision (this can be expressed in a percentage). Here’s an example of each. The input is a support ticket. The decision model output could be:
binary: is this customer threatening to churn?
answer: yes, 87%
Classifier: who should I route this ticket to / which team should handle this ticket?
Billing team, 92%
Ordered Scale: on a scale of 1-10 how urgent is this ticket?
3, 78%
There are so many other ways decision models can be used. Here are some of my favorite:
Model Routing: Take a prompt as an input and decide which model to route it to
Agent Controls: Take an agent’s proposed next step as an input and decide if it should keep going, stop, retry, or route to a human for their input
AI Judge: Take a LLMs output as an input and decide if if follow’s your companies brand guidelines or company policy
Document Review: Take a customer contract as a input and decide if it contains non-standard terms that need a further legal review
As you can imagine, the possibilities start to become endless.
And the kicker on these decision models is they’re incredibly cheap! I saw an article that quoted Jev pricing at $0.042 per million input tokens (free output tokens). That’s >100x cheaper than leading model prices! It’s fair to push back on this though - the Jev pricing is obviously significantly less expensive than frontier models, but how does it compare to something like GPT6-Luna? Closer to 4x cheaper (big difference to the 100x+ figure). And something like GPT6-Luna can also be suited for more simple tasks like classification / routing. However - just simply looking at cost doesn’t tell the full picture. There’s also accuracy, latency, and then the “scoring” calibration of the decision models. On the accuracy piece, the bet is that a purpose-built decision model will be far more accurate for tasks like binary classification than a general purpose LLM. If Jev is closer to frontier accuracy at Luna prices, it’s probably more fair to compare the price to the frontier price. Then there’s latency. Think of a workflow made up of many if/then type statements (where the output of each is a classifier). You string tons of these together, you’ll really care about the latency. And the promise of the decision models is that they will be way faster than general purpose LLMs. Then finally, there’s the “confidence interval” the decision models spit out (which general purpose LLMs like Luna wouldn’t). It’s hard to make an apples to apples comparison and definitively answer “how much cheaper is Jev” because it’s hard to know where on the spectrum of frontier to Luna you should compare it to. Factoring in cost, accuracy, and latency I think it’s very fair to say it’s “significantly” cheaper than current alternatives today.
The natural question becomes - what does this mean for the broader model ecosystem? What percent of tokens generated today can be replicated with decision models? I asked Claude that exact question, and it guessed 10-15%. So not a trivial amount!
What’s maybe more interesting about all of this is looking at the Price x Quantity equation for token spend TAM. Everyone knows that the quantity of tokens generated is going up by many many orders of magnitude. We’re just so early. Everyone also knows P will come down eventually, but it’s more of a theoretical vs “and here’s how".” Open weight models were a great real stake in the ground for how models would get cheaper (ie how the P would go down). Decision models could be the next shoe to drop. P going down is great - it will certainly drive even more adoption and drive the Q up even faster.
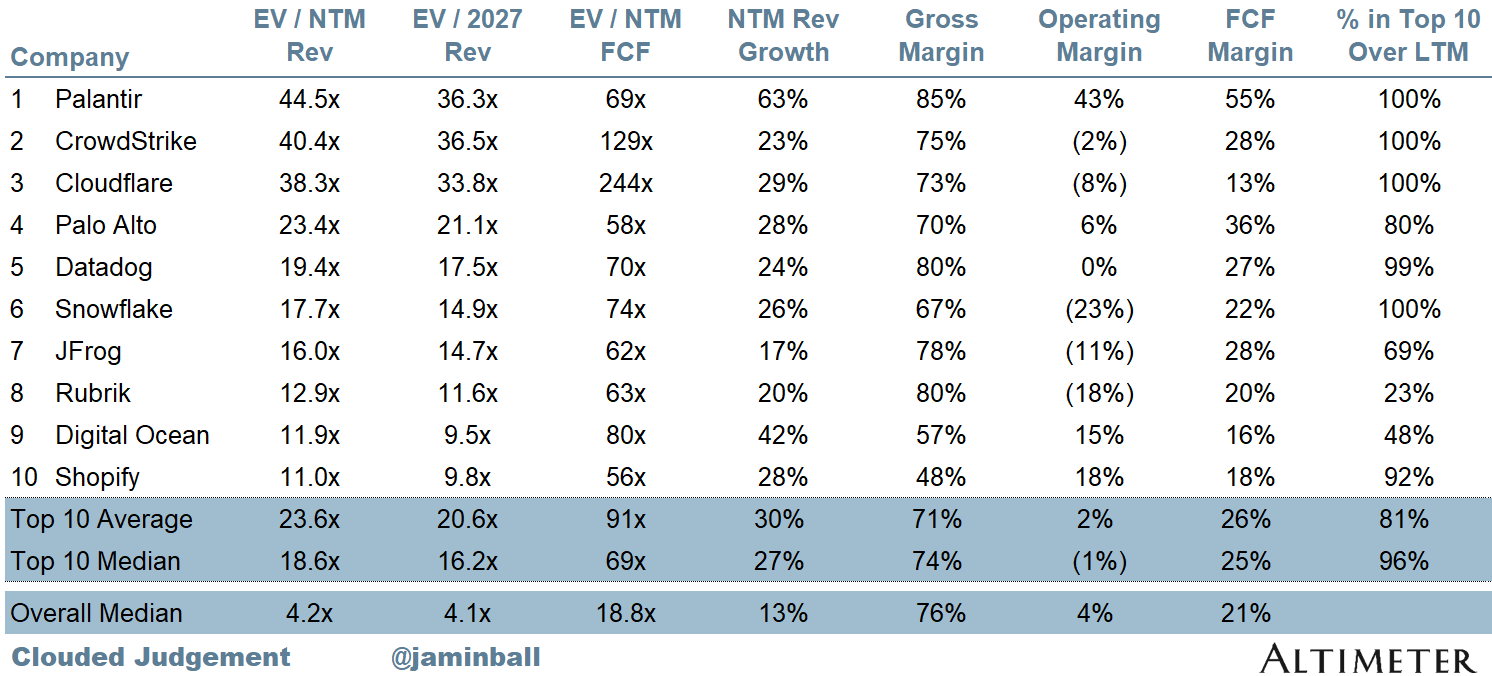
Top 10 EV / NTM Revenue Multiples
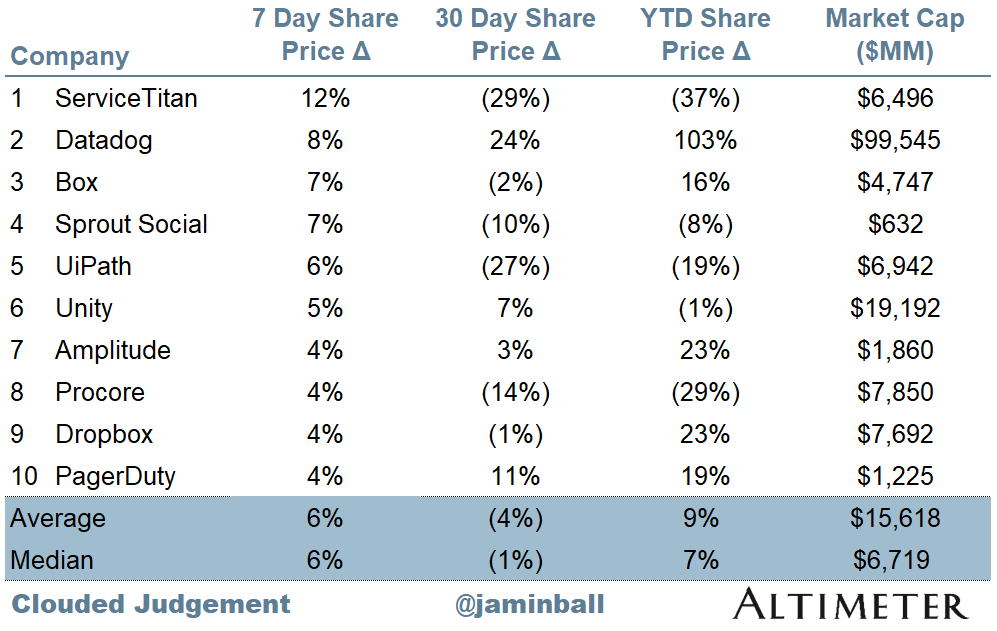
Top 10 Weekly Share Price Movement
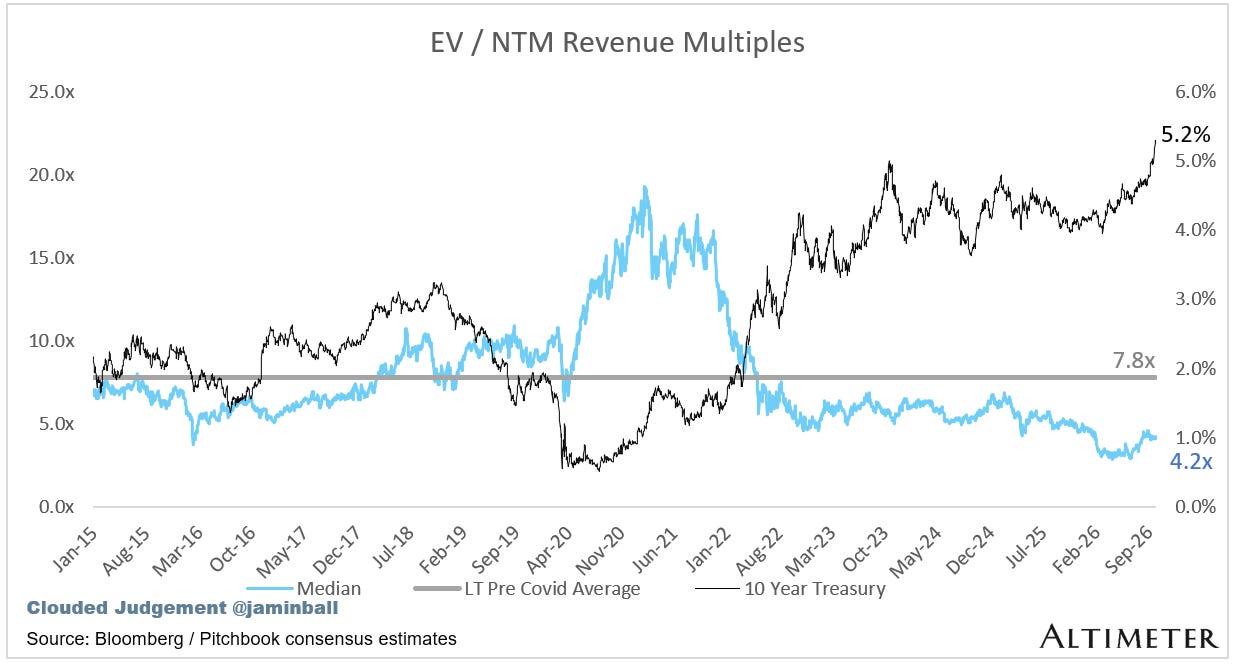
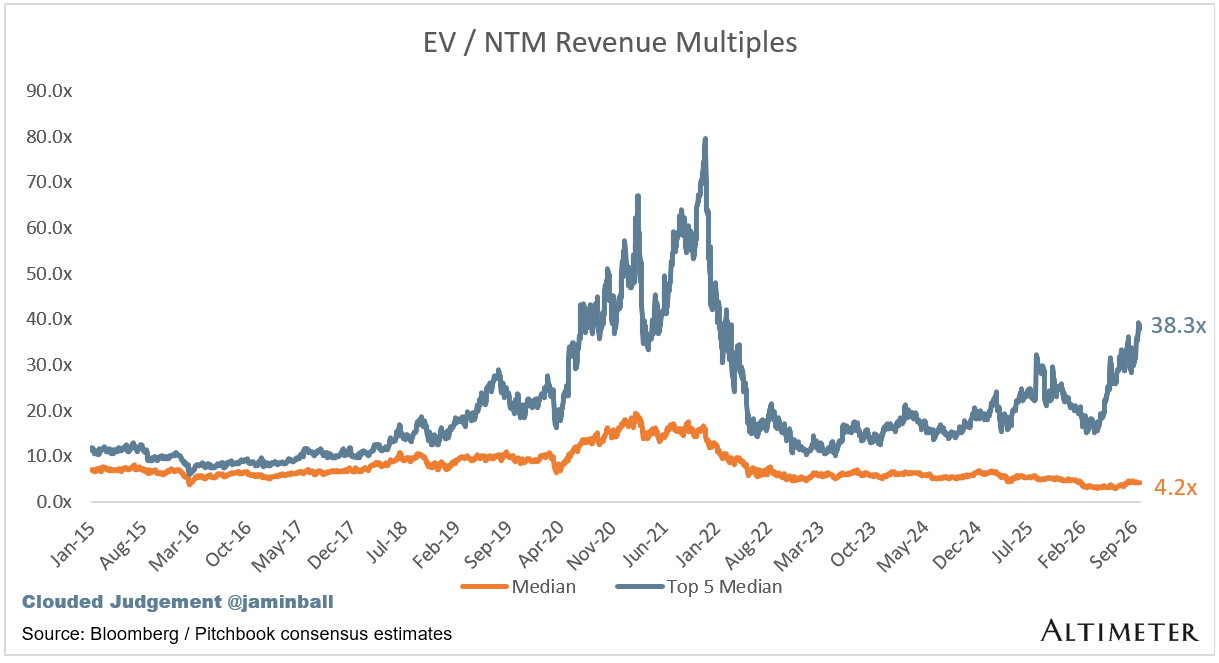
Update on Multiples
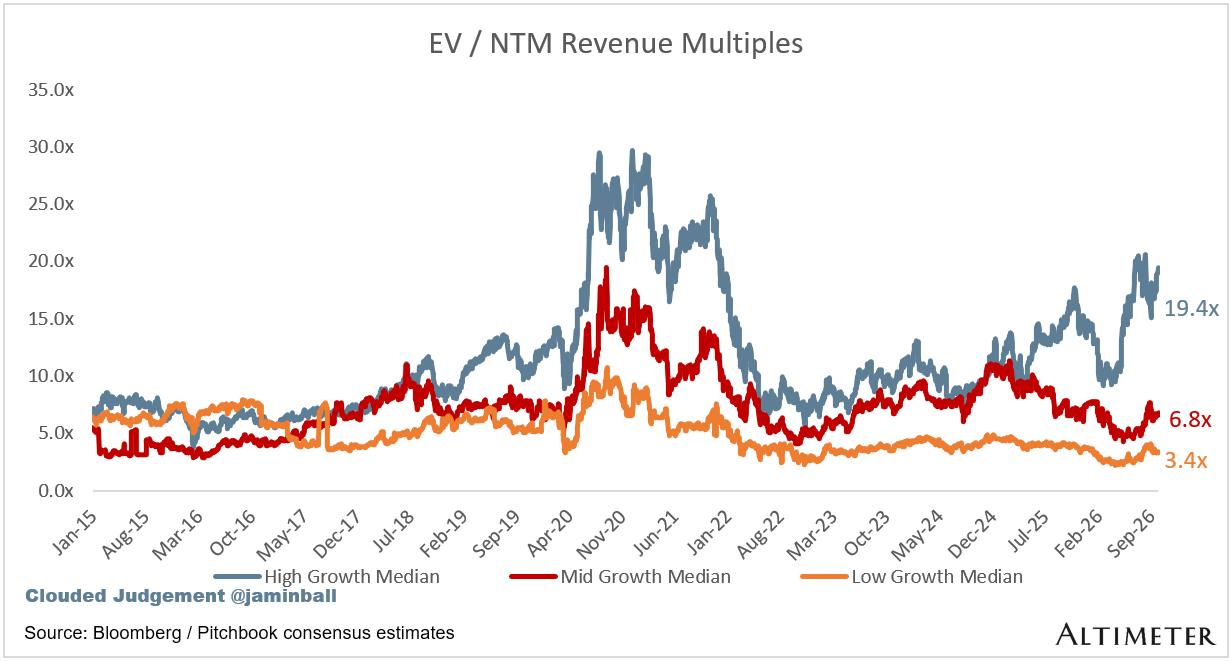
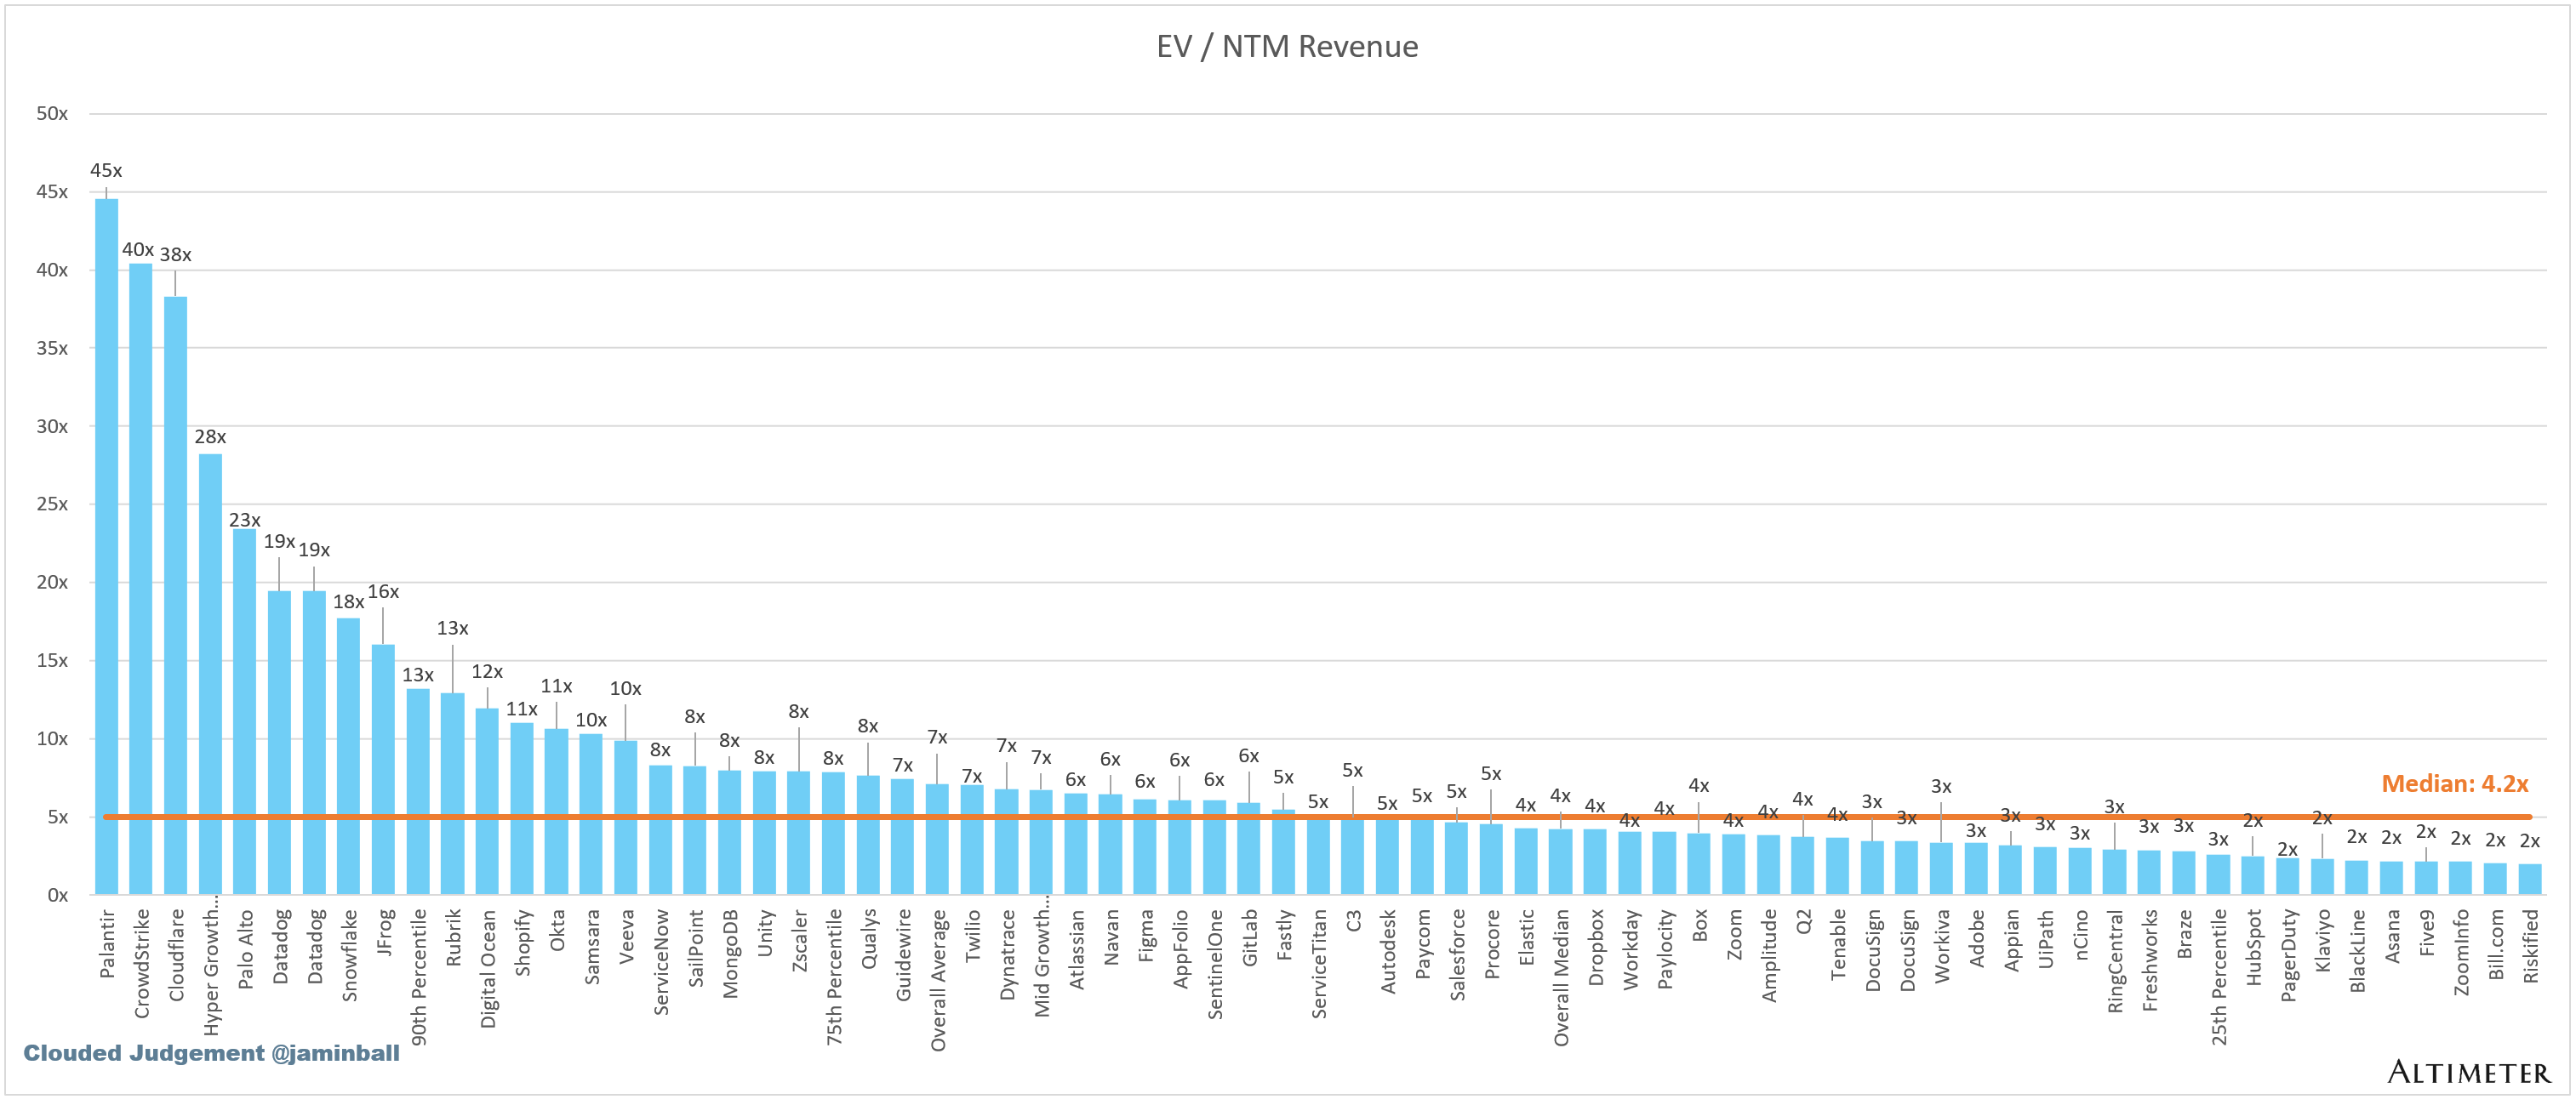
SaaS businesses are generally valued on a multiple of their revenue - in most cases the projected revenue for the next 12 months. Revenue multiples are a shorthand valuation framework. Given most software companies are not profitable, or not generating meaningful FCF, it’s the only metric to compare the entire industry against. Even a DCF is riddled with long term assumptions. The promise of SaaS is that growth in the early years leads to profits in the mature years. Multiples shown below are calculated by taking the Enterprise Value (market cap + debt - cash) / NTM revenue.
Overall Stats:
Overall Median: 4.2x
Top 5 Median: 38.3x
10Y: 5.2%
Bucketed by Growth. In the buckets below I consider high growth >22% projected NTM growth, mid growth 15%-22% and low growth <15%. I had to adjusted the cut off for “high growth.” If 22% feels a bit arbitrary, it’s because it is…I just picked a cutoff where there were ~10 companies that fit into the high growth bucket so the sample size was more statistically significant
High Growth Median: 19.4x
Mid Growth Median: 6.8x
Low Growth Median: 3.4x
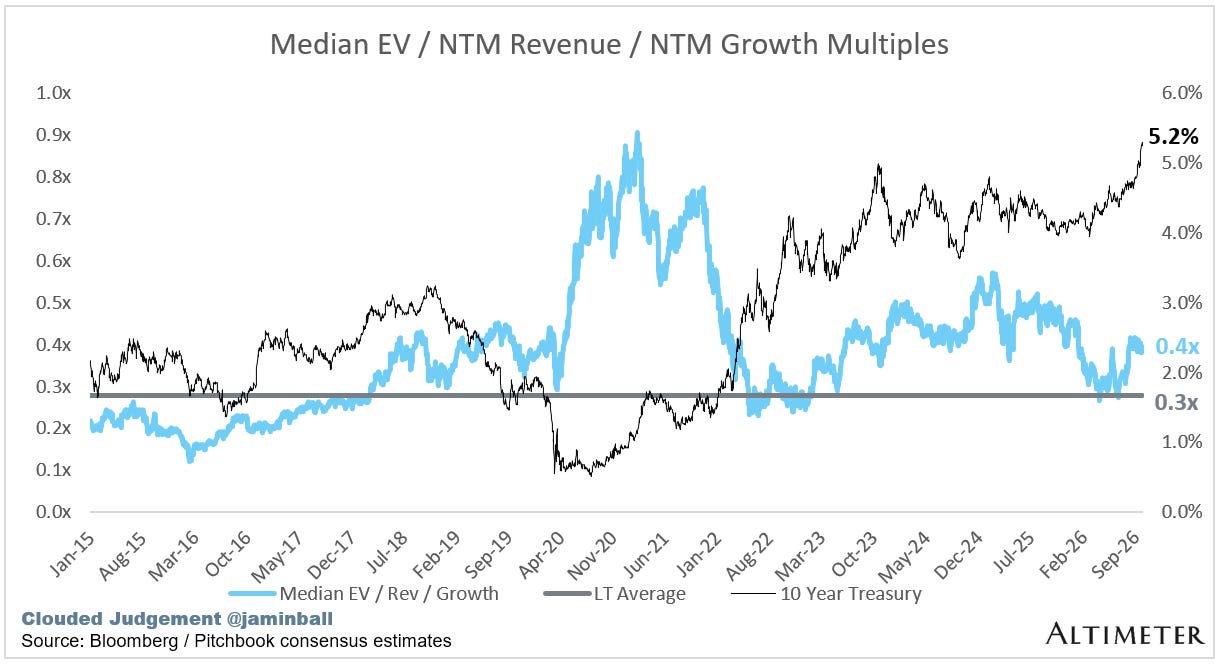
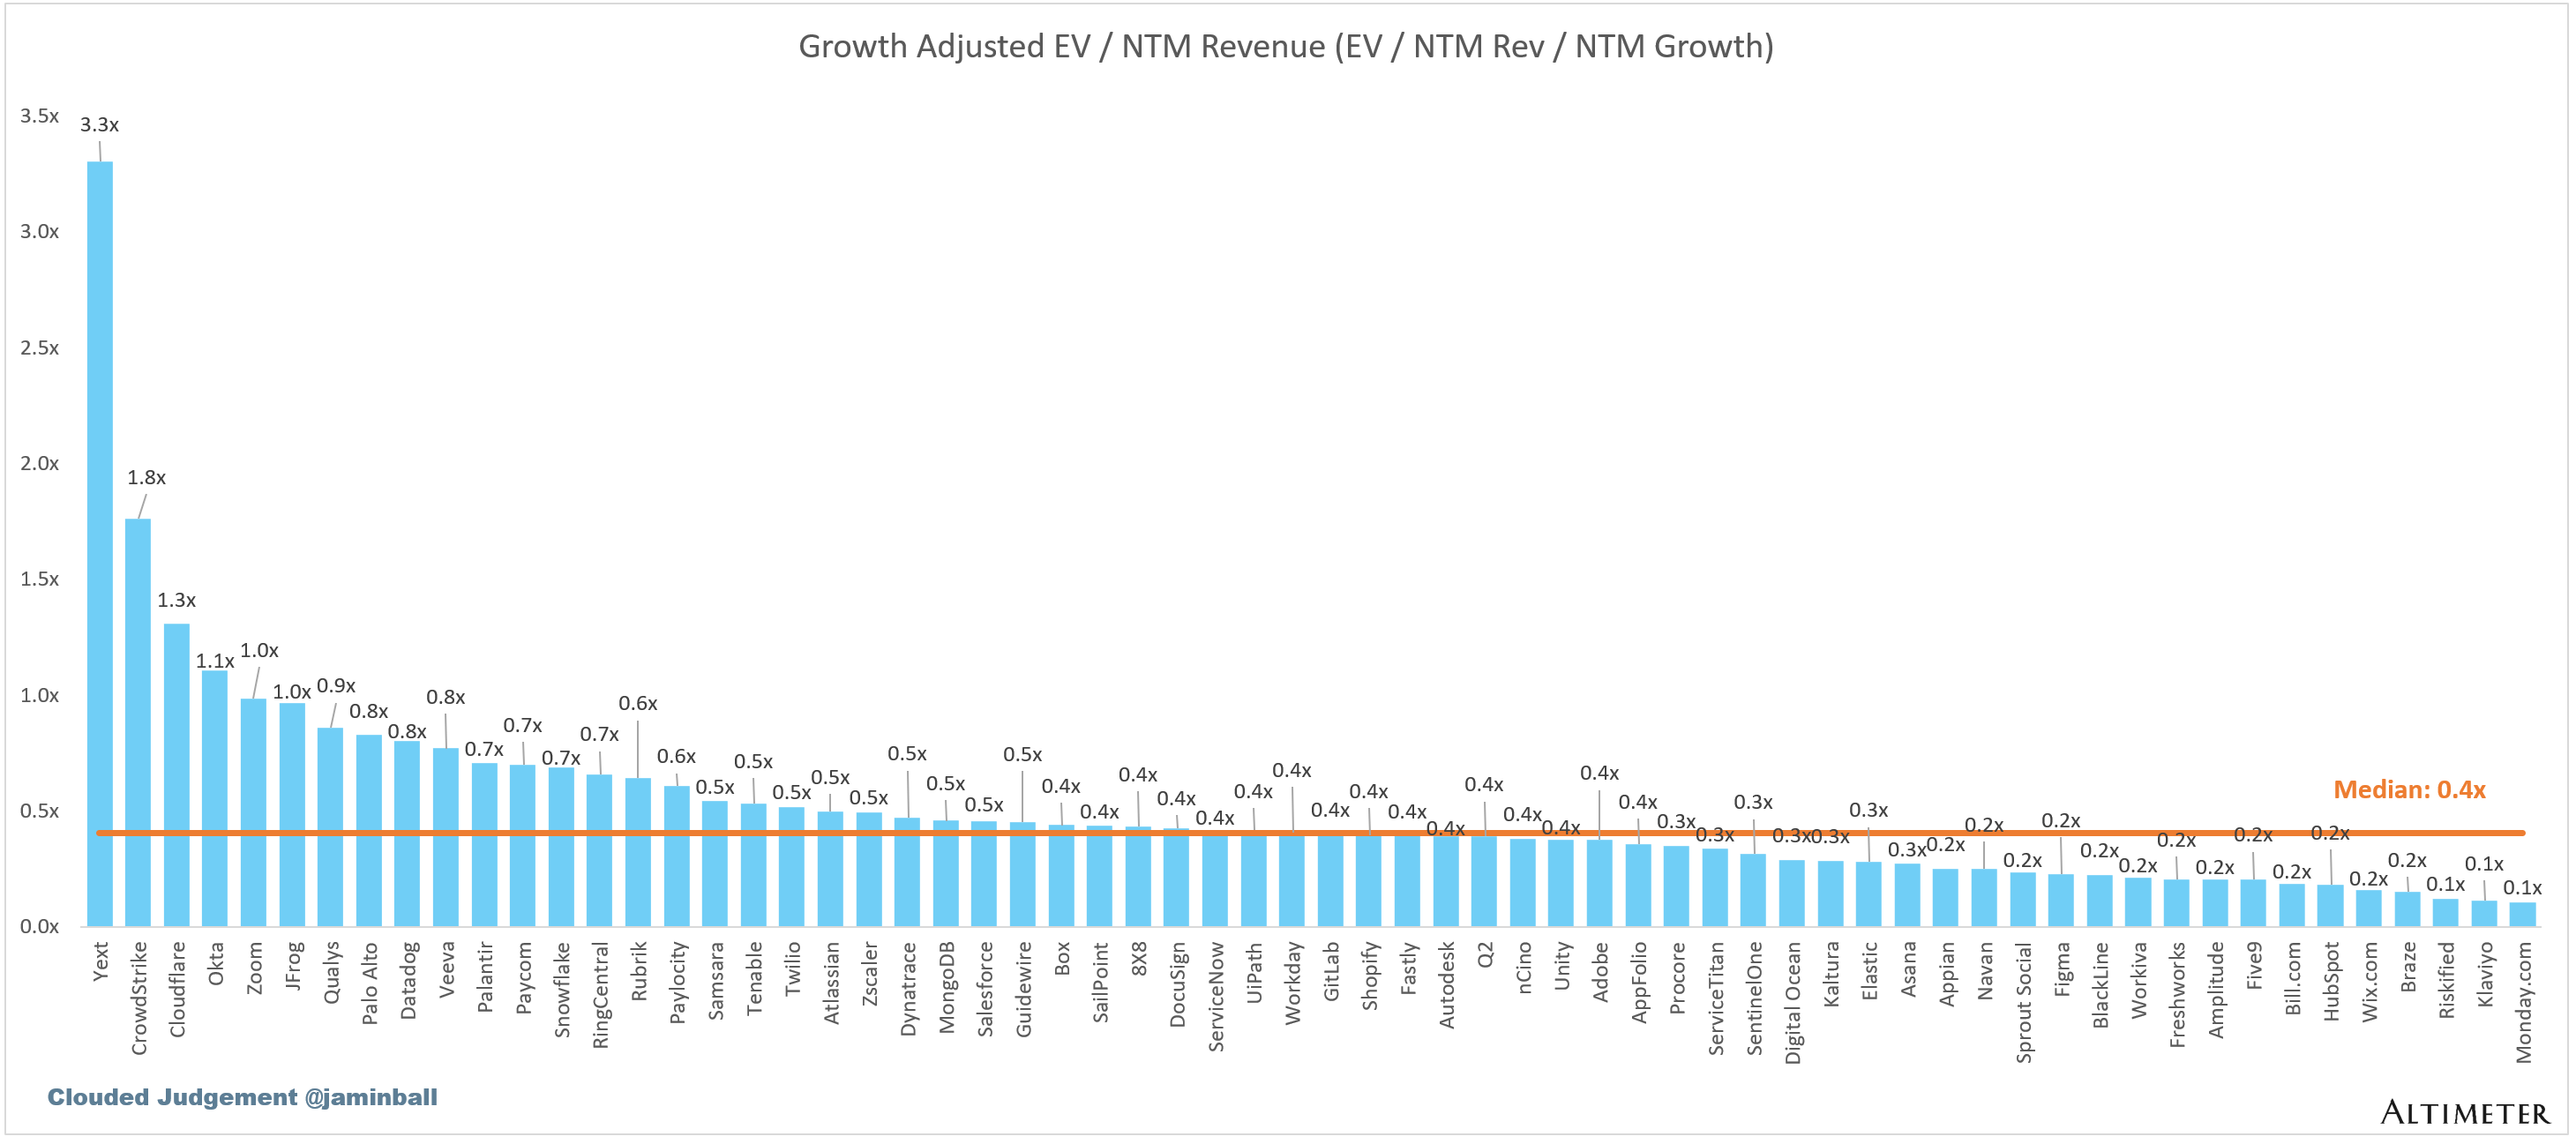
EV / NTM Rev / NTM Growth
The below chart shows the EV / NTM revenue multiple divided by NTM consensus growth expectations. So a company trading at 20x NTM revenue that is projected to grow 100% would be trading at 0.2x. The goal of this graph is to show how relatively cheap / expensive each stock is relative to its growth expectations.
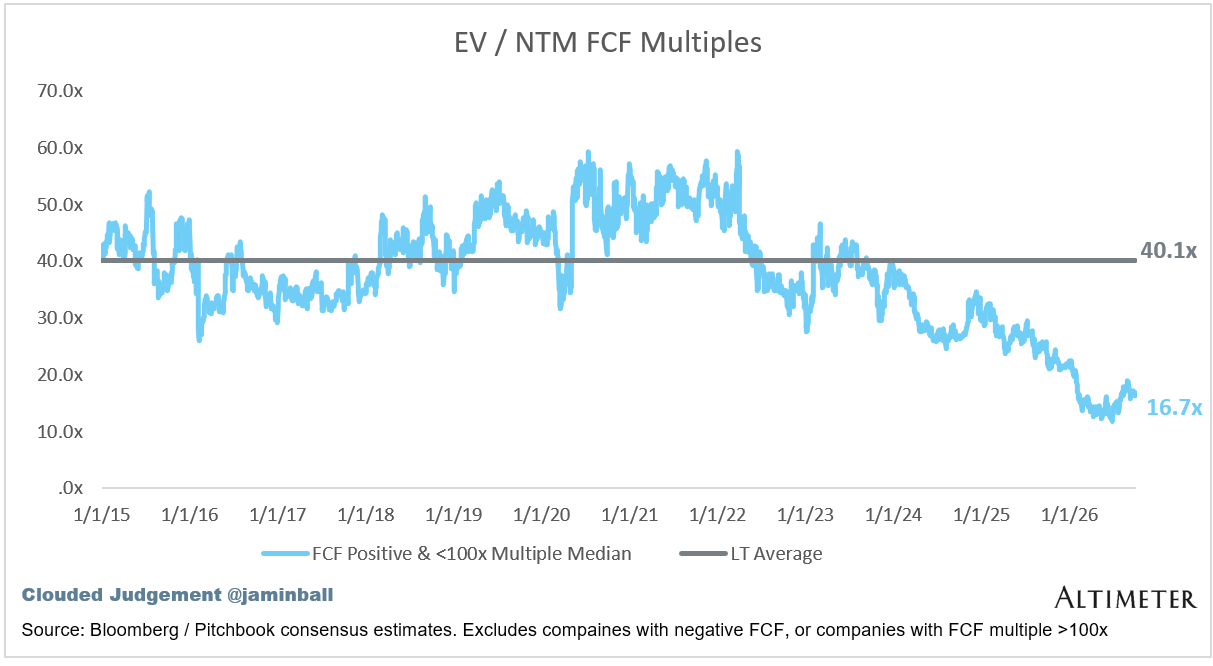
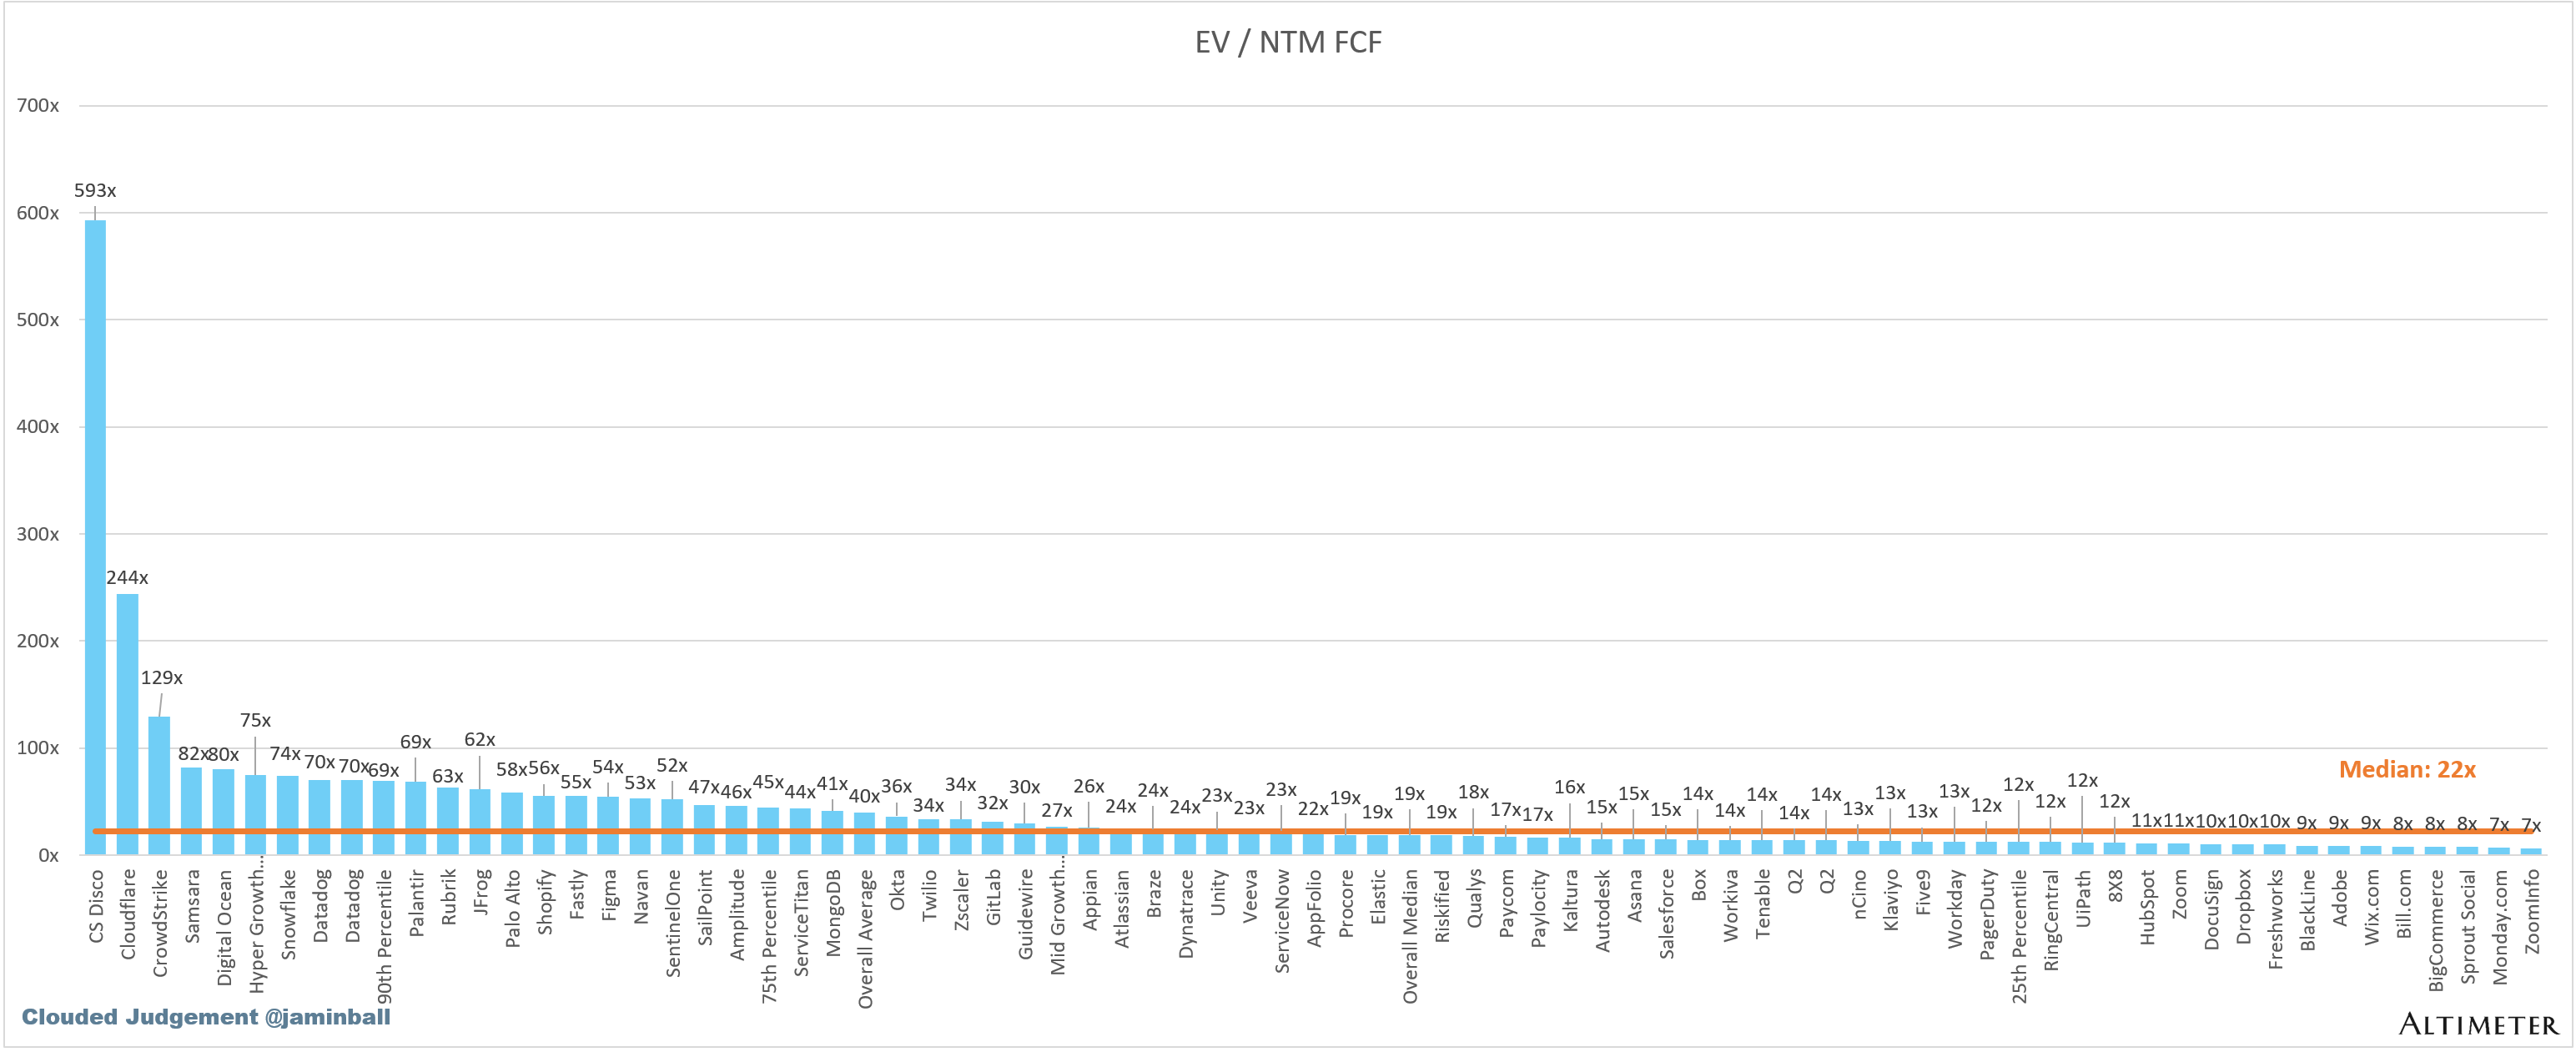
EV / NTM FCF
The line chart shows the median of all companies with a FCF multiple >0x and <100x. I created this subset to show companies where FCF is a relevant valuation metric.
Companies with negative NTM FCF are not listed on the chart
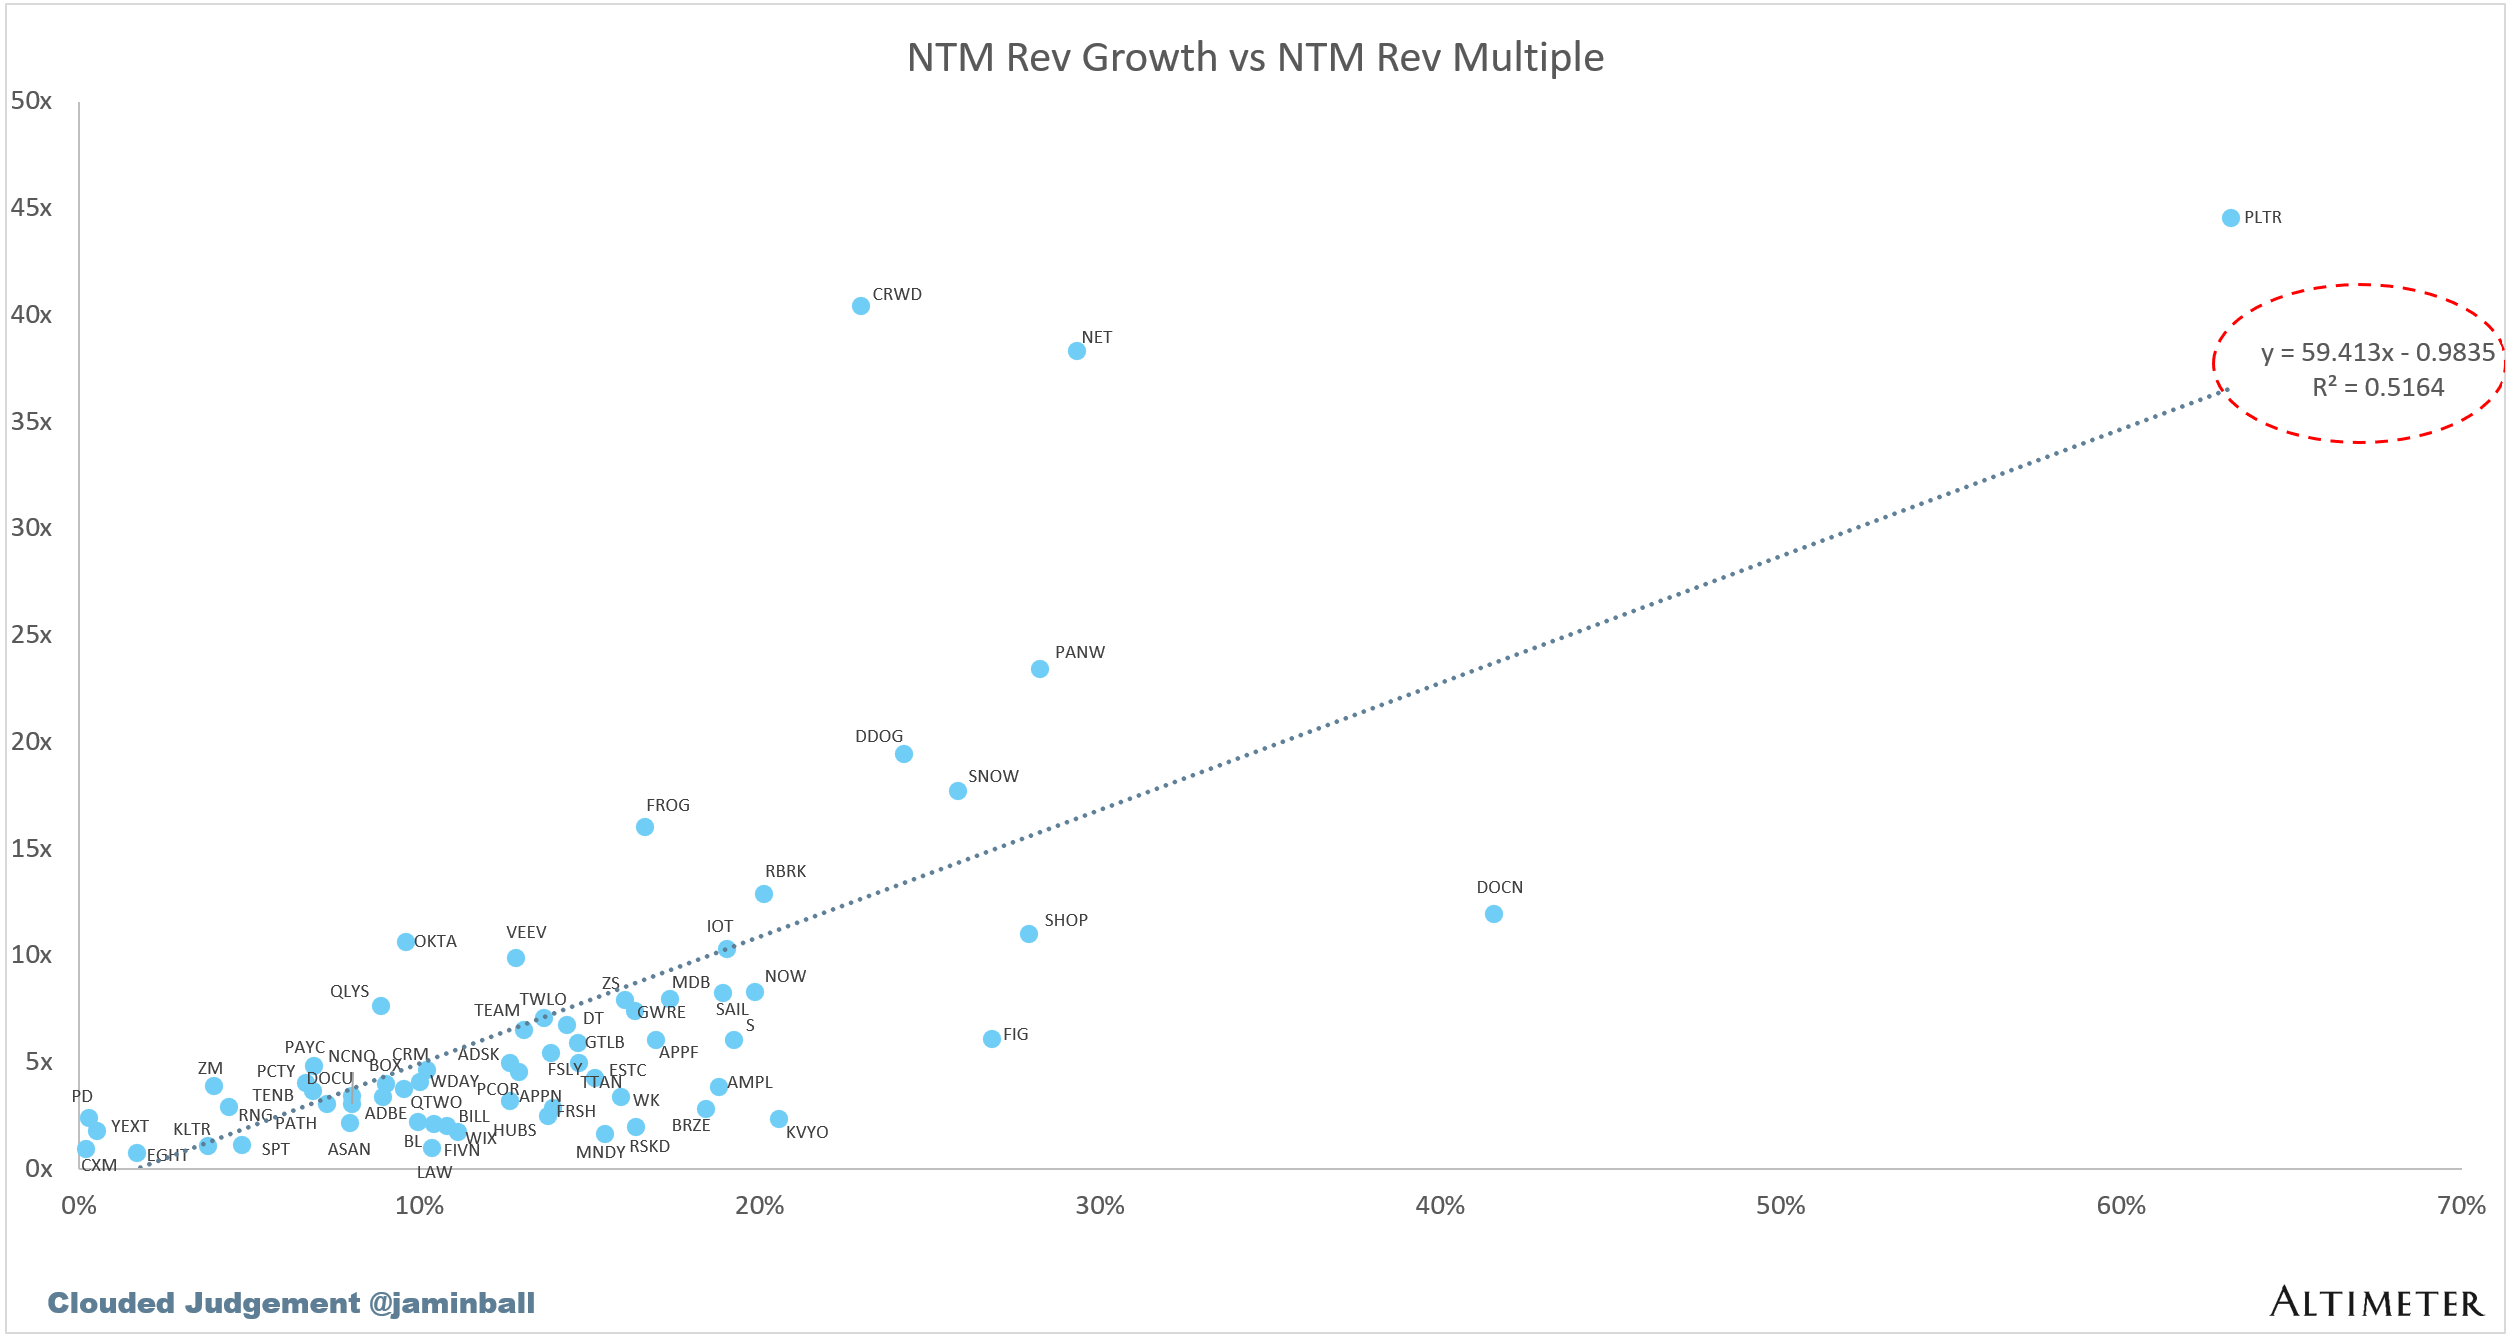
Scatter Plot of EV / NTM Rev Multiple vs NTM Rev Growth
How correlated is growth to valuation multiple?
Operating Metrics
Median NTM growth rate: 13%
Median LTM growth rate: 16%
Median Gross Margin: 76%
Median Operating Margin 4%
Median FCF Margin: 21%
Median Net Retention: 110%
Median CAC Payback: 31 months
Median S&M % Revenue: 34%
Median R&D % Revenue: 22%
Median G&A % Revenue: 13%
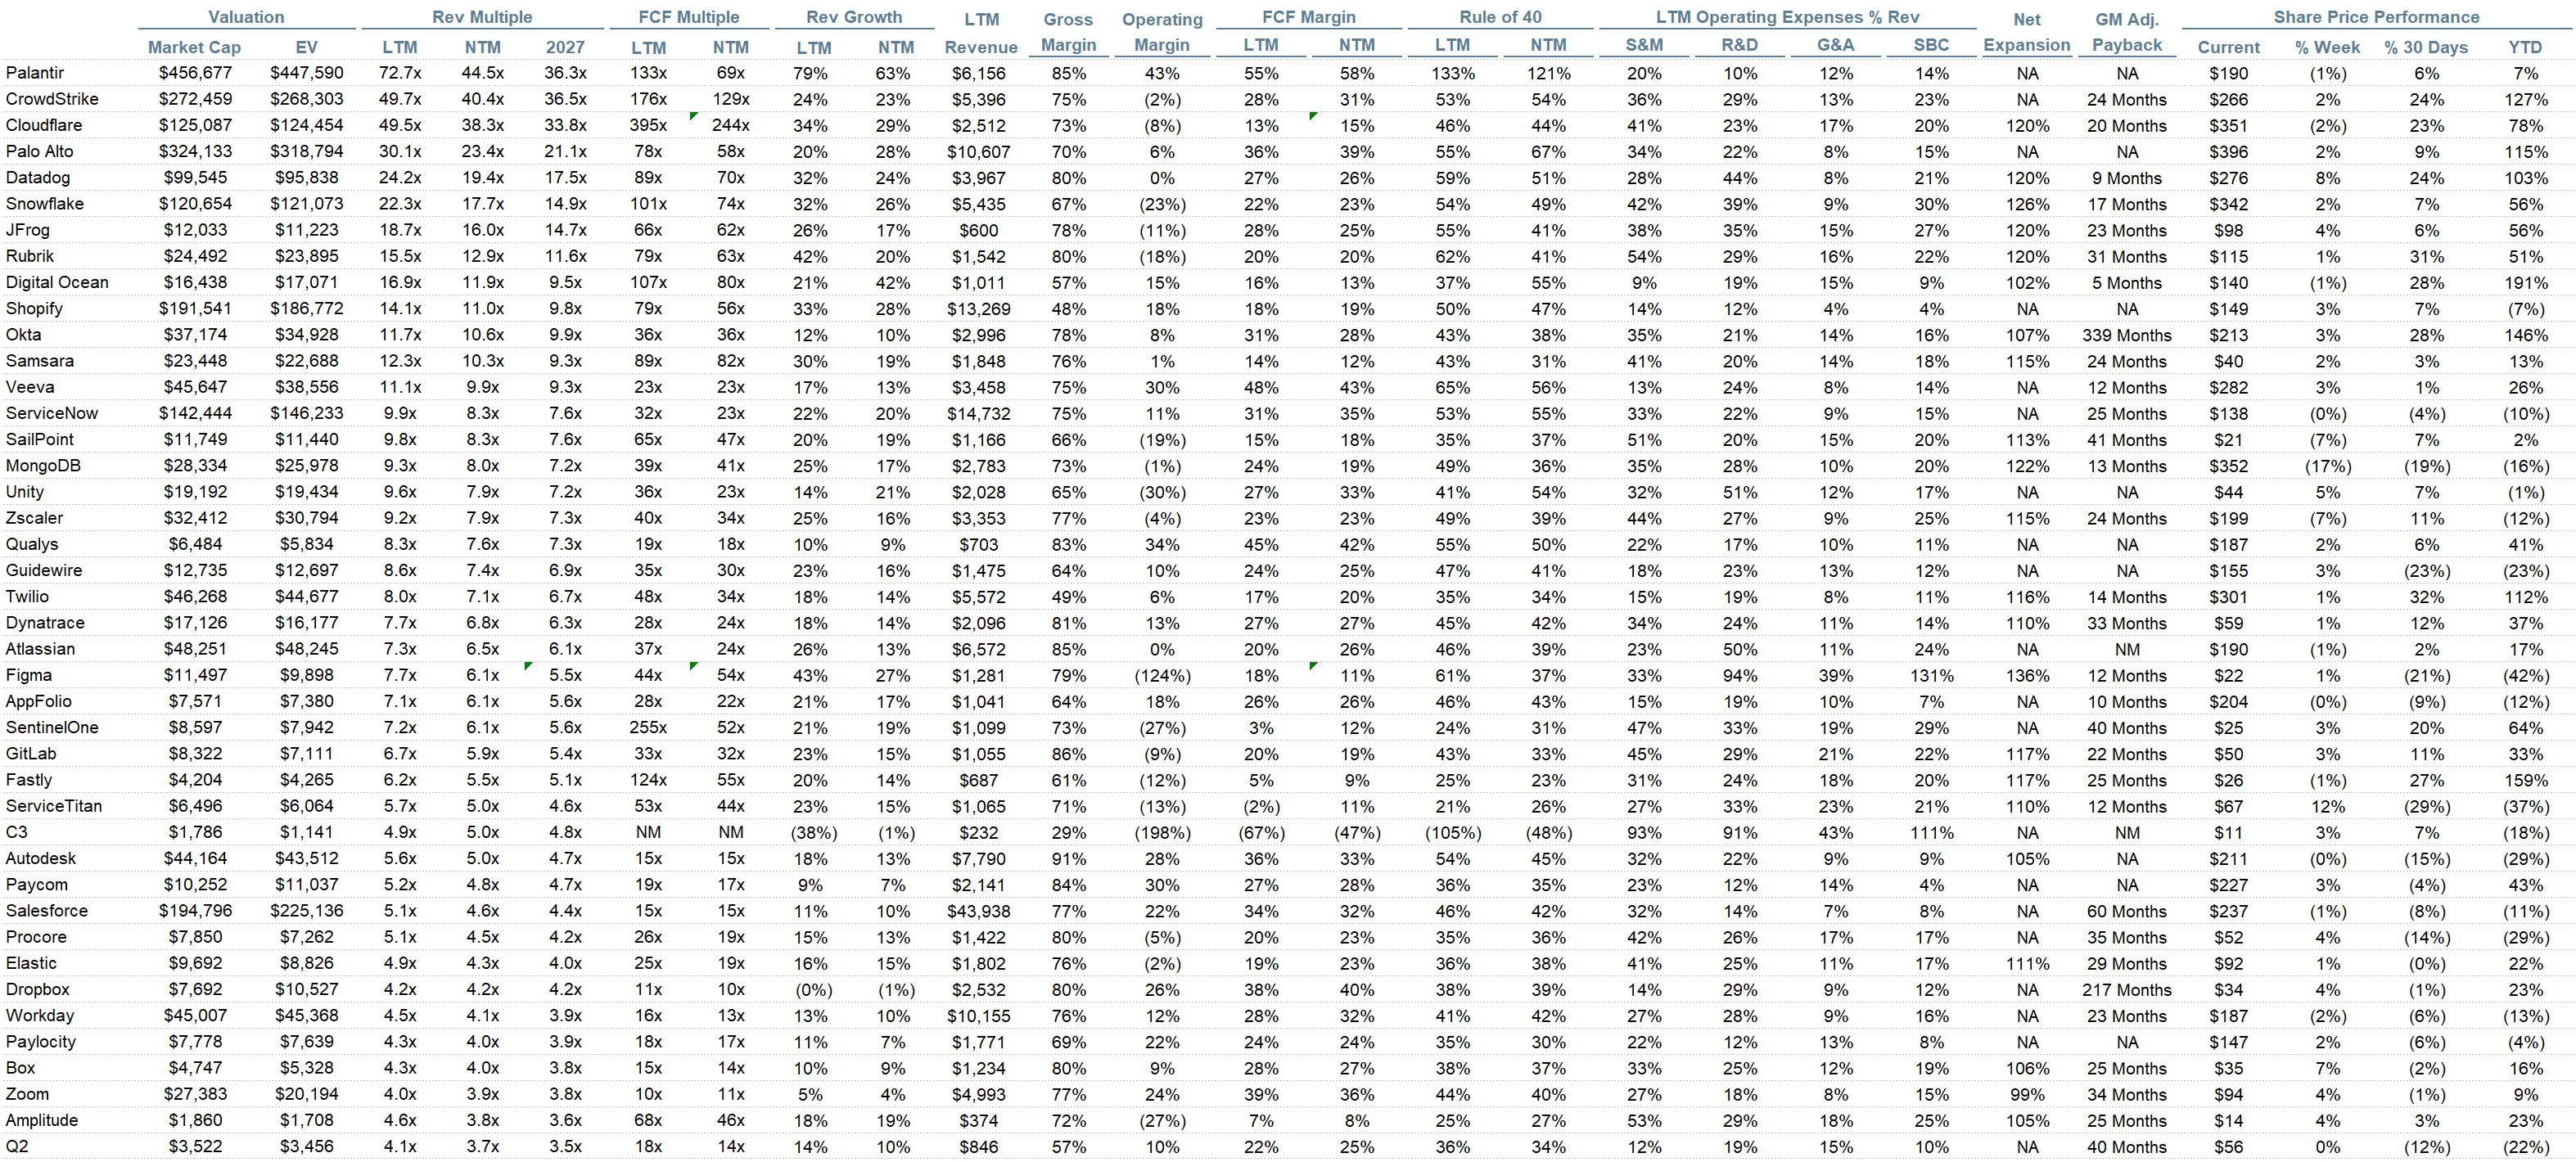
Comps Output
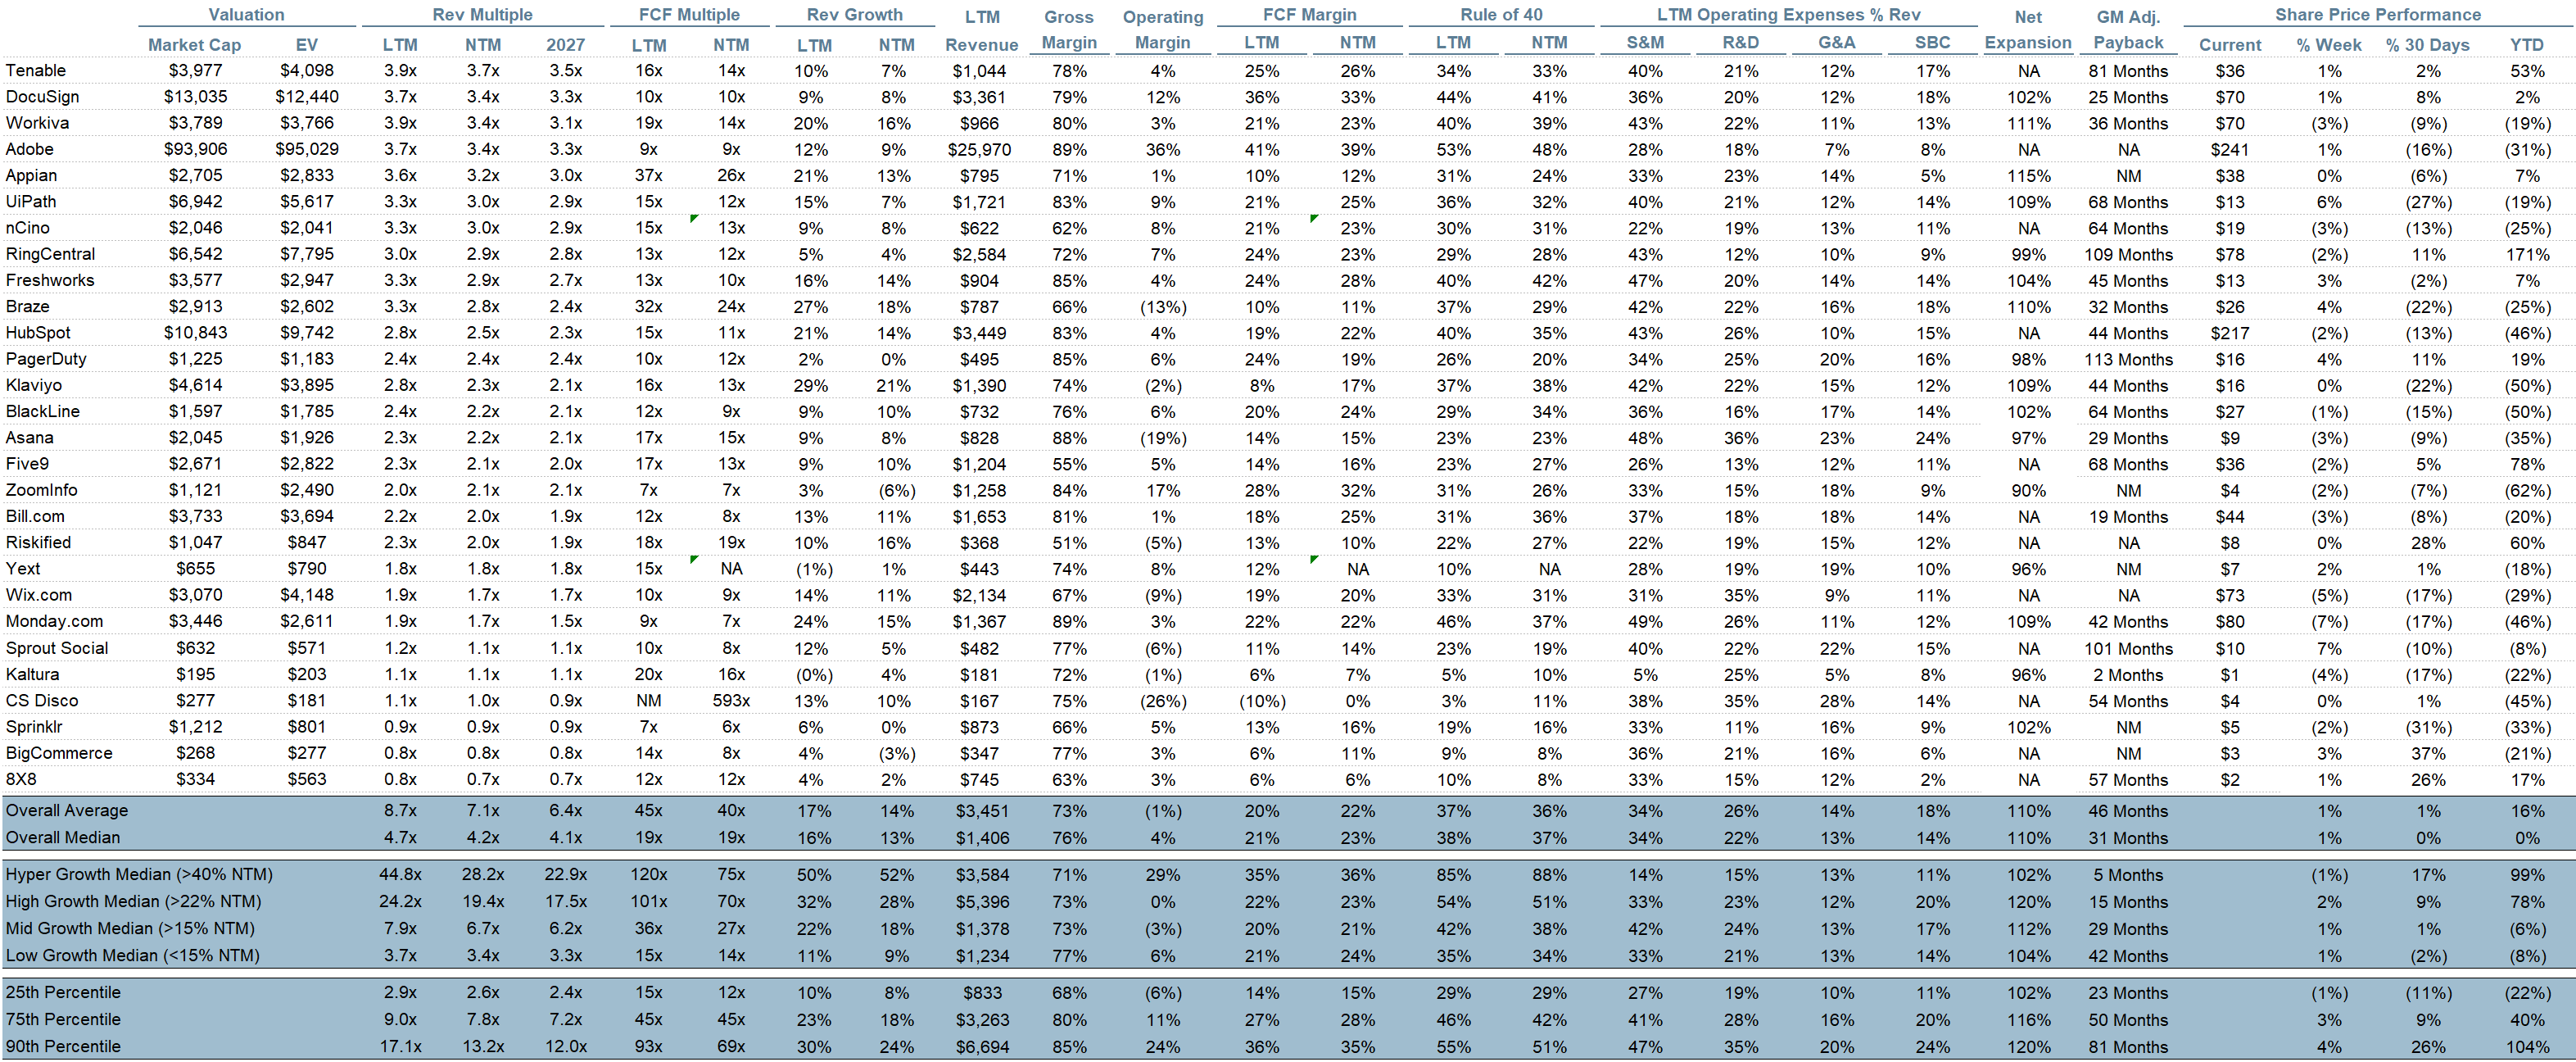
Rule of 40 shows rev growth + FCF margin (both LTM and NTM for growth + margins). FCF calculated as Cash Flow from Operations - Capital Expenditures
GM Adjusted Payback is calculated as: (Previous Q S&M) / (Net New ARR in Q x Gross Margin) x 12. It shows the number of months it takes for a SaaS business to pay back its fully burdened CAC on a gross profit basis. Most public companies don’t report net new ARR, so I’m taking an implied ARR metric (quarterly subscription revenue x 4). Net new ARR is simply the ARR of the current quarter, minus the ARR of the previous quarter. Companies that do not disclose subscription rev have been left out of the analysis and are listed as NA.
Sources used in this post include Bloomberg, Pitchbook and company filings
The information presented in this newsletter is the opinion of the author and does not necessarily reflect the view of any other person or entity, including Altimeter Capital Management, LP (”Altimeter”). The information provided is believed to be from reliable sources but no liability is accepted for any inaccuracies. This is for information purposes and should not be construed as an investment recommendation. Past performance is no guarantee of future performance. Altimeter is an investment adviser registered with the U.S. Securities and Exchange Commission. Registration does not imply a certain level of skill or training. Altimeter and its clients trade in public securities and have made and/or may make investments in or investment decisions relating to the companies referenced herein. The views expressed herein are those of the author and not of Altimeter or its clients, which reserve the right to make investment decisions or engage in trading activity that would be (or could be construed as) consistent and/or inconsistent with the views expressed herein.
This post and the information presented are intended for informational purposes only. The views expressed herein are the author’s alone and do not constitute an offer to sell, or a recommendation to purchase, or a solicitation of an offer to buy, any security, nor a recommendation for any investment product or service. While certain information contained herein has been obtained from sources believed to be reliable, neither the author nor any of his employers or their affiliates have independently verified this information, and its accuracy and completeness cannot be guaranteed. Accordingly, no representation or warranty, express or implied, is made as to, and no reliance should be placed on, the fairness, accuracy, timeliness or completeness of this information. The author and all employers and their affiliated persons assume no liability for this information and no obligation to update the information or analysis contained herein in the future.
Yes, AND, what does this do to the 30-year out cash flow models for $Ts of debt that need paying back? Where is that risk ultimately held? It is a joke, but not a good one. Much of that debt is held by the same folks who finance office buildings that stay around a while without changing much. This is changing like crazy, which is good and really inevitable for something so powerful and new. One exciting part is it feels like we have yet another sort of a new abstraction layer going on, from token to agent to harness to decision somehow, but maybe also one that does not cost 10x more compute for say 10x more performance. But until we understand how this intelligence scales better, we are all sitting on a ticking time bomb as existing cash flow models come under question. Just watch the OpenAI IPO drama. Grab your popcorn because the fireworks should get intense.
The jump from '100x cheaper' to a much smaller gap against a lightweight model was worth pausing on. For a classification task, the comparison I'd want is the cheapest alternative that meets the accuracy and latency requirements—not automatically the biggest model.