Clouded Judgement 10.23.20
Every week I’ll provide updates on the latest trends in SaaS valuations, earnings announcements, and highlight any significant news. Follow along to stay up to date!
Highlight of the Week - Morgan Stanley Q3 CIO Survey
Every quarter Morgan Stanley releases a CIO survey that highlights important market trends. Here are some of their takeaways in the most recent edition (direct quotes):
“IT Budgets Poised to Rebound into 2021, But Still Expecting Modest Growth. The theme of an accelerating pace of digital transformation espoused by many
tech executives and likely reflected in lofty valuations across the sector found
some support in our Q3 CIO survey, as digital transformation is expected to be
the top priority for 16% of CIOs in 2021 (second only to Cloud Computing at 23%
of CIOs).”“Initial CIO expectations for 2021 indicate that Software spend will accelerate 460 bps to +2.1% in 2021 from -2.5% in 2020 and Hardware spend will accelerate 410 bps to 0.5% in 2021 from -3.6% in 2020, while Services spend will accelerate 380 bps to 0.5% in 2021 from -3.3% in 2020.”
“Software spending expected to rebound solidly in 2021, but growth still
below historical averages. CIOs expect software spending growth to
improve from -2.5% in 2020 to +2.1% in 2021 – the sharpest rebound by
industry, but still well below the 3-year average of 4.1% growth. Durable
growth and margin upside have driven the software group up ~65% YTD,
with valuation well above historical averages, particularly for high growth
assets. For software vendors growing >20%, NTM EV/Sales multiples
average 17.8x, below the peak of ~20x seen in July, but still well above the
5-year average of 8.2x.”
Q3 Earnings Season Calendar
Earnings kick off next week! Below is a calendar of earnings release dates

Top 10 EV / NTM Revenue Multiples

Top 10 Weekly Share Price Movement

Update on Multiples
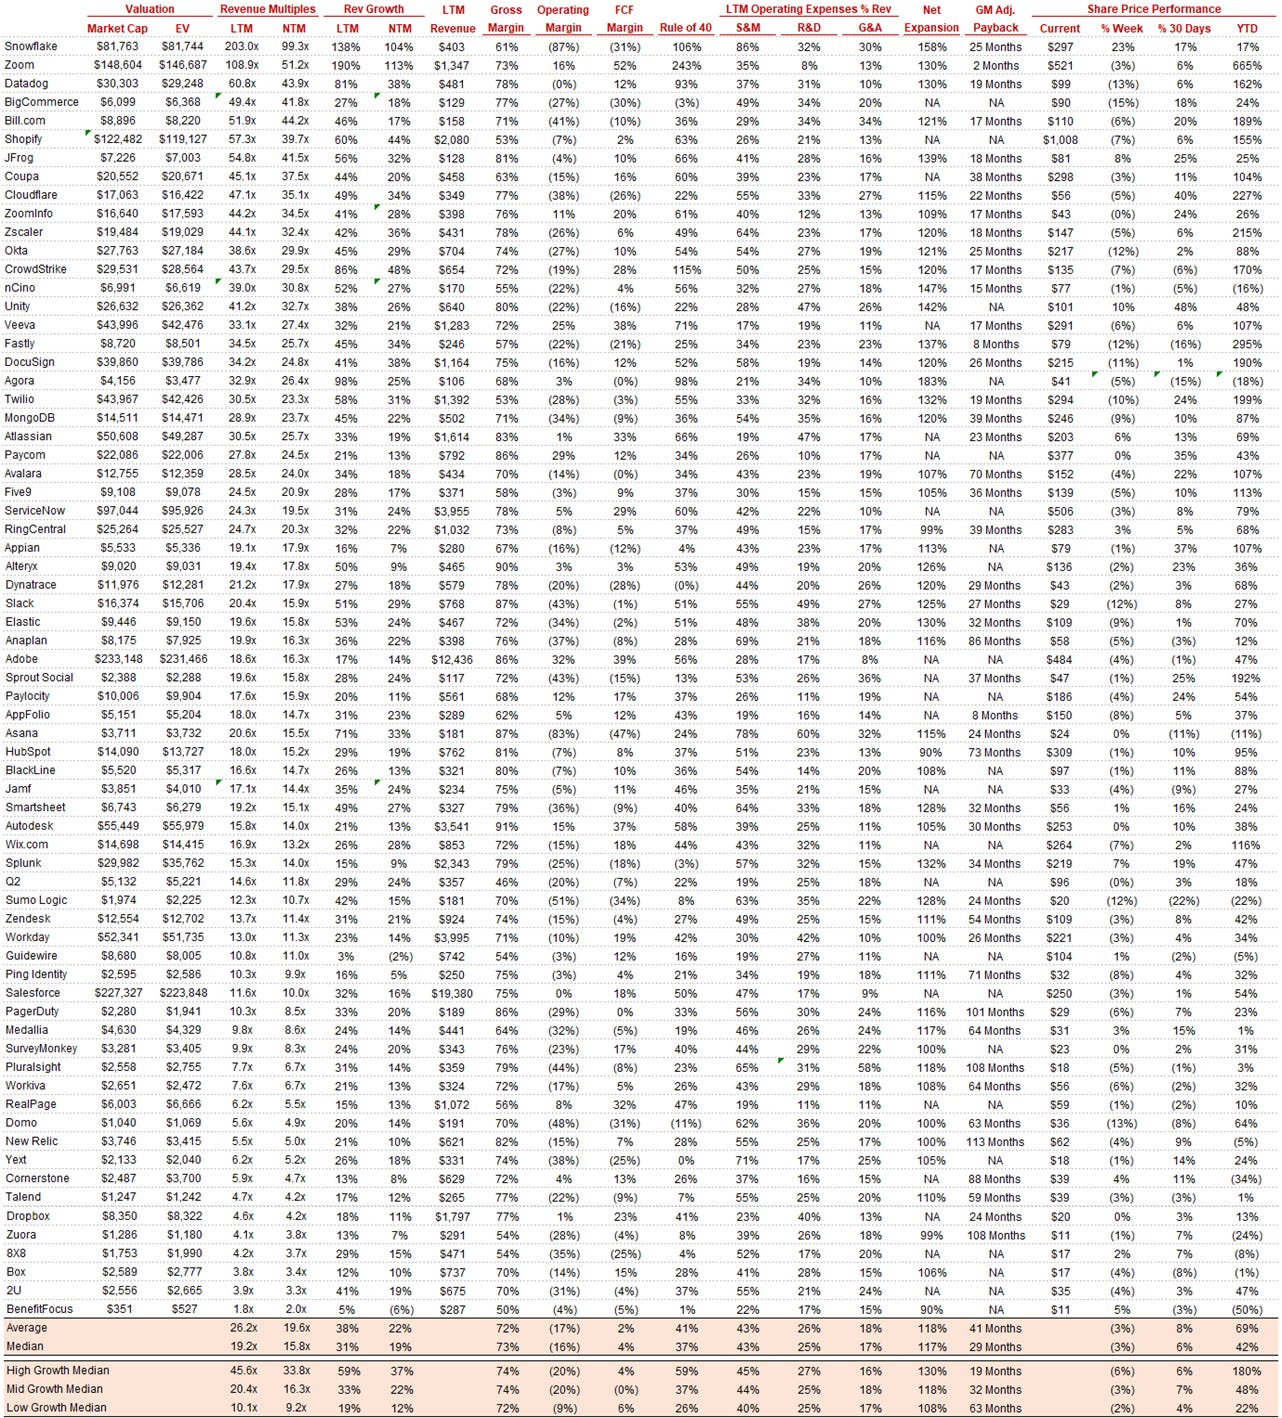
SaaS businesses are valued on a multiple of their revenue - in most cases the projected revenue for the next 12 months. Multiples shown below are calculated by taking the Enterprise Value (market cap + debt - cash) / NTM revenue. In the buckets below I consider high growth >30% projected NTM growth, mid growth 15%-30% and low growth <15%
Overall Stats:
Overall Median: 15.8x
Top 5 Median: 44.2x
3 Month Trailing Average: 14.6x
1 Year Trailing Average: 11.6x


Bucketed by Growth:
High Growth Median: 33.8x
Mid Growth Median: 16.3x
Low Growth Median: 9.2x


Operating Metrics
Median NTM growth rate: 19%
Median LTM growth rate: 31%
Median Gross Margin: 73%
Median Operating Margin (16%)
Median FCF Margin: 4%
Median Net Retention: 117%
Median CAC Payback: 29 months
Median S&M % Revenue: 43%
Median R&D % Revenue: 25%
Median G&A % Revenue: 17%
News
Splunk announced the launch of their observability suite at their conference
MongoDB announced Atlas is the first cloud database to enable customers to run applications simultaneously on all major cloud providers
Dynatrace and ServiceNow announced a strengthened cloud AIOps partnership
Comps Output
Rule of 40 shows LTM growth rate + LTM FCF Margin. FCF calculated as Cash Flow from Operations - Capital Expenditures
GM Adjusted Payback is calculated as: (Previous Q S&M) / (Net New ARR in Q x Gross Margin) x 12 . It shows the number of months it takes for a SaaS business to payback their fully burdened CAC on a gross profit basis. Most public companies don’t report net new ARR, so I’m taking an implied ARR metric (quarterly subscription revenue x 4). Net new ARR is simply the ARR of the current quarter, minus the ARR of the previous quarter. Companies that do not disclose subscription rev have been left out of the analysis and are listed as NA.


