Every week I’ll provide updates on the latest trends in cloud software companies. Follow along to stay up to date!
Hyperscalers Report Quarterly Earnings
This week we saw AWS (Amazon), GCP (Google) and Azure (Microsoft) report earnings. Overall, it wasn’t pretty… AWS grew 28% when expectations were 30-31%. At the same time operating margins came down significantly (26% this quarter which is down from 29% last quarter and 30% in Q3 ‘21). The big swing in operating income is the bigger issue. At the same time, Azure came in below expectations. They grew 42% YoY this quarter when their guidance was for 43%.
Oof.. Tough. Both Microsoft and Amazon called out broad based customer optimization efforts to reduce their AWS and Azure bills (not a great signal for other consumption based peers like Snowflake, Datadog, Mongo, etc). At the same time, I’d guess we’re seeing discounts on egress fees and a lot of customers shifting from spot pricing (highest marginal cost) to committed contracts (lower marginal cost). All of these broadly falling into the bucket of customers looking to spend less, with a similar marginal cost structure for the cloud providers (hence the lower operating margin from AWS). The other piece is higher energy costs (to service their data centers). Azure called out an incremental $800m of costs expected throughout the year (they just finished their Fiscal Q1). They said the $800m is back loaded in the final 3 quarters, with a smaller hit this quarter. These increased energy costs also effect margins. The hyperscalers are playing the long game - they want to capture customers in their own ecosystem by being more helpful with optimizations / discounts. You could argue a shift to committed contracts gives them more stability, and a higher lifetime value of each customer. Regardless, the misses by the hyperscalers is a good proxy for broader enterprise software demand. It’s always great that the hyper scalers report first, I’ll keep an eye on all of the upcoming reports to see what trends emerge.
Some quotes:
From AWS: “With the ongoing macroeconomic uncertainties, we've seen an uptick in AWS customers focused on controlling costs. And we're proactively working to help customers' cost optimize, just as we've done throughout AWS' history, especially in periods of economic uncertainty.”
From Microsoft: “what we did see through the quarter is a real focus, both by customers, but also by our sales and customer success teams on going proactively to customers and making sure we are helping them optimize their workloads. And as we went through the quarter and as, of course, the macroeconomic environment got more complicated, we continued to focus on that because ultimately, those optimizations bring value even as budgets are still growing and budgeted spend is still growing”
There were positives - Microsoft mentioned they have very good bookings growth, with RPO growth suggesting a higher velocity of committed contracts. Net net - this does feel like a big period of optimizations as opposed to something more structural. Here’s a summary of the state of each cloud provider:

GDP Report
We also got the Q3 GDP report. The economy grew 2.6% in Q3, after contracting for the previous 2 quarters. The below graphic shows a great breakdown of GDP the previous couple quarters. As I have talked about previously, the two quarters of contracting GDP were more of a head fake driven by one offs (net exports and private investments). Throughout, consumer spending has remained solid.
Quarterly Reports Summary
Earning season is upon us!
Top 10 EV / NTM Revenue Multiples
Top 10 Weekly Share Price Movement
Update on Multiples
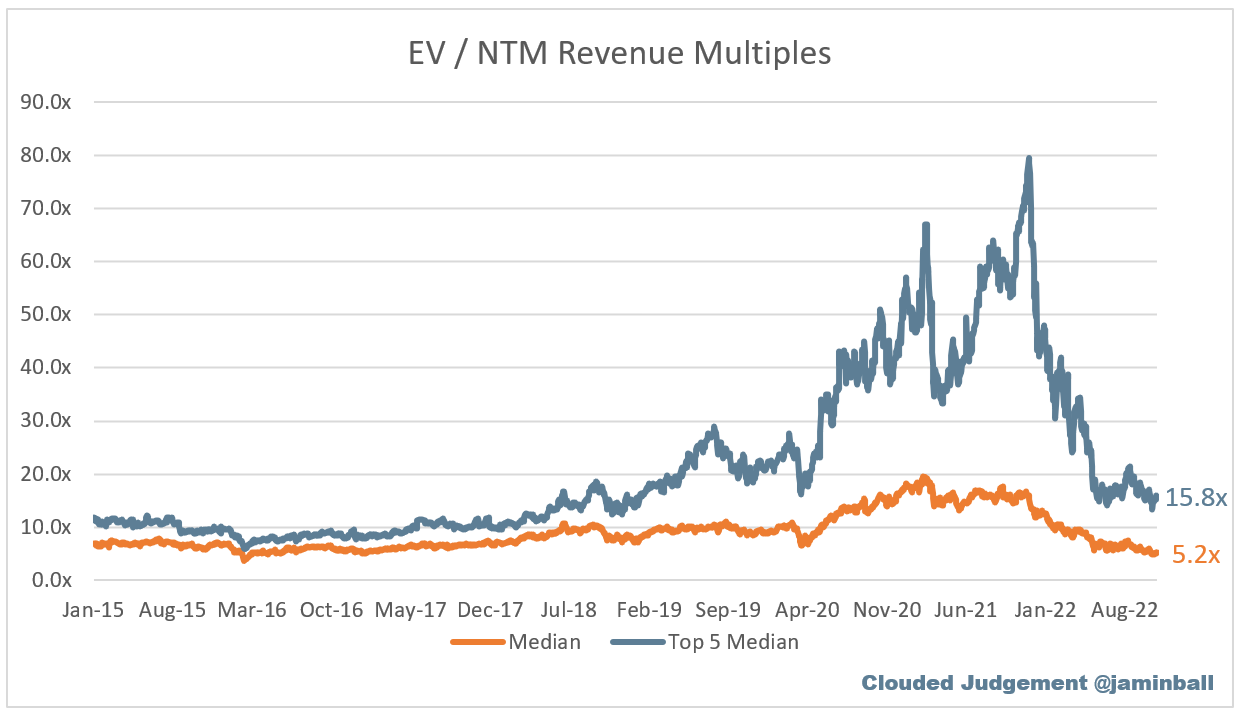
SaaS businesses are valued on a multiple of their revenue - in most cases the projected revenue for the next 12 months. Multiples shown below are calculated by taking the Enterprise Value (market cap + debt - cash) / NTM revenue.
Overall Stats:
Overall Median: 5.2x
Top 5 Median: 15.8x
10Y: 3.9%
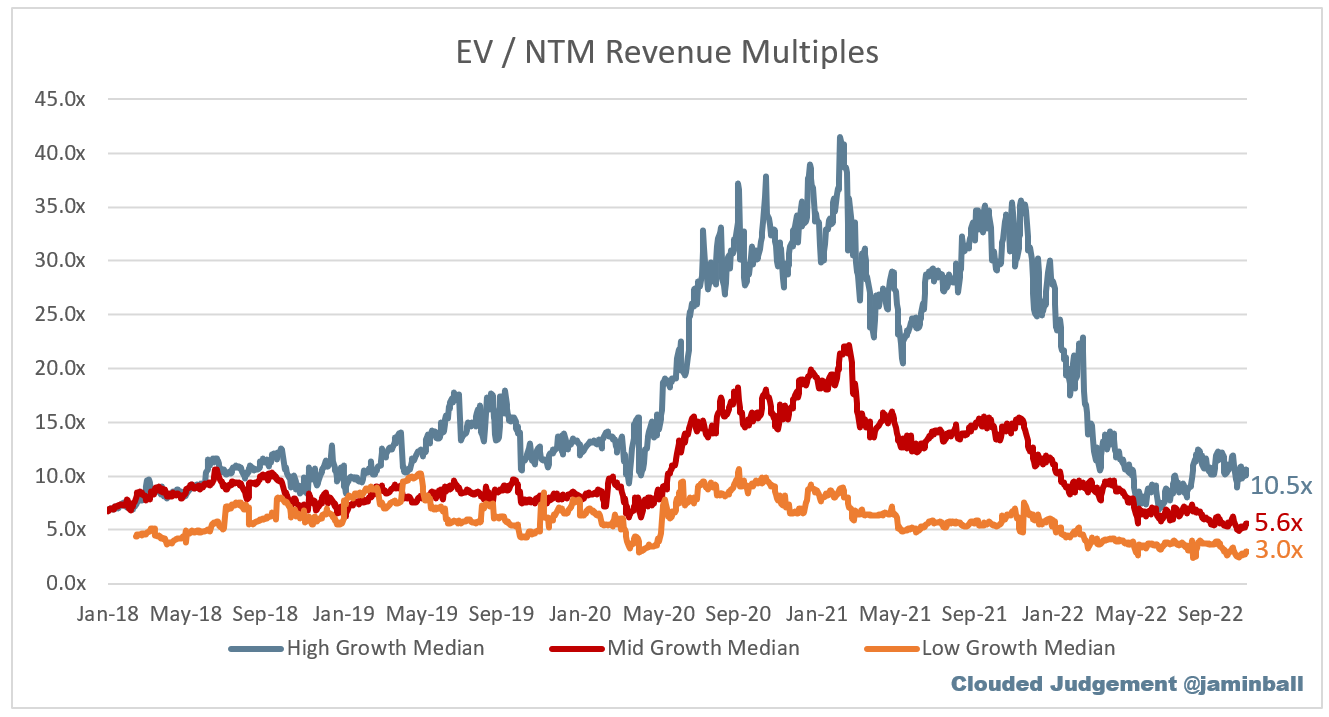
Bucketed by Growth. In the buckets below I consider high growth >30% projected NTM growth, mid growth 15%-30% and low growth <15%
High Growth Median: 10.5x
Mid Growth Median: 5.6x
Low Growth Median: 3.0x
Scatter Plot of EV / NTM Rev Multiple vs NTM Rev Growth
How correlated is growth to valuation multiple?
Growth Adjusted EV / NTM Rev
The below chart shows the EV / NTM revenue multiple divided by NTM consensus growth expectations. The goal of this graph is to show how relatively cheap / expensive each stock is relative to their growth expectations
Operating Metrics
Median NTM growth rate: 21%
Median LTM growth rate: 30%
Median Gross Margin: 74%
Median Operating Margin (25%)
Median FCF Margin: 0%
Median Net Retention: 120%
Median CAC Payback: 33 months
Median S&M % Revenue: 48%
Median R&D % Revenue: 28%
Median G&A % Revenue: 20%
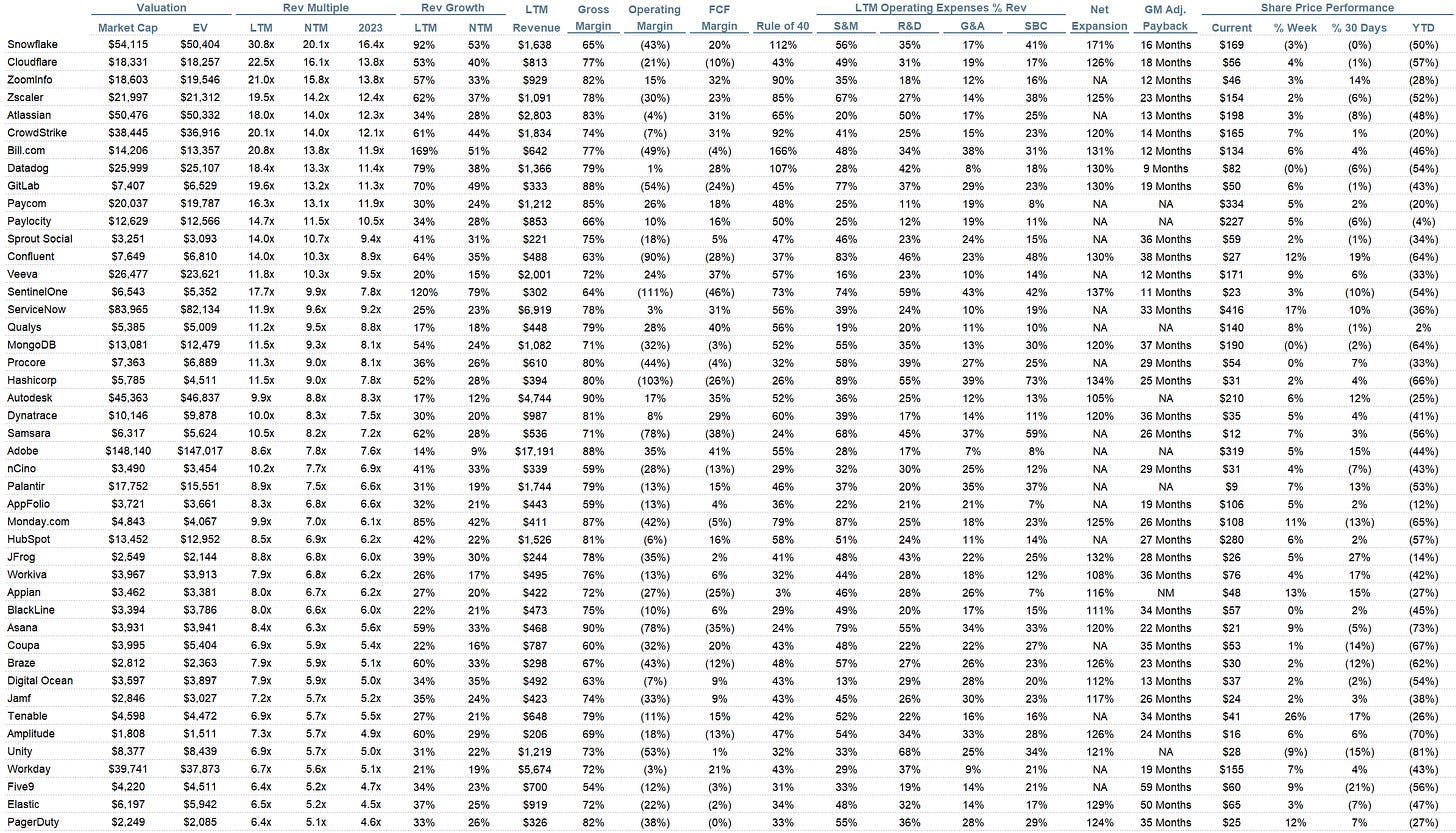
Comps Output
Rule of 40 shows LTM growth rate + LTM FCF Margin. FCF calculated as Cash Flow from Operations - Capital Expenditures
GM Adjusted Payback is calculated as: (Previous Q S&M) / (Net New ARR in Q x Gross Margin) x 12 . It shows the number of months it takes for a SaaS business to payback their fully burdened CAC on a gross profit basis. Most public companies don’t report net new ARR, so I’m taking an implied ARR metric (quarterly subscription revenue x 4). Net new ARR is simply the ARR of the current quarter, minus the ARR of the previous quarter. Companies that do not disclose subscription rev have been left out of the analysis and are listed as NA.
This post and the information presented are intended for informational purposes only. The views expressed herein are the author’s alone and do not constitute an offer to sell, or a recommendation to purchase, or a solicitation of an offer to buy, any security, nor a recommendation for any investment product or service. While certain information contained herein has been obtained from sources believed to be reliable, neither the author nor any of his employers or their affiliates have independently verified this information, and its accuracy and completeness cannot be guaranteed. Accordingly, no representation or warranty, express or implied, is made as to, and no reliance should be placed on, the fairness, accuracy, timeliness or completeness of this information. The author and all employers and their affiliated persons assume no liability for this information and no obligation to update the information or analysis contained herein in the future.


Interesting commentary on hyperscalers being impacted by increasing cost of energy. At some point they will have to pass this on to customers, but with customers opting for more "fixed price" committed contracts this will impact operating margin even more significantly in 3-5 quarter's time.
Good analysis