Every week I’ll provide updates on the latest trends in cloud software companies. Follow along to stay up to date!
Rates Update
The 10Y has jumped from 3.7% at the start of October to 4.3% today. A ~15% move up in a month! Robust jobs / unemployment / broader positive economic data caused investors to reassess their expectations for future Fed actions. The likelihood of aggressive rate cuts in the near future has dropped, and the market sees a lower probability of rate cuts at the Fed’s November and December meetings. There’s also a school of thought that the Fed may in fact need to keep rates higher for longer to manage inflation given the labor market strength.
AI Commentary
Some interesting AI commentary / stats I wanted to highlight from a couple earnings calls this week
Microsoft on AI
“We're excited that only 2.5 years in, our AI business is on track to surpass $10 billion of annual revenue run rate in Q2. This will be the fastest business in our history to reach this milestone.”
“Azure OpenAI usage more than doubled over the past 6 months”
“GitHub Copilot enterprise customers increased 55% quarter-over-quarter”
Google on AI
“Gemini API calls have grown nearly 14x in a 6-month period.”
“Today, more than 1/4 of all new code at Google is generated by AI, then reviewed and accepted by engineers. This helps our engineers do more and move faster.”
“since we first began testing AI overviews, we have lowered machine cost per query significantly. In 18 months, we reduced cost by more than 90% for these queries through hardware, engineering and technical breakthroughs while doubling the size of our custom Gemini model.”
“So overall, for AI overviews [AI summary responses, or SGEs], we see monetization at approximately the same rate [as non AI responses / overviews], which gives us a really strong base on which we can innovate even more.”
Meta on AI
“Meta AI now has more than 500 million monthly actives.”
“Improvements to our AI-driven feed and video recommendations have led to an 8% increase in time spent on Facebook and a 6% increase on Instagram this year alone.”
“We’re training the Llama 4 models on a cluster that is bigger than 100,000 H100s, or bigger than anything that I’ve seen reported for what others are doing.”
“More than 1 million advertisers used our Gen AI tools to create more than 15 million ads in the last month. And we estimate that businesses using image generation are seeing a 7% increase in conversions.”
“Llama token usage has grown exponentially this year, and the more widely that Llama gets adopted and becomes the industry standard, the more that the improvements to its quality and efficiency will flow back to all of our products.”
“It seems pretty clear to me that open source will be the most cost-effective, customizable, trustworthy, performant and easiest to use option that is available to developers. And I am proud that Llama is leading the way on this.”
AWS on AI
“AWS's AI business is a multibillion-dollar revenue run rate business that continues to grow at a triple-digit year-over-year percentage and is growing more than 3x faster at this stage of its evolution as AWS itself grew."
CapEx Commentary
There are a couple companies that drive a significant amount of CapEx (ie lots of AI Infra) spend that reported earnings this week: Google, Microsoft, Amazon and Meta. I pulled some of the data / commentary on CapEx here. As you can see, they all expect to increase CapEx next year, with some expecting “significant growth in CapEx.”
Google CapEx
Q3 CapEx: $13.1B vs expectations of $12.7B. Quote: “In the third quarter alone, we made announcements of over $7 billion in planned data center investments with nearly $6 billion of that in the U.S.” Another quote on the quarter’s CapEx: “60% of that investments in technical infrastructure went towards servers and about 40% towards data center and networking equipment.”
Q4 CapEx commentary: “we expect quarterly CapEx in the fourth quarter to be at similar levels to Q3”
2025 CapEx commentary: “And as we think into 2025, we do see an increase coming in 2025, and we will provide more color on that on the Q4 call, likely not the same percent step-up that we saw between '23 and '24, but additional increase”
Meta CapEx
Q3 CapEx: $9.2B vs expectations of ~$11B (some of this is Q3 CapEx hitting in Q4
Q4 CapEx commentary: They said they expect full year CapEx to be $38B - $40B (Last quarter they guided to $37B - $40B, so increased the low end by $1B). This implies a Q4 CapEx guide of $15B at the midpoint. This is significant, as their quarterly CapEx from Q1 to Q3 this year has been $6.7B, $8.5B and $9.2B. So they are expecting a real step up in CapEx in Q4. Some of that is expense timing (spend in Q3 was delivered end of quarter and expense not recognized until Q4). So more accurate way to look at trend in CapEx is to compare H1 of year to H2. This is $15.2B in H1 and $24B in H2.
2025 CapEx Commentary: “We continue to expect significant capital expenditure growth in 2025”
Microsoft CapEx
Q3 CapEx (excluding financial leases): $15B vs expectations of ~$16B
Q4 Capex Commentary: “We expect capital expenditures to increase on a sequential basis, given our cloud and AI demand signals. As I said last quarter, we will stay aligned and, if needed, adjust to the demand signals we see. As a reminder, there can be quarterly spend variability from cloud infrastructure build-outs and the timing of delivery of finance leases.”
No commentary on 2025
AWS CapEx
Q3 CapEx: $22.6B vs expectations of ~$17B. CapEx was $17.6B in Q2 and $14.9B in Q1)
Q4 Cap Ex Commentary: guided to ~$20B of CapEx in Q4. They guided to $75B in CapEx for the full year, which implies the ~$20B figure in Q4
2025 CapEx Commentary: “we expect to spend about $75 billion in 2024. I suspect we'll spend more on that in 2025. And the majority of it is for AWS and specifically, the increased bumps here are really driven by generative AI…And so the thing to remember about the AWS business is the cash life cycle is such that the faster we grow demand, the faster we have to invest capital in data centers and networking gear and hardware. And of course, in the hardware of AI, the accelerators or the chips are more expensive than the CPU hardware. And so we invest in all of that upfront in advance of when we can monetize it with customers using the resources.”
Quarterly Reports Summary
Top 10 EV / NTM Revenue Multiples
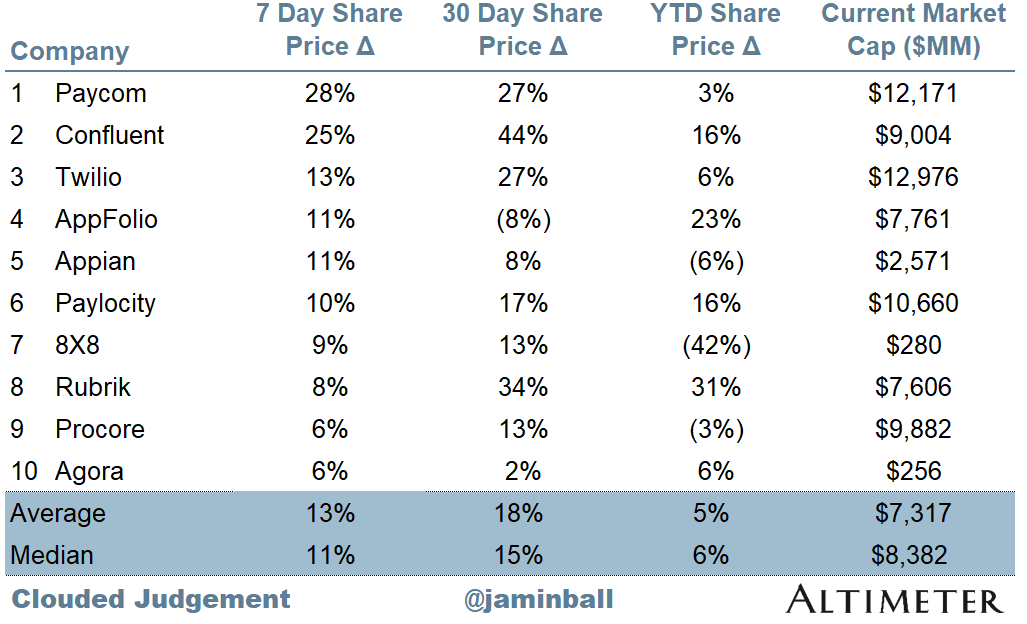
Top 10 Weekly Share Price Movement
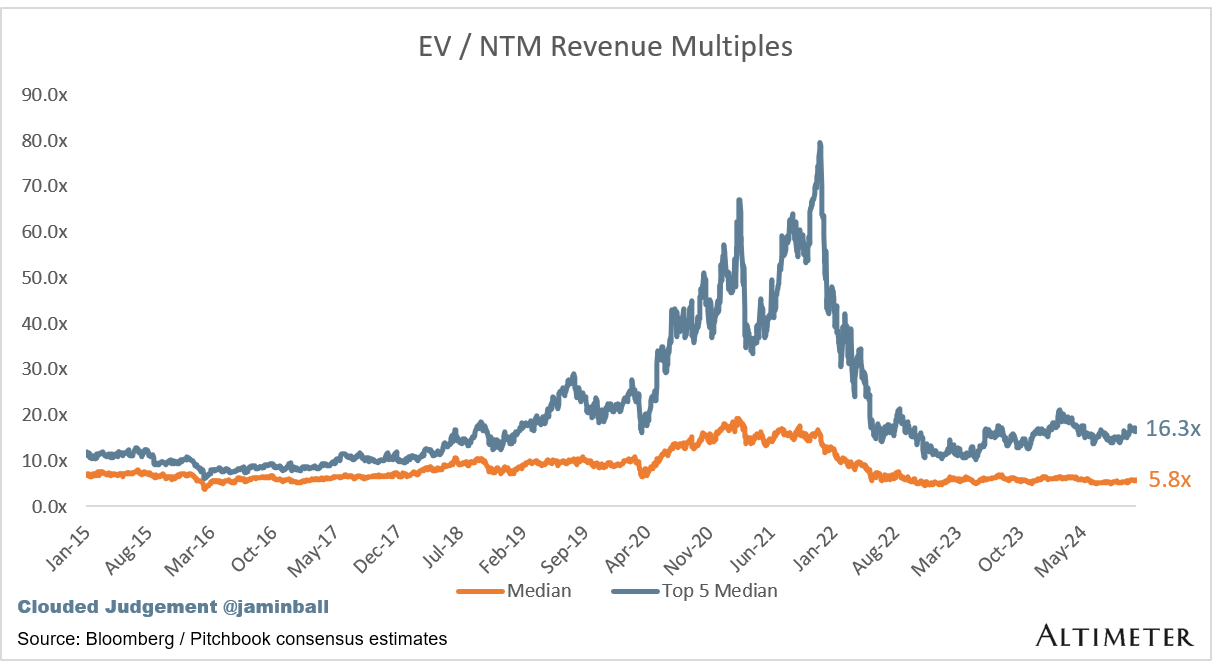
Update on Multiples
SaaS businesses are generally valued on a multiple of their revenue - in most cases the projected revenue for the next 12 months. Revenue multiples are a shorthand valuation framework. Given most software companies are not profitable, or not generating meaningful FCF, it’s the only metric to compare the entire industry against. Even a DCF is riddled with long term assumptions. The promise of SaaS is that growth in the early years leads to profits in the mature years. Multiples shown below are calculated by taking the Enterprise Value (market cap + debt - cash) / NTM revenue.
Overall Stats:
Overall Median: 5.8x
Top 5 Median: 16.3x
10Y: 4.3%
Bucketed by Growth. In the buckets below I consider high growth >27% projected NTM growth (I had to update this, as there’s only 1 company projected to grow >30% after this quarter’s earnings), mid growth 15%-27% and low growth <15%
High Growth Median: 10.6x
Mid Growth Median: 9.2x
Low Growth Median: 4.2x
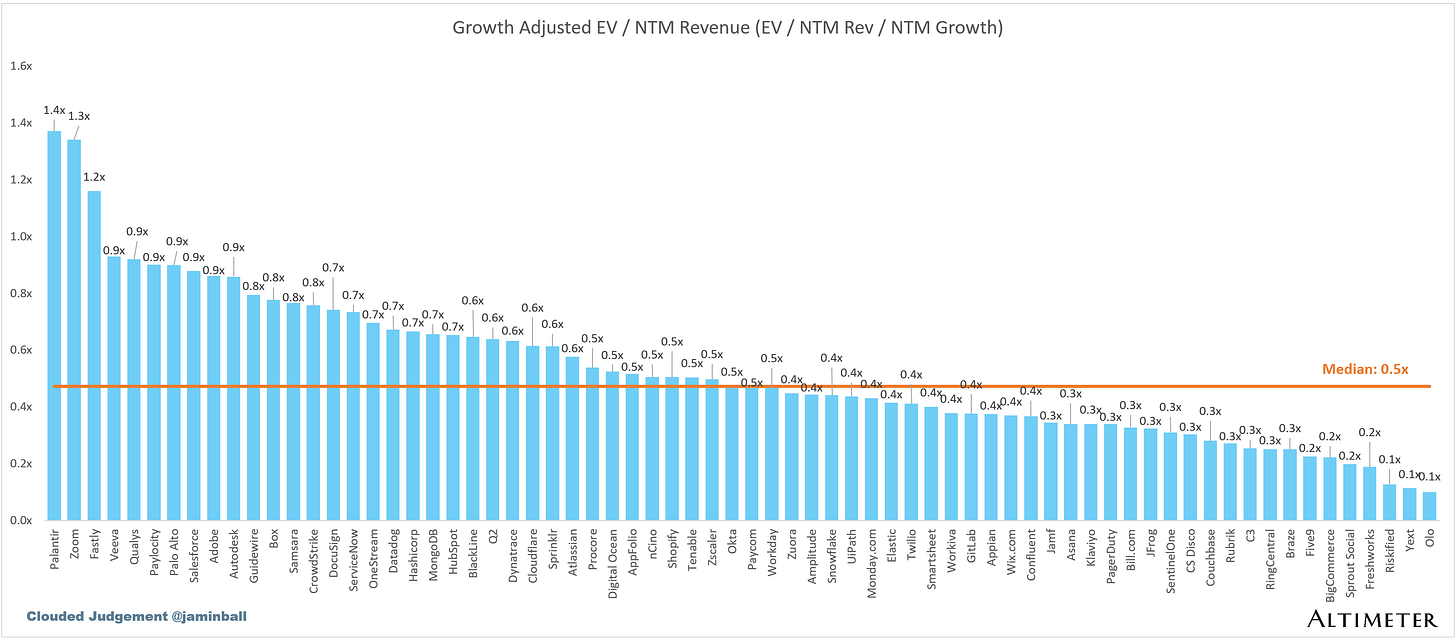
EV / NTM Rev / NTM Growth
The below chart shows the EV / NTM revenue multiple divided by NTM consensus growth expectations. So a company trading at 20x NTM revenue that is projected to grow 100% would be trading at 0.2x. The goal of this graph is to show how relatively cheap / expensive each stock is relative to their growth expectations
EV / NTM FCF
The line chart shows the median of all companies with a FCF multiple >0x and <100x. I created this subset to show companies where FCF is a relevant valuation metric.
Companies with negative NTM FCF are not listed on the chart
Scatter Plot of EV / NTM Rev Multiple vs NTM Rev Growth
How correlated is growth to valuation multiple?
Operating Metrics
Median NTM growth rate: 12%
Median LTM growth rate: 16%
Median Gross Margin: 75%
Median Operating Margin (9%)
Median FCF Margin: 15%
Median Net Retention: 110%
Median CAC Payback: 40 months
Median S&M % Revenue: 41%
Median R&D % Revenue: 25%
Median G&A % Revenue: 17%
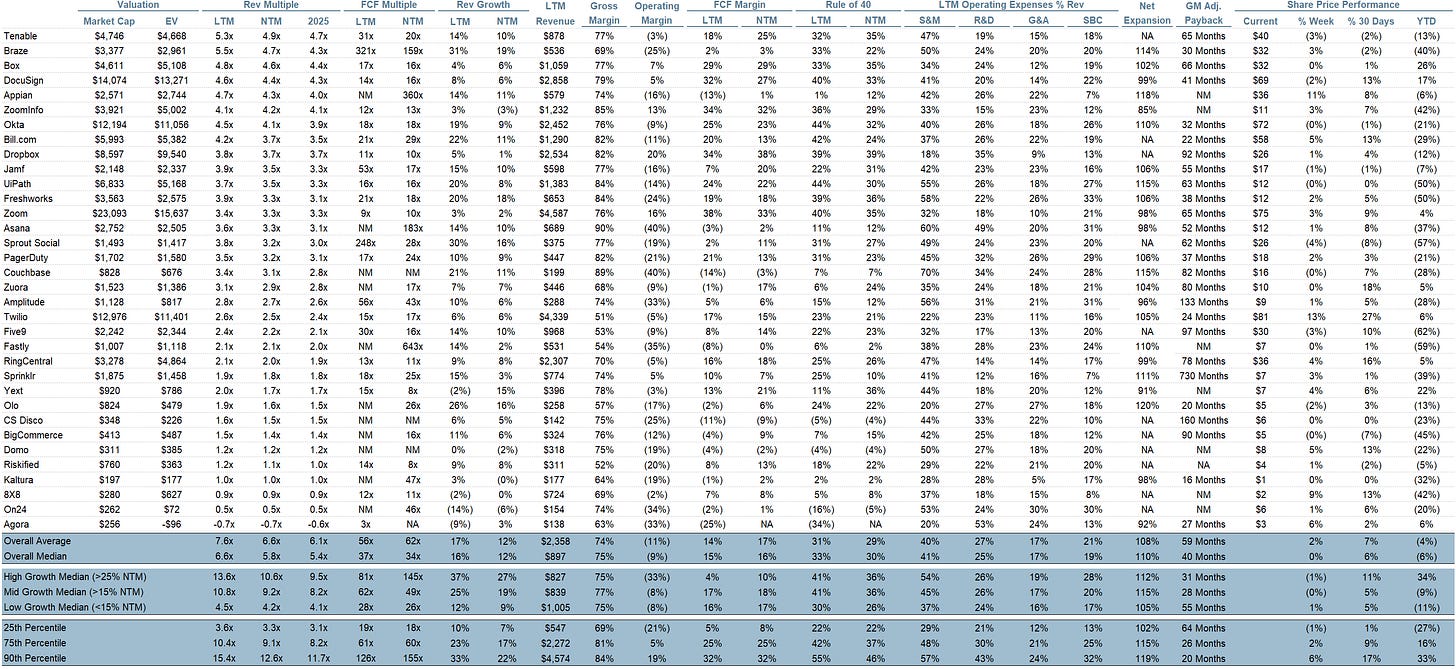
Comps Output
Rule of 40 shows rev growth + FCF margin (both LTM and NTM for growth + margins). FCF calculated as Cash Flow from Operations - Capital Expenditures
GM Adjusted Payback is calculated as: (Previous Q S&M) / (Net New ARR in Q x Gross Margin) x 12 . It shows the number of months it takes for a SaaS business to payback their fully burdened CAC on a gross profit basis. Most public companies don’t report net new ARR, so I’m taking an implied ARR metric (quarterly subscription revenue x 4). Net new ARR is simply the ARR of the current quarter, minus the ARR of the previous quarter. Companies that do not disclose subscription rev have been left out of the analysis and are listed as NA.
Sources used in this post include Bloomberg, Pitchbook and company filings
The information presented in this newsletter is the opinion of the author and does not necessarily reflect the view of any other person or entity, including Altimeter Capital Management, LP ("Altimeter"). The information provided is believed to be from reliable sources but no liability is accepted for any inaccuracies. This is for information purposes and should not be construed as an investment recommendation. Past performance is no guarantee of future performance. Altimeter is an investment adviser registered with the U.S. Securities and Exchange Commission. Registration does not imply a certain level of skill or training.
This post and the information presented are intended for informational purposes only. The views expressed herein are the author’s alone and do not constitute an offer to sell, or a recommendation to purchase, or a solicitation of an offer to buy, any security, nor a recommendation for any investment product or service. While certain information contained herein has been obtained from sources believed to be reliable, neither the author nor any of his employers or their affiliates have independently verified this information, and its accuracy and completeness cannot be guaranteed. Accordingly, no representation or warranty, express or implied, is made as to, and no reliance should be placed on, the fairness, accuracy, timeliness or completeness of this information. The author and all employers and their affiliated persons assume no liability for this information and no obligation to update the information or analysis contained herein in the future.


The large-caps comments on AI are wild. 10x for sharing.