Clouded Judgement 11.3.23 - No Sign of Re-Acceleration in Software
Every week I’ll provide updates on the latest trends in cloud software companies. Follow along to stay up to date!
Earnings Season Kicks Off Without Any Sign of Re-Acceleration
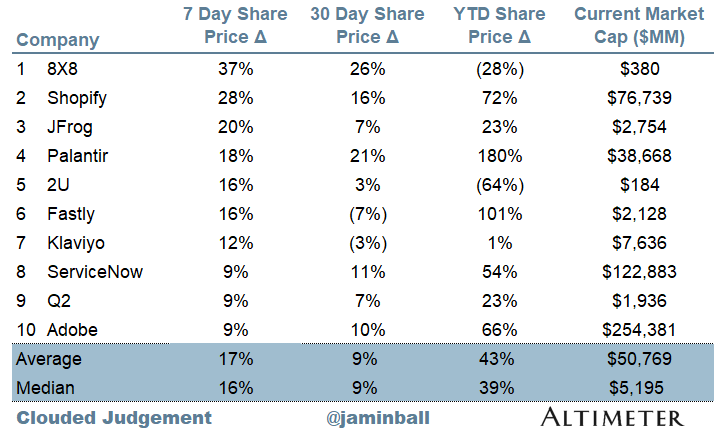
Q3 earnings season kicked off in earnest this week, and it’s turning out to quite the volatile earnings season. Already we’ve seen huge earnings move. ZoomInfo dropped ~20%. Paycom dropped ~40%. Bill.com dropped ~30%. Confluent dropped ~40%. Atlassian was down ~10%. Procore was down ~15%. Some of these drops rival one of the worst ever software earnings reaction of Tableau in 2016! But it wasn’t all bad. JFrog was up ~20%. Palantir was up ~20%. Fastly was up ~15%. Shopify was up ~20%. On Thursday the software index (WCLD) was up ~3%! That’s a huge move up for the index! So what’s going on??
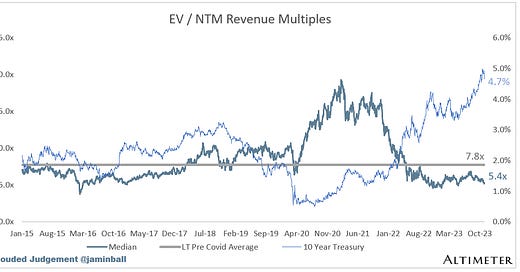
In weeks past I’ve written about how on a growth adjusted basis software stocks are actually relatively expensive today. Pure revenue multiples are trading at a 31% discount to their long term average (5.4x today, long-term average of 7.8x), but on a growth adjusted basis, multiples are trading at a 26% PREMIUM to their long term average (0.35x today, long term average of 0.28x). This growth adjusted premium also comes at a time when the 10Y is nearly double what it was from 2010 to 2020. So what’s holding up software stocks valuations?? It had to either be an expectation that the 10Y would fall back to where it was in 2010-2020 (~2.5%, which would be a HUGE drop in rates), or that growth would reaccelerate and current growth-adjusted multiples were artificially low (given actually growth expectations were higher than consensus). Or it was a combo of both! What feels most likely, is that valuations were propped up despite how high the 10Y was because the market expected software to re-accelerate in Q3 / Q4 (so it was more due to growth expectations being higher than consensus). After all, the real headwinds to software started in the Q3 / Q4 2022 timeline, so by Q3 / Q4 2023 we’d start lapping those tough periods. Said another way, I believe that software valuations were holding up so well in the face of a ~5% 10Y because the market expected acceleration and 2024 numbers to come up. And now, it’s unclear when that re-acceleration will happen.
However - what we’ve seen so far in general from software earnings is that companies are definitely NOT saying they will see any re-acceleration in Q4. It’s actually the complete opposite - there will be more deceleration in Q4 (according to guides). All the headwinds that have persisted continue to persist. Maybe with the exception of hyperscalers (particularly Azure). Q4 guides have painted a pretty stark picture. So far, only 28% of companies have guided Q4 above consensus (blue bar below)! And the median guide is 0.4% BELOW consensus (grey line below). Historically we see ~75% of companies guide above consensus. This is the most companies have missed guidance since the onset of Covid. Pretty significant! Said another - that re-acceleration the market was expecting is NOT showing up at all. So the one factor holding up valuations of some software companies is starting to disappear, and valuations are sent falling. What’s worse - it’s not clear when the re-acceleration will occur. So many are fine saying “let’s just wait until we see the re-acceleration, it’s just too hard to predict.”
There’s also another factor in play. Let’s look at Confluent. They dropped nearly 40%! This is very reminiscent of the Tableau drop in 2016. They actually beat Q3 by 3%! Not bad. But they guided Q4 at 4% below consensus (would imply 21% YoY growth in Q4, meaningfully down from 32% YoY growth in Q3). And for 2024 they provided an initial “guide” of 22% when the market was expecting closer to 28%. Put aside some of the idiosyncratic factors in play for Confluent. Namely, two large customers caused a huge issue (New Relic account growing very slowly post their acquisition, and a gaming company going back on prem - which I’m guessing means going to self managed Kafka?). The broader story here is more important. You have a company who is now saying they’ll grow ~20% in 2024 who had negative FCF in this most recent quarter, and was FCF negative in the 12 months before that as well. 20% growth is not what you expect from a growth story / growth stock (of course, we can say the guide is conservative from a new CFO and they should comfortably beat, but let’s take them at their word for ~20% in 2024). So if you’re not valued like a growth stock you get valued more like a value stock - and the valuation metrics there look more like FCF or PE multiples. The real issue - if you fall out of the “growth stock” bucket, and into the “mature grower” (or value stock, not sure what to call this bucket, but it where companies go to after they stop growing quickly and hit the maturity stage of their lifecycle), but you don’t have the underlying metrics of these mature companies s(namely FCF or earnings), there’s really no floor to your valuation. This is the conundrum for Confluent (or companies like this who aren’t seeing reacceleration, are seeing growth decelerate rapidly, and don’t have FCF support). If you can’t generate FCF or earnings when growth really slows, investors start to wonder if you ever will? And when folks start having to ask this question, you get a huge portion of the market who says “let’s just get out of this thing.” I don’t mean to pick on Confluent - I do think it’s a quality business with lots of interesting industry tailwinds behind it. I’m just using them because they had a massive drop, and the concept of exiting growth mode without FCF support is not uncommon in the software industry today.
4x NTM revenue for Confluent sounds super cheap. But it’s also trading at 230x NTM FCF for a company that is guiding topline growth to 22%. The revenue multiple makes it sound cheap, but the FCF multiple makes it look expensive still (ie there’s really no floor for companies without high growth or FCF support). Just look at how Twilio has been trading the last year…
What we know - Software companies are still expensive on a growth-adjusted basis, and as growth continues to disappoint we may see some massive downward corrections for the higher multiple stocks (especially those without FCF). Speaking of - when looking at companies that have FCF, those multiples are cheaper than their historical average. When looking at companies who have positive FCF, and that trade <100x NTM FCF (ie for those who the FCF metric is a relevant trading metric), the current median is 33x, which is ~20% below the longer term average of ~40x. Given how high the 10Y is, multiples should be lower. But this median is close to as low as it’s gotten since 2015. You can see the FCF median charts later on in this post.
If I had to summarize my views on software valuations at the moment it would be this: Software companies overall are highly valued / expensive given where growth and interest rates are. Acceleration in 2024 was baked in, and now it’s unclear when we’ll see it (elephant in the room is a recession in 2024 which would really push estimates down). Companies without FCF are particularly “expensive” (again relative to rates and growth), and companies who are generating real FCF are closer to fairly valued (relative to rates and growth, but still on the slightly expensive side). We can revisit this statement when macro pressures ease or rates change. But for now, these are my views
Quarterly Reports Summary
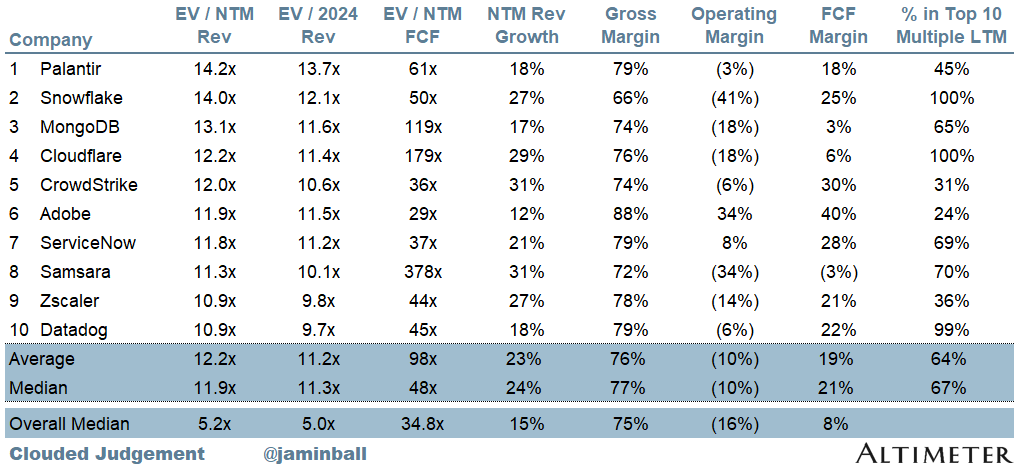
Top 10 EV / NTM Revenue Multiples
Top 10 Weekly Share Price Movement
Update on Multiples
SaaS businesses are generally valued on a multiple of their revenue - in most cases the projected revenue for the next 12 months. Revenue multiples are a shorthand valuation framework. Given most software companies are not profitable, or not generating meaningful FCF, it’s the only metric to compare the entire industry against. Even a DCF is riddled with long term assumptions. The promise of SaaS is that growth in the early years leads to profits in the mature years. Multiples shown below are calculated by taking the Enterprise Value (market cap + debt - cash) / NTM revenue.
Overall Stats:
Overall Median: 5.4x
Top 5 Median: 13.1x
10Y: 4.7%
Bucketed by Growth. In the buckets below I consider high growth >30% projected NTM growth, mid growth 15%-30% and low growth <15%
High Growth Median: 10.4x
Mid Growth Median: 6.8x
Low Growth Median: 3.6x
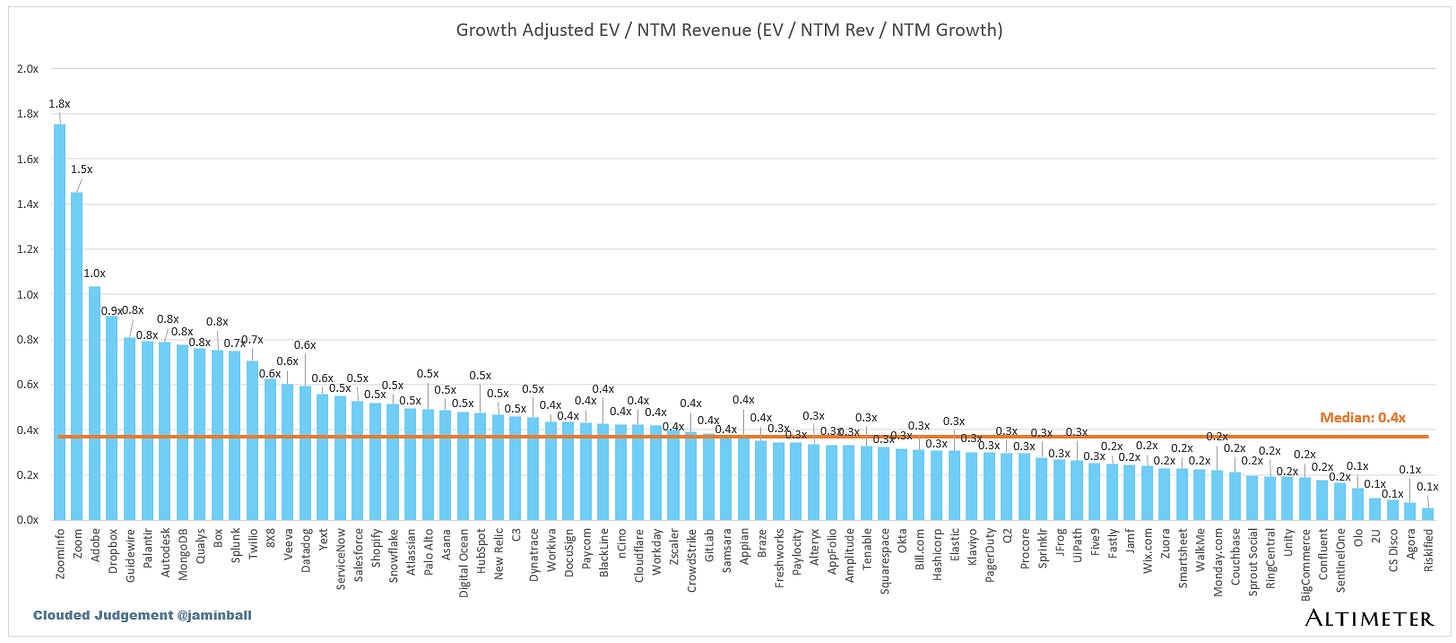
EV / NTM Rev / NTM Growth
The below chart shows the EV / NTM revenue multiple divided by NTM consensus growth expectations. So a company trading at 20x NTM revenue that is projected to grow 100% would be trading at 0.2x. The goal of this graph is to show how relatively cheap / expensive each stock is relative to their growth expectations
EV / NTM FCF
The line chart shows the median of all companies with a FCF multiple >0x and <100x. I created this subset to show companies where FCF is a relevant valuation metric.
Companies with negative NTM FCF are not listed on the chart
Scatter Plot of EV / NTM Rev Multiple vs NTM Rev Growth
How correlated is growth to valuation multiple?
Operating Metrics
Median NTM growth rate: 15%
Median LTM growth rate: 21%
Median Gross Margin: 75%
Median Operating Margin (16%)
Median FCF Margin: 8%
Median Net Retention: 114%
Median CAC Payback: 35 months
Median S&M % Revenue: 42%
Median R&D % Revenue: 26%
Median G&A % Revenue: 16%
Comps Output
Rule of 40 shows rev growth + FCF margin (both LTM and NTM for growth + margins). FCF calculated as Cash Flow from Operations - Capital Expenditures
GM Adjusted Payback is calculated as: (Previous Q S&M) / (Net New ARR in Q x Gross Margin) x 12 . It shows the number of months it takes for a SaaS business to payback their fully burdened CAC on a gross profit basis. Most public companies don’t report net new ARR, so I’m taking an implied ARR metric (quarterly subscription revenue x 4). Net new ARR is simply the ARR of the current quarter, minus the ARR of the previous quarter. Companies that do not disclose subscription rev have been left out of the analysis and are listed as NA.
Sources used in this post include Bloomberg, Pitchbook and company filings
The information presented in this newsletter is the opinion of the author and does not necessarily reflect the view of any other person or entity, including Altimeter Capital Management, LP ("Altimeter"). The information provided is believed to be from reliable sources but no liability is accepted for any inaccuracies. This is for information purposes and should not be construed as an investment recommendation. Past performance is no guarantee of future performance. Altimeter is an investment adviser registered with the U.S. Securities and Exchange Commission. Registration does not imply a certain level of skill or training.
This post and the information presented are intended for informational purposes only. The views expressed herein are the author’s alone and do not constitute an offer to sell, or a recommendation to purchase, or a solicitation of an offer to buy, any security, nor a recommendation for any investment product or service. While certain information contained herein has been obtained from sources believed to be reliable, neither the author nor any of his employers or their affiliates have independently verified this information, and its accuracy and completeness cannot be guaranteed. Accordingly, no representation or warranty, express or implied, is made as to, and no reliance should be placed on, the fairness, accuracy, timeliness or completeness of this information. The author and all employers and their affiliated persons assume no liability for this information and no obligation to update the information or analysis contained herein in the future.


