Every week I’ll provide updates on the latest trends in cloud software companies. Follow along to stay up to date!
Fed Update
This week the Fed cut rates by 25 bps. The target rate now sits at 4.5% - 4.75%. Powell also gave some remarks which I summarized below:
Economic Outlook: The economy remains strong, with solid GDP growth at 2.8% in Q3, resilient consumer spending, and strengthening investment. However, the housing sector continues to lag.
Labor Market: Employment conditions have cooled but remain stable. Job growth averaged 104,000 per month over the last three months, slightly lower due to labor strikes and hurricanes. The unemployment rate is 4.1%, down slightly from recent months. Wage growth has slowed, indicating less inflationary pressure from the labor market.
Inflation: Inflation has significantly decreased from a peak of 7% to 2.1% as of September, nearing the Fed's 2% goal. Core inflation remains slightly elevated at 2.7%, but long-term inflation expectations are stable. The 2.1% figure referenced by Chair Powell in his statement is the Personal Consumption Expenditures (PCE) price index over the 12 months ending in September. The PCE is the Fed’s preferred measure for tracking inflation, as it reflects changes in consumer spending behavior and typically shows a slightly lower rate than the Consumer Price Index (CPI).
Policy Adjustment: The Federal Open Market Committee (FOMC) decided to reduce the federal funds rate by 0.25%, aiming to support economic and labor market strength while working toward stable inflation.
Future Policy Stance: The Fed will continue to monitor economic conditions, adjusting policies as necessary. They emphasize a flexible approach, ready to either reduce policy restraint further or slow down adjustments based on economic and inflation developments.
Dual Mandate Commitment: The Fed remains committed to achieving maximum employment and stable prices, understanding the broad impact of their policies on the American people.
Q3 Earnings Update
Most of the software companies with September quarter ends have now reported earnings, so I wanted to take a look at the data to see if any trends are emerging for Q3. Is the environment getting better? Worse? No change? Some data below.
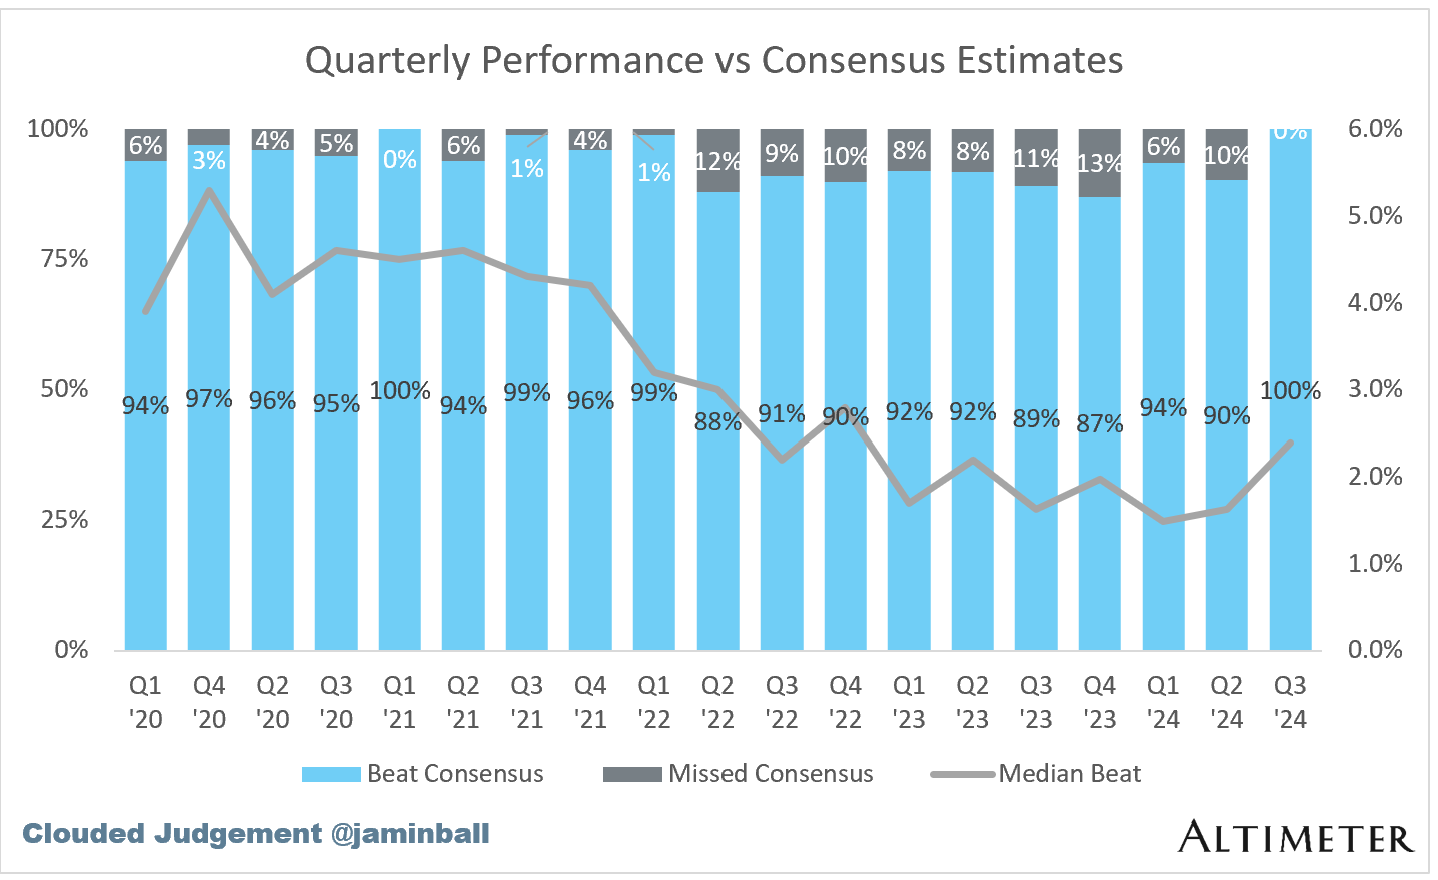
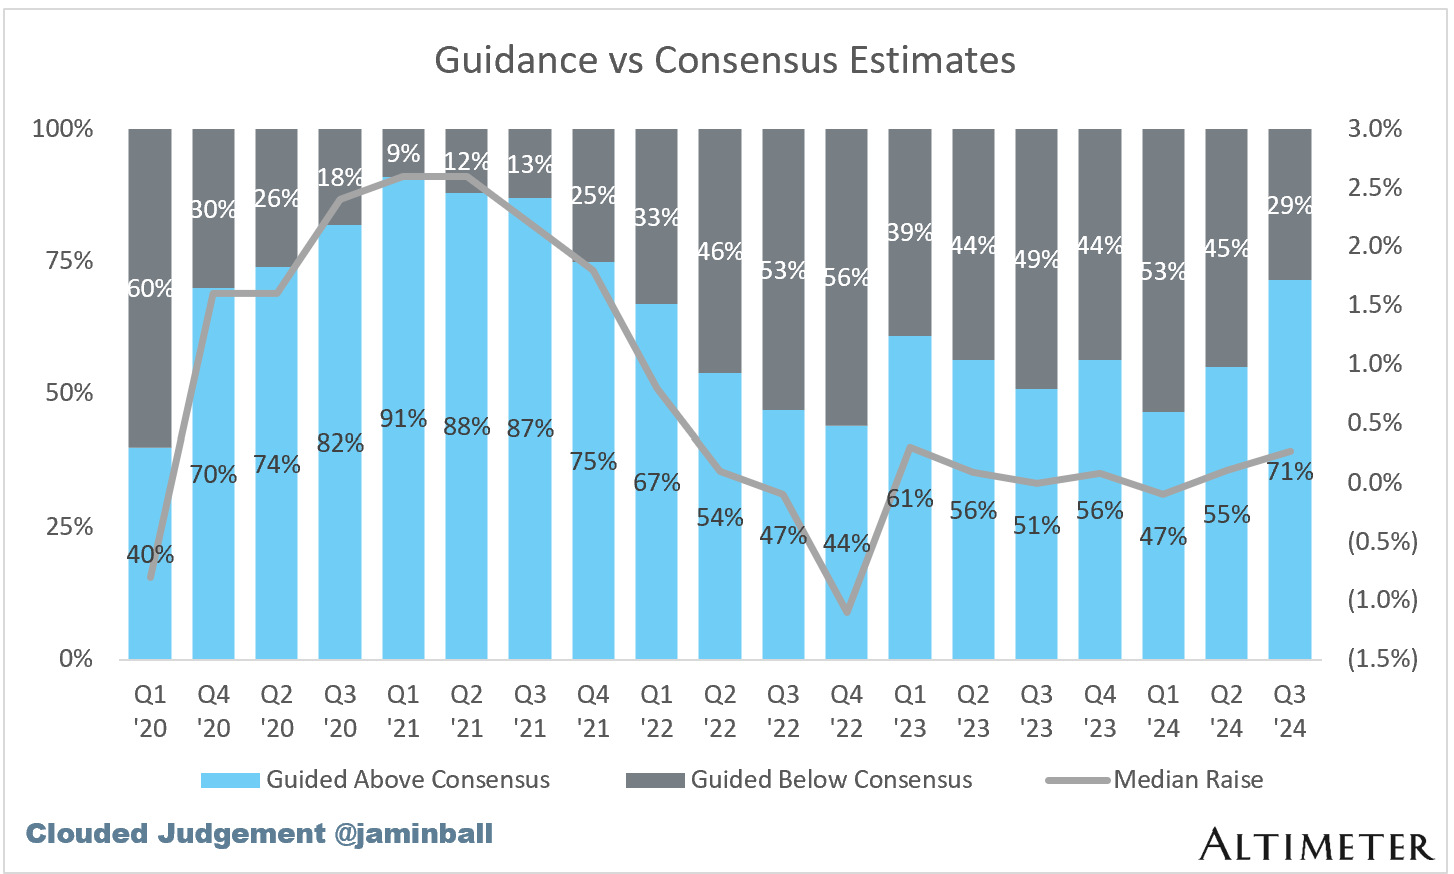
As most of the readers will know, every quarter I do a quarterly earnings recap of ~60 software companies. Looking at the subset that have reported so far (29 companies), 100% of them have bet Q3 consensus estimates, with a median beat of 2.4%. For the last ~2 years that figure has hovered around 90% with a 1.5-2% median beat. So a nice uptick this quarter. Both figures represent the best quarter since the end of 2022. Looking at guidance for Q4, 71% of companies beat guidance with a median beat of 0.3%. Over the last 2 years those figures have hovered around 50% beating with median beat of 0.0%. The guidance outlook (both number of companies beating and median beat) are the best since Q1 ‘22. Again, a positive trend! You can see graphs for this data below:
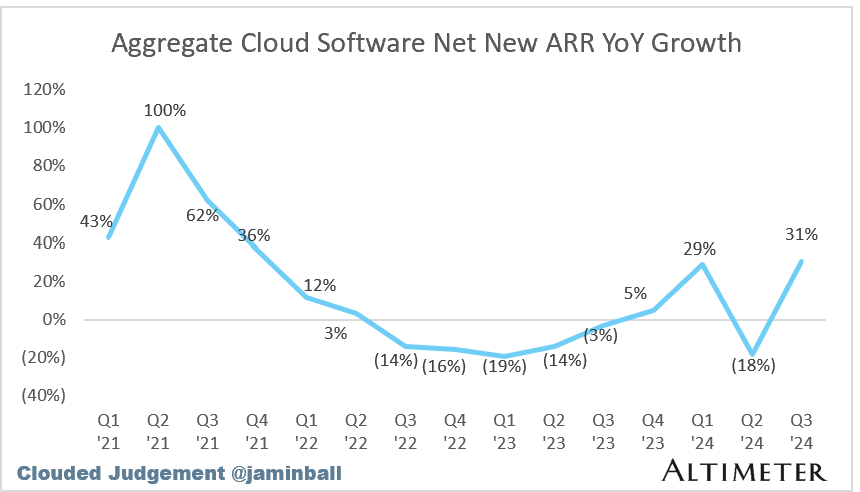
Looking at net new ARR added in the quarter, this also paints a positive picture for software. This quarter, the cohort of companies who’ve reported earnings so far posted their second largest net new ARR added going back to the start of 2020 (graph below). The YoY growth in quarterly net new ARR added also looks quite positive. There’s a chance the net new ARR added looks good given Q2 was a down quarter (so the QoQ comparison is “easy”). Let’s see if this trend continues into Q4.
Quarterly Reports Summary
Top 10 EV / NTM Revenue Multiples
Top 10 Weekly Share Price Movement
Update on Multiples
SaaS businesses are generally valued on a multiple of their revenue - in most cases the projected revenue for the next 12 months. Revenue multiples are a shorthand valuation framework. Given most software companies are not profitable, or not generating meaningful FCF, it’s the only metric to compare the entire industry against. Even a DCF is riddled with long term assumptions. The promise of SaaS is that growth in the early years leads to profits in the mature years. Multiples shown below are calculated by taking the Enterprise Value (market cap + debt - cash) / NTM revenue.
Overall Stats:
Overall Median: 6.0x
Top 5 Median: 18.2x
10Y: 4.3%
Bucketed by Growth. In the buckets below I consider high growth >27% projected NTM growth (I had to update this, as there’s only 1 company projected to grow >30% after this quarter’s earnings), mid growth 15%-27% and low growth <15%
High Growth Median: 12.3x
Mid Growth Median: 9.5x
Low Growth Median: 4.7x
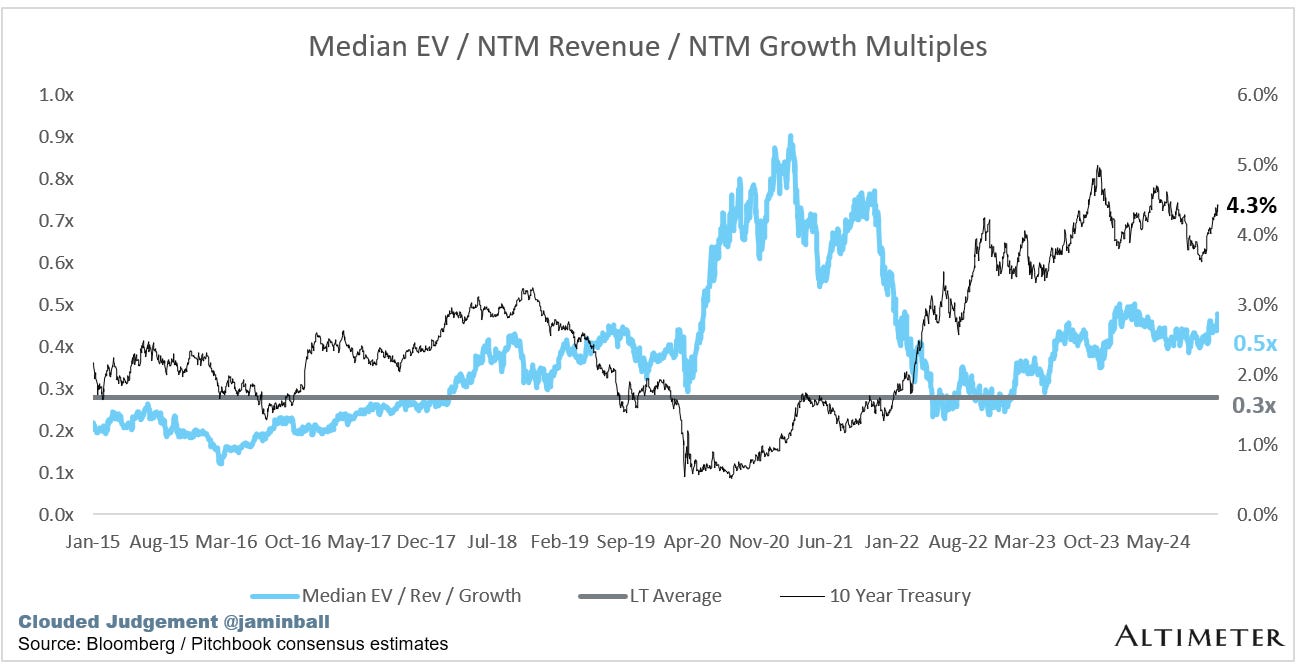
EV / NTM Rev / NTM Growth
The below chart shows the EV / NTM revenue multiple divided by NTM consensus growth expectations. So a company trading at 20x NTM revenue that is projected to grow 100% would be trading at 0.2x. The goal of this graph is to show how relatively cheap / expensive each stock is relative to their growth expectations
EV / NTM FCF
The line chart shows the median of all companies with a FCF multiple >0x and <100x. I created this subset to show companies where FCF is a relevant valuation metric.
Companies with negative NTM FCF are not listed on the chart
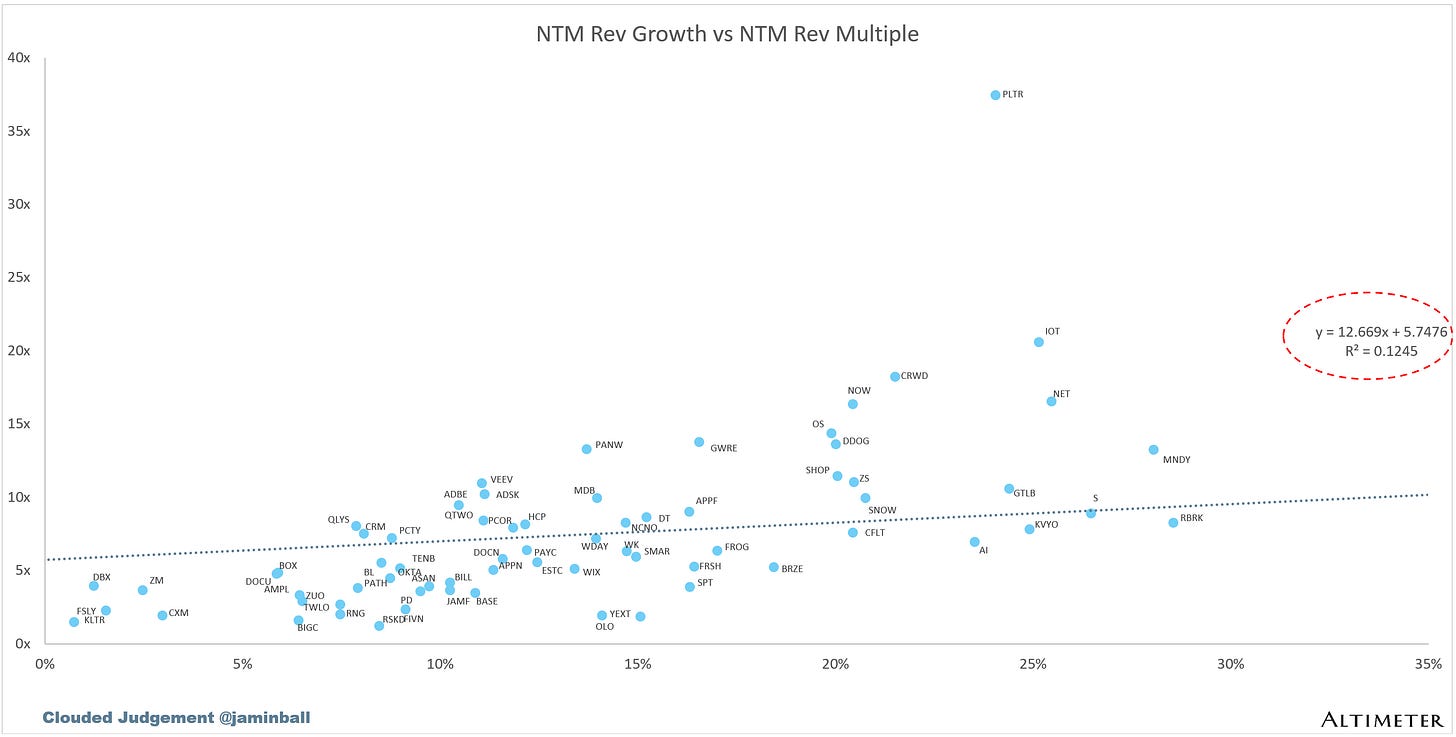
Scatter Plot of EV / NTM Rev Multiple vs NTM Rev Growth
How correlated is growth to valuation multiple?
Operating Metrics
Median NTM growth rate: 11%
Median LTM growth rate: 15%
Median Gross Margin: 76%
Median Operating Margin (9%)
Median FCF Margin: 15%
Median Net Retention: 110%
Median CAC Payback: 39 months
Median S&M % Revenue: 40%
Median R&D % Revenue: 24%
Median G&A % Revenue: 17%
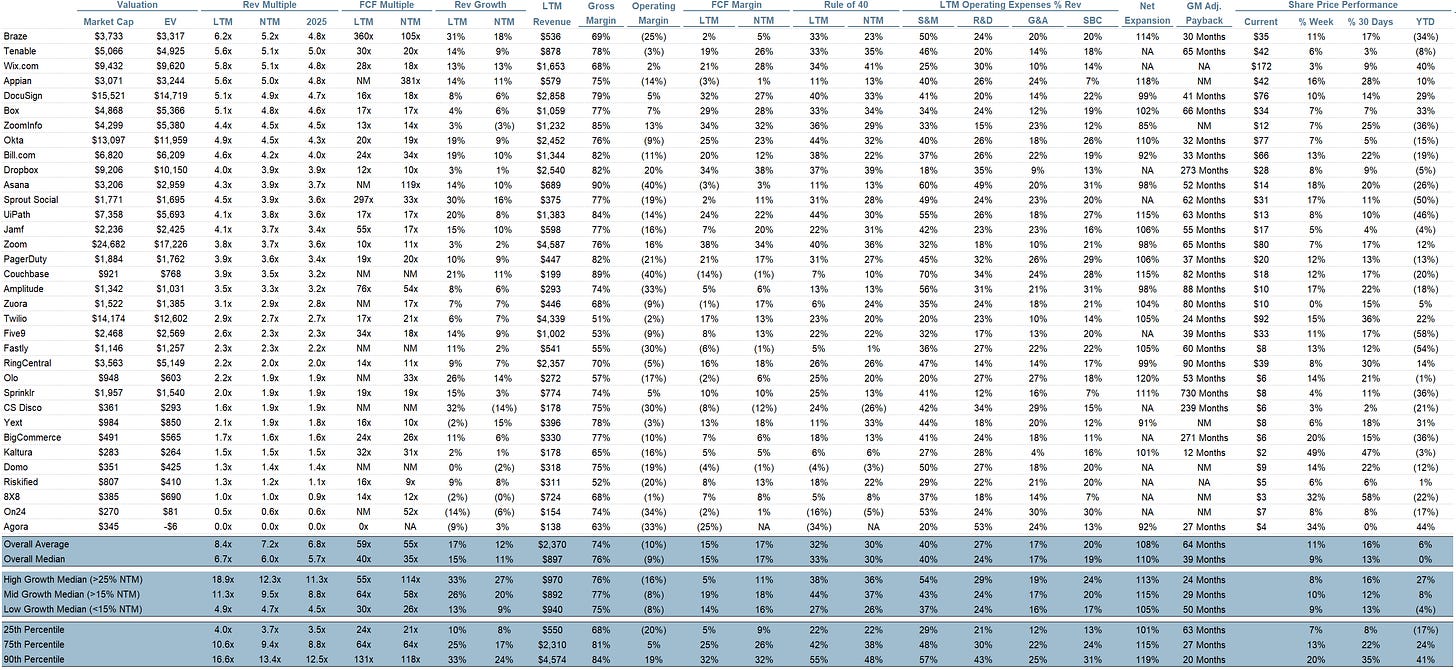
Comps Output
Rule of 40 shows rev growth + FCF margin (both LTM and NTM for growth + margins). FCF calculated as Cash Flow from Operations - Capital Expenditures
GM Adjusted Payback is calculated as: (Previous Q S&M) / (Net New ARR in Q x Gross Margin) x 12 . It shows the number of months it takes for a SaaS business to payback their fully burdened CAC on a gross profit basis. Most public companies don’t report net new ARR, so I’m taking an implied ARR metric (quarterly subscription revenue x 4). Net new ARR is simply the ARR of the current quarter, minus the ARR of the previous quarter. Companies that do not disclose subscription rev have been left out of the analysis and are listed as NA.
Sources used in this post include Bloomberg, Pitchbook and company filings
The information presented in this newsletter is the opinion of the author and does not necessarily reflect the view of any other person or entity, including Altimeter Capital Management, LP ("Altimeter"). The information provided is believed to be from reliable sources but no liability is accepted for any inaccuracies. This is for information purposes and should not be construed as an investment recommendation. Past performance is no guarantee of future performance. Altimeter is an investment adviser registered with the U.S. Securities and Exchange Commission. Registration does not imply a certain level of skill or training.
This post and the information presented are intended for informational purposes only. The views expressed herein are the author’s alone and do not constitute an offer to sell, or a recommendation to purchase, or a solicitation of an offer to buy, any security, nor a recommendation for any investment product or service. While certain information contained herein has been obtained from sources believed to be reliable, neither the author nor any of his employers or their affiliates have independently verified this information, and its accuracy and completeness cannot be guaranteed. Accordingly, no representation or warranty, express or implied, is made as to, and no reliance should be placed on, the fairness, accuracy, timeliness or completeness of this information. The author and all employers and their affiliated persons assume no liability for this information and no obligation to update the information or analysis contained herein in the future.








Nice Q3 update, Jamin. Thanks.
Looking at the Quarterly Reports Summary table, it struck me that no company so far has beat and raised consensus by a remarkable 5%+ level...anything lower than 5% is par for the course...analysts and mgmt teams playing the numbers game with each other.
Looking at the Top 10 EV/NTM table, it is clear that PLTR is highly overvalued and not aligned with its forward business prospects. Is it now a meme stock that is divorced from the underlying business like MSTR?
Why such a big change in Scatter Plot of EV / NTM Rev Multiple vs NTM Rev Growth?