
Clouded Judgement 1.21.22

Every week I’ll provide updates on the latest trends in cloud software companies. Follow along to stay up to date!
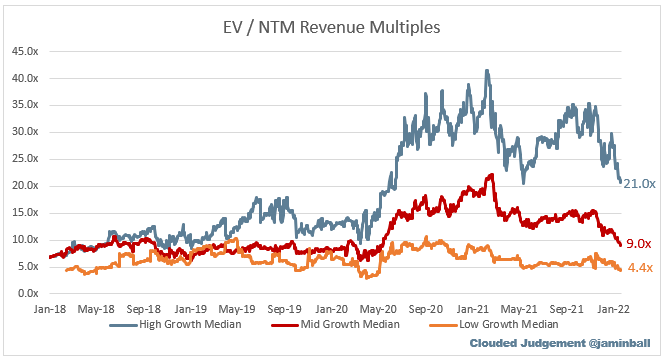
Update on Multiples
When looking at median multiples we’re now below where we were pre-covid. The overall median multiple is 7% below pre-covid highs, 13% above where we were on Jan 1, 2020, and 8% below the previous peak in August 2019.
However, high growth software multiples are still elevated. Looking at high growth software median only - we are still 49% above pre-covid highs, 76% above where we were on Jan 1, 2020, and 17% above the previous peak in September 2019.
Quarterly Reports Summary
Next week kicks off Q4 earnings season! Given the choppiness in cloud software so far in 2022 I expect earnings season to be quite interesting. The rising tide of ZIRP lifted all cloud software stocks over the last 2 years. As we look towards 3 (or more) rate hikes in 2022 the churning of multiple compression has begun. However, there are still many software companies with elevated multiples (and at the same time many that have been crushed). I’m guessing Q4 earnings will be unforgiving - for those with elevated multiples the expectations are very high. Anything short of an outstanding quarter will be met with real punishment. I wrote a bit more about that here:

Top 10 EV / NTM Revenue Multiples

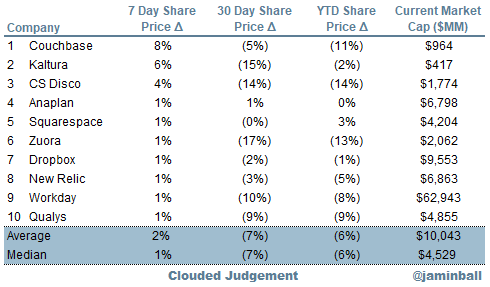
Top 10 Weekly Share Price Movement
Update on Multiples
SaaS businesses are valued on a multiple of their revenue - in most cases the projected revenue for the next 12 months. Multiples shown below are calculated by taking the Enterprise Value (market cap + debt - cash) / NTM revenue.
Overall Stats:
Overall Median: 10.2x
Top 5 Median: 32.6x
3 Month Trailing Average: 13.5x
1 Year Trailing Average: 15.3x


Bucketed by Growth. In the buckets below I consider high growth >30% projected NTM growth, mid growth 15%-30% and low growth <15%
High Growth Median: 21.0x
Mid Growth Median: 9.0x
Low Growth Median: 4.4x

Scatter Plot of EV / NTM Rev Multiple vs NTM Rev Growth
How correlated is growth to valuation multiple?

Growth Adjusted EV / NTM Rev
The below chart shows the EV / NTM revenue multiple divided by NTM consensus growth expectations. The goal of this graph is to show how relatively cheap / expensive each stock is relative to their growth expectations

Operating Metrics
Median NTM growth rate: 25%
Median LTM growth rate: 34%
Median Gross Margin: 74%
Median Operating Margin (19%)
Median FCF Margin: 3%
Median Net Retention: 119%
Median CAC Payback: 25 months
Median S&M % Revenue: 45%
Median R&D % Revenue: 26%
Median G&A % Revenue: 19%
Comps Output
Rule of 40 shows LTM growth rate + LTM FCF Margin. FCF calculated as Cash Flow from Operations - Capital Expenditures
GM Adjusted Payback is calculated as: (Previous Q S&M) / (Net New ARR in Q x Gross Margin) x 12 . It shows the number of months it takes for a SaaS business to payback their fully burdened CAC on a gross profit basis. Most public companies don’t report net new ARR, so I’m taking an implied ARR metric (quarterly subscription revenue x 4). Net new ARR is simply the ARR of the current quarter, minus the ARR of the previous quarter. Companies that do not disclose subscription rev have been left out of the analysis and are listed as NA.


This post and the information presented are intended for informational purposes only. The views expressed herein are the author’s alone and do not constitute an offer to sell, or a recommendation to purchase, or a solicitation of an offer to buy, any security, nor a recommendation for any investment product or service. While certain information contained herein has been obtained from sources believed to be reliable, neither the author nor any of his employers or their affiliates have independently verified this information, and its accuracy and completeness cannot be guaranteed. Accordingly, no representation or warranty, express or implied, is made as to, and no reliance should be placed on, the fairness, accuracy, timeliness or completeness of this information. The author and all employers and their affiliated persons assume no liability for this information and no obligation to update the information or analysis contained herein in the future.
suggestion on the dot plot chart of fwd p/s vs rev growth rate. color the dots by gross margin profile quintile. It could help distinguish why certain companies trade at a premium multiple.