Clouded Judgement 12.16.22 - Inflation + Fed Update
Every week I’ll provide updates on the latest trends in cloud software companies. Follow along to stay up to date!
Inflation + Fed Update
On Tuesday we got the inflation figures for November, and it came in light. In fact, it came in lower than 65 of 67 economists surveyed by Bloomberg. Core CPI was 6.0% vs consensus of 6.1%. Headline CPI of 7.1% vs consensus of 7.3%. This was the second month in a row of a big surprise to the downside. Is this the start of a real trend or just a couple isolated data points? That was the big question for the Fed meeting which happened on Wednesday.
In the Fed meeting, the fed funds rate was raised by 50bps to a target range of 4.25-4.5%. That was always the expectation, and the only real outcome for Wednesday (so no surprises). What people cared more about was setting expectations for rate hikes in 2023, and what the fed funds rate would peak at. Going into the meeting, the expectation was the peak fed funds rate in ‘23 would be ~4.8% (so an additional 25-50bps of hikes in ‘23). Powell made clear that he expected the peak rate to be higher than that. In fact, when you look at the dot plot below (a graphic that shows where each FOMC participant expects rates to get to), you’ll see that almost every participant expects rates to peak >5%, in the ~5.25% range. You can find the below graphic here
What does this mean? The market was expecting an additional 25-50bps of hikes in ‘23, and the FOMC participants are telling us we should expect more like 75bps. Additionally, Powell made it very clear he does not expect any rate cuts in ‘23. He’s contrasting a couple encouraging inflation prints with a very tight labor market (lower unemployment) and strong wage growth. The worry is that the labor market + wage growth will lead to “stickier” inflation. So while the trend is clearly coming down, will those two factors lead to inflation plateauing before we get to the 2% target? That’s the fear, and the reason for the strong messaging from Powell that rates will be held at the peak rate for longer. At the same time - Powell also stated that he still thinks a soft landing (light or no recession) is possible. I’m sure this gives him more comfort to keep rates higher. The huge risk, or course, is that inflation is coming down fast and holding rates higher for longer risks pushing us into a deeper recession.
Maybe the most interesting takeaway from this week for me - while both CPI on Tuesday and Powell’s comments on Wednesday may have seen “drastic,” the market really didn’t move much either day (it did move down Thursday as everything from the week was digested). This is telling me that the market has shifted it’s primary focus from inflation / rates to fundamentals in a recession. The latter is clearly the bigger risk factor as we get closer and closer to a peak fed funds rate, with the rate risk being more known / capped.
Software Fundamentals
This brings us to the biggest question now - how do software fundamentals preform in a recession, and are forward estimates too high. I’ll dive into this more in future posts, but for now a quick teaser. We are, in fact, starting to see forward estimates revised downward for cloud software companies. When we look at 2023 revenue projections pre / post earnings, you can see that for the majority of companies ‘23 estimates were lowered. The chart below shows the change in ‘23 estimates pre / post earnings. As you can see the median ‘23 estimate was revised down 2%. You can definitely argue that in a recession scenario this is just the tip of the iceberg and numbers still need to come down more.
Quarterly Reports Summary
Q3 earnings season is now complete! I’ll put together the full earnings recap post in the next week or two.
Top 10 EV / NTM Revenue Multiples
Top 10 Weekly Share Price Movement
Update on Multiples
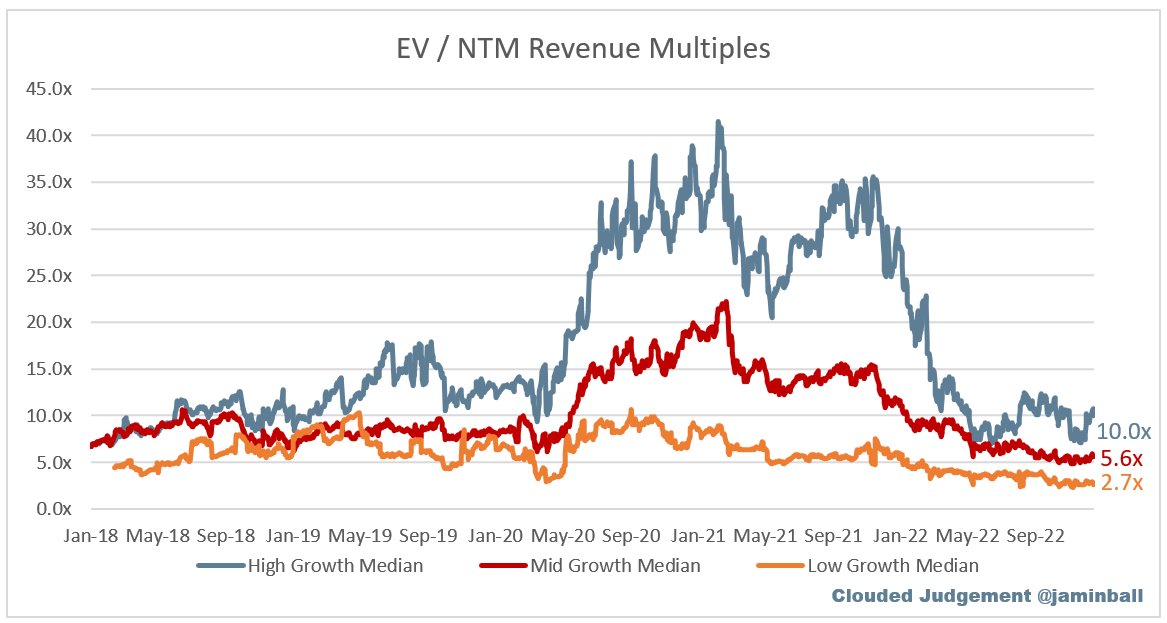
SaaS businesses are generally valued on a multiple of their revenue - in most cases the projected revenue for the next 12 months. Revenue multiples are a shorthand valuation framework. Given most software companies are not profitable, or not generating meaningful FCF, it’s the only metric to compare the entire industry against. Even a DCF is riddled with long term assumptions. The promise of SaaS is that growth in the early years leads to profits in the mature years. Multiples shown below are calculated by taking the Enterprise Value (market cap + debt - cash) / NTM revenue.
Overall Stats:
Overall Median: 5.2x
Top 5 Median: 11.8x
10Y: 3.4%
Bucketed by Growth. In the buckets below I consider high growth >30% projected NTM growth, mid growth 15%-30% and low growth <15%
High Growth Median: 10.0x
Mid Growth Median: 5.6x
Low Growth Median: 2.7x
Scatter Plot of EV / NTM Rev Multiple vs NTM Rev Growth
How correlated is growth to valuation multiple?
Growth Adjusted EV / NTM Rev
The below chart shows the EV / NTM revenue multiple divided by NTM consensus growth expectations. The goal of this graph is to show how relatively cheap / expensive each stock is relative to their growth expectations
Operating Metrics
Median NTM growth rate: 17%
Median LTM growth rate: 29%
Median Gross Margin: 74%
Median Operating Margin (25%)
Median FCF Margin: 0%
Median Net Retention: 120%
Median CAC Payback: 38 months
Median S&M % Revenue: 48%
Median R&D % Revenue: 28%
Median G&A % Revenue: 20%
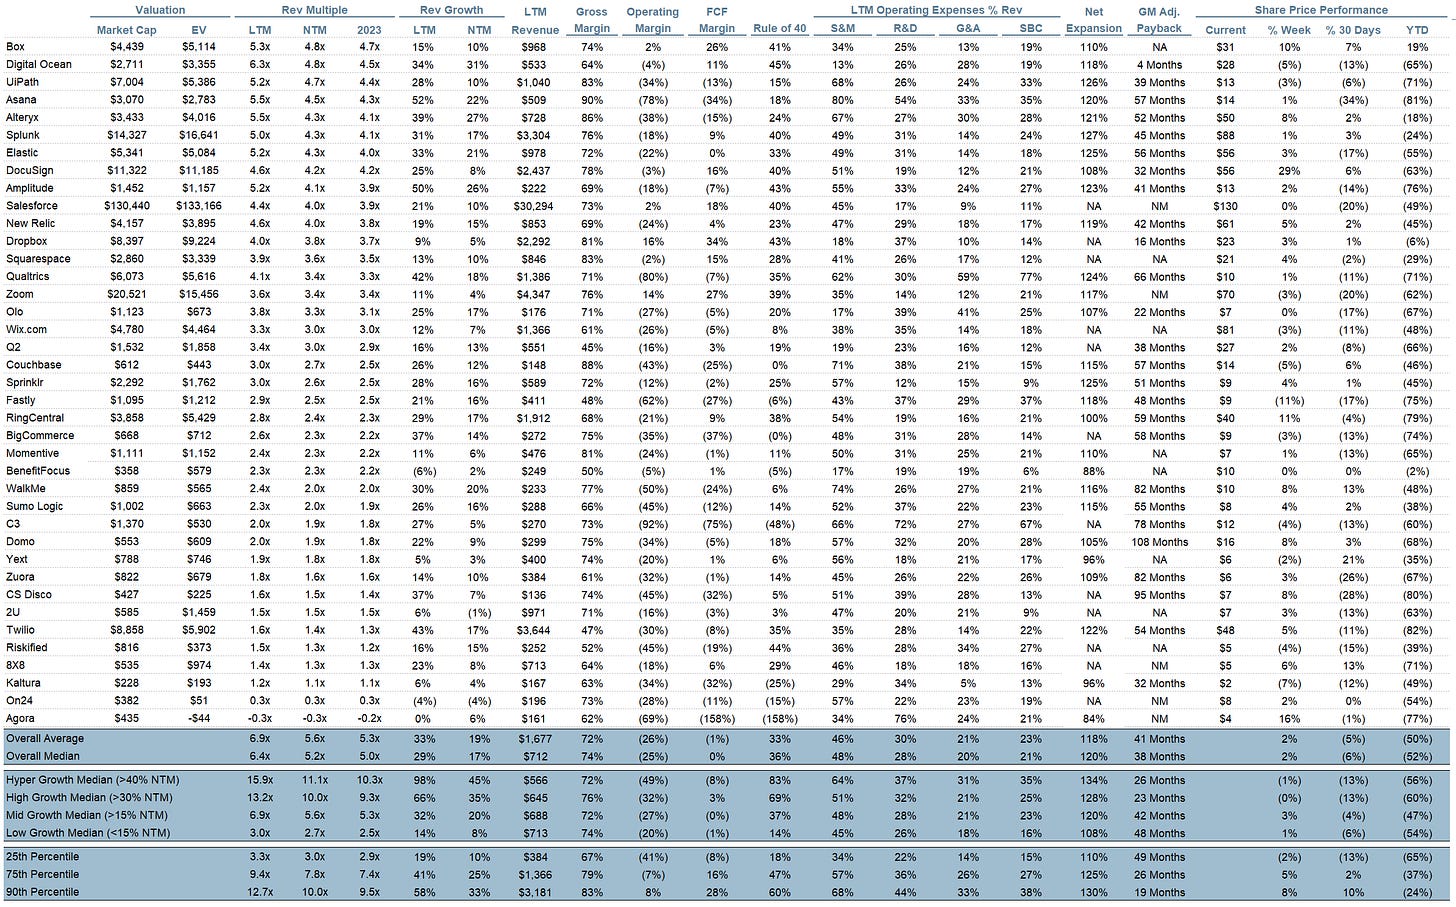
Comps Output
Rule of 40 shows LTM growth rate + LTM FCF Margin. FCF calculated as Cash Flow from Operations - Capital Expenditures
GM Adjusted Payback is calculated as: (Previous Q S&M) / (Net New ARR in Q x Gross Margin) x 12 . It shows the number of months it takes for a SaaS business to payback their fully burdened CAC on a gross profit basis. Most public companies don’t report net new ARR, so I’m taking an implied ARR metric (quarterly subscription revenue x 4). Net new ARR is simply the ARR of the current quarter, minus the ARR of the previous quarter. Companies that do not disclose subscription rev have been left out of the analysis and are listed as NA.
This post and the information presented are intended for informational purposes only. The views expressed herein are the author’s alone and do not constitute an offer to sell, or a recommendation to purchase, or a solicitation of an offer to buy, any security, nor a recommendation for any investment product or service. While certain information contained herein has been obtained from sources believed to be reliable, neither the author nor any of his employers or their affiliates have independently verified this information, and its accuracy and completeness cannot be guaranteed. Accordingly, no representation or warranty, express or implied, is made as to, and no reliance should be placed on, the fairness, accuracy, timeliness or completeness of this information. The author and all employers and their affiliated persons assume no liability for this information and no obligation to update the information or analysis contained herein in the future.


Very helpful
Good stuff as always! Quick question, how did you arrive at this group of companies and how do you determine when to add or remove any from the group? Thank you!