Every week I’ll provide updates on the latest trends in SaaS valuations, earnings announcements, and highlight any significant news. Follow along to stay up to date!
Housekeeping Note: This will probably be the last edition of the newsletter until we start the new year as I take some time off for the holidays!
Highlight of the Week - Cloud Businesses Accelerating
Now that every cloud businesses has reported Q3 earnings we can take a look at which businesses accelerated revenue growth. I define acceleration as any company who’s YoY revenue growth in Q3 was greater than their YoY revenue growth in Q2. The chart below shows Q3 YoY growth - Q2 YoY growth so any company showing a positive number accelerated (by my definition). As you can see, there were a number of companies that accelerated in Q (a much larger number than Q2). Maybe digital transformations are accelerating after all
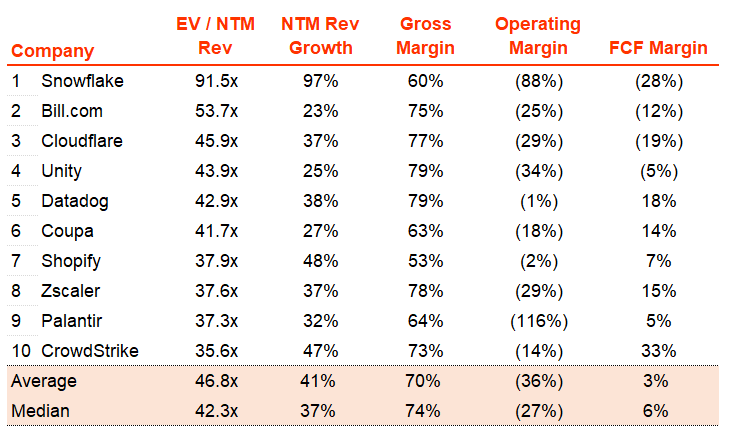
Top 10 EV / NTM Revenue Multiples
Top 10 Weekly Share Price Movement
Update on Multiples
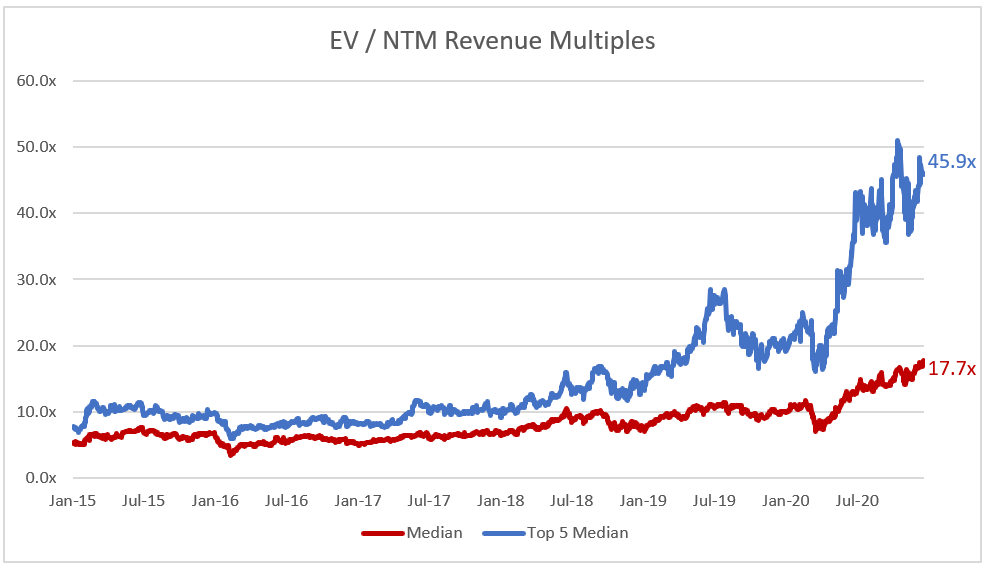
SaaS businesses are valued on a multiple of their revenue - in most cases the projected revenue for the next 12 months. Multiples shown below are calculated by taking the Enterprise Value (market cap + debt - cash) / NTM revenue. In the buckets below I consider high growth >30% projected NTM growth, mid growth 15%-30% and low growth <15%
Overall Stats:
Overall Median: 17.7x
Top 5 Median: 45.9x
3 Month Trailing Average: 15.7x
1 Year Trailing Average: 12.4x
Bucketed by Growth:
High Growth Median: 33.7x
Mid Growth Median: 19.1x
Low Growth Median: 7.9x
Operating Metrics
Median NTM growth rate: 21%
Median LTM growth rate: 30%
Median Gross Margin: 74%
Median Operating Margin (14%)
Median FCF Margin: 5%
Median Net Retention: 115%
Median CAC Payback: 24 months
Median S&M % Revenue: 44%
Median R&D % Revenue: 25%
Median G&A % Revenue: 18%
News
Workday Global Study: Organizations forecast spike in Digital Revenue as CEOs campion digital initiatives
Cloudflare announced Cloudflare Pages
Comps Output
Rule of 40 shows LTM growth rate + LTM FCF Margin. FCF calculated as Cash Flow from Operations - Capital Expenditures
GM Adjusted Payback is calculated as: (Previous Q S&M) / (Net New ARR in Q x Gross Margin) x 12 . It shows the number of months it takes for a SaaS business to payback their fully burdened CAC on a gross profit basis. Most public companies don’t report net new ARR, so I’m taking an implied ARR metric (quarterly subscription revenue x 4). Net new ARR is simply the ARR of the current quarter, minus the ARR of the previous quarter. Companies that do not disclose subscription rev have been left out of the analysis and are listed as NA.


Jamin,
I have found your posts extremely valuable since I signed up to receive them. Thanks so much for all the work you clearly put into this content. It is very much appreciated. I find the charts really useful as they bring together lots of data that’s is a pain to find separately. I am focused on companies that are FCF-positive, and your Rule of 40 chart provides this.
Thanks again. Blessings for 2021.
Jamin - thank you for this newsletter; the insights are fascinating. Qq: if you can share, what source(s) do you use?