
Clouded Judgement 12.26.25 - Exuberance Returning

Every week I’ll provide updates on the latest trends in cloud software companies. Follow along to stay up to date!
Exuberance Is Coming Back to Venture
One of my predictions for 2026 - we are setting up for a year of real exuberance. Not the quiet optimism of a steady eddy market, or selective excitement we have seen in pockets of over the last year, but a broad based surge in activity that will feel familiar to anyone who lived through 2020 and 2021. In venture markets especially, I think 2026 ends up being remembered as a true banger year.
The setup starts with the public markets. The public AI trade, which has come under fire lately, feels poised to fully roar back. As we move through the next year, I expect GDP growth to continue surprising to the upside, inflation to keep grinding lower, and interest rates to finally give investors the psychological green light they have been waiting for. Layer on top of that a slate of blockbuster tech IPOs and meaningful M&A in and around AI themes, and you get the thing private markets care about most. Liquidity. Once liquidity starts flowing again, the risk curve shifts fast. I don’t expect a zero interest rate driven surge like 2020/2021, but it feels like the private markets are really spring loaded.
At the same time, something important is happening underneath the surface in AI that I think the market is still under appreciating. We are finally reaching the point where a much wider range of AI companies are not just experimenting, but are growing and scaling revenue in a meaningful way. For the last couple of years, there has been a lot of debate about ROI. Does AI actually pay for itself. Is this just cost and capex with unclear payoff. In 2026, I think we start to get real proof points. Not just a handful of infrastructure winners, but application companies across different verticals showing durable growth, expanding budgets, and workflows that are clearly better because AI is embedded in them. Said another way, ROI stops being theoretical and starts showing up in reported numbers.
When those proof points stack up, they feed directly back into market behavior. Public investors get more confident underwriting long term growth. Late stage private investors lean in harder. Growth equity re-accelerates. And venture takes off. That is when things start to move very quickly.
In many ways we’re already starting to see this in the venture markets. This was the busiest November / December I remember in the last 10 years. Valuations are rising, and not just in early stage but in growth as well. In this upcoming environment, I expect the hottest companies to raise multiple rounds in very short timeframes. Three or more rounds inside of twelve months will not be unusual, and we will increasingly see two rounds effectively done at once through tranched or structured financings. Valuations will move up across the board, from early venture through late stage growth, often faster than fundamentals can possibly justify in the moment. Funds will race to raise larger and larger pools of capital as it will appear as if the “ante” into the game has gone up (because companies’ raising more and more faster and faster), anchored by the argument that this time is different because AI really is a platform shift. And by the end of the year, I suspect many of us will be looking around saying some version of how did we do this again, 2021 was not that long ago.
All of that sounds frothy, and it probably will be. But here is the part that often gets missed. Periods of exuberance are also when some of the best venture investments of all time get made. When markets are moving fast, when new categories are forming, and when capital is abundant, it becomes easier for truly exceptional companies to scale quickly and lock in positions that are very hard to dislodge later. The challenge for investors (and what I’m thinking about) is not avoiding the cycle, but navigating it. Knowing when you are paying for momentum versus when you are underwriting something structurally important that will matter a decade from now.
So yes, I expect 2026 to feel wild. I expect activity to spike, valuations to soar, and behavior to occasionally look irrational. But I also expect that, buried inside that noise, will be a cohort of companies that end up defining the next era of software and AI. Those are often easiest to spot when everyone else is distracted by the frenzy. No matter where we are in any given cycle, there are always game changing venture investments to be made.
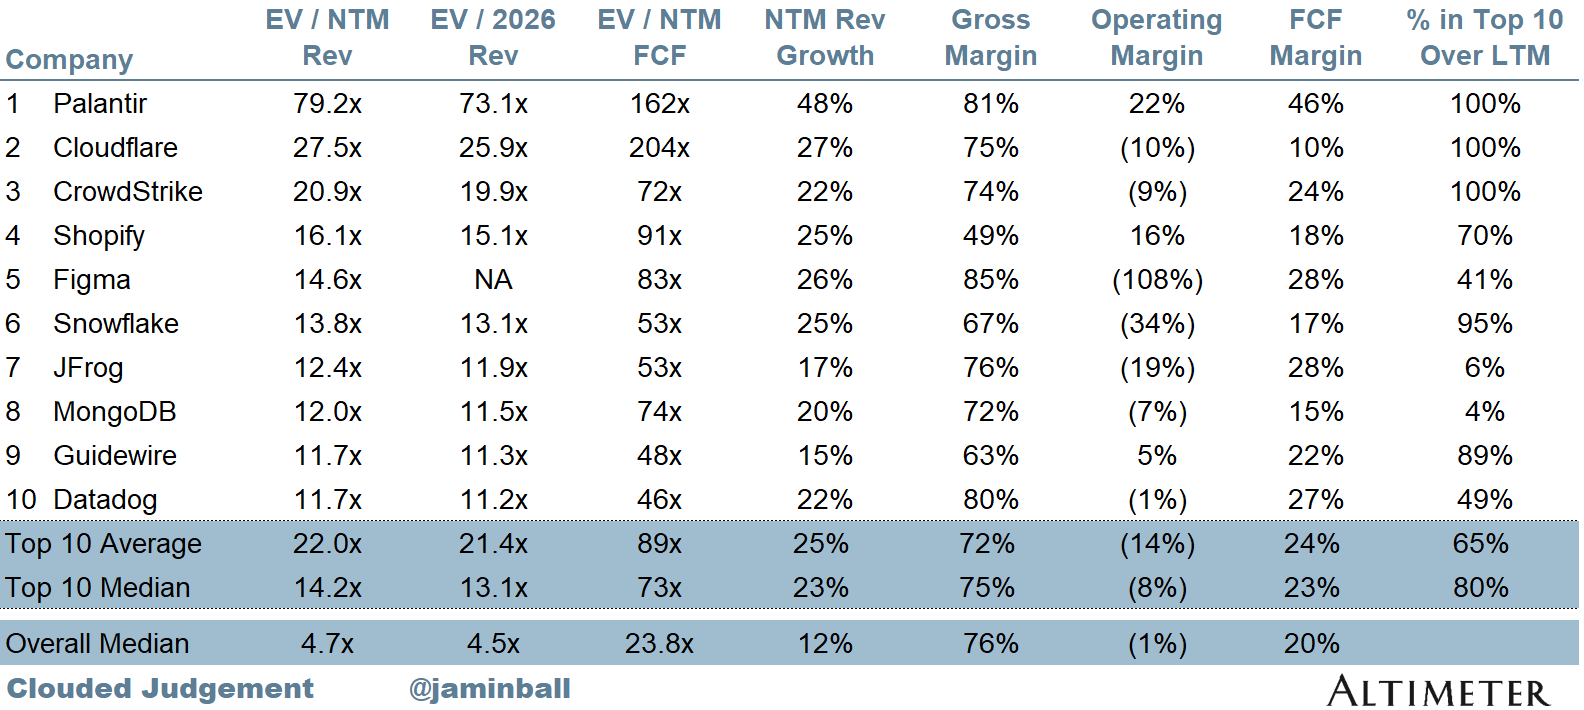
Top 10 EV / NTM Revenue Multiples
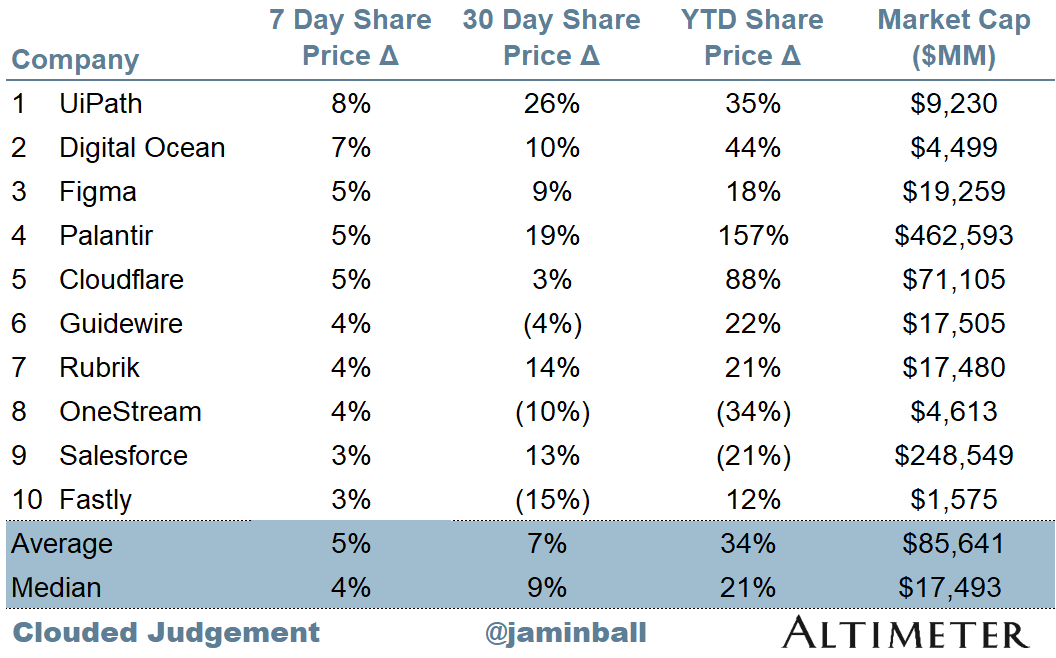
Top 10 Weekly Share Price Movement
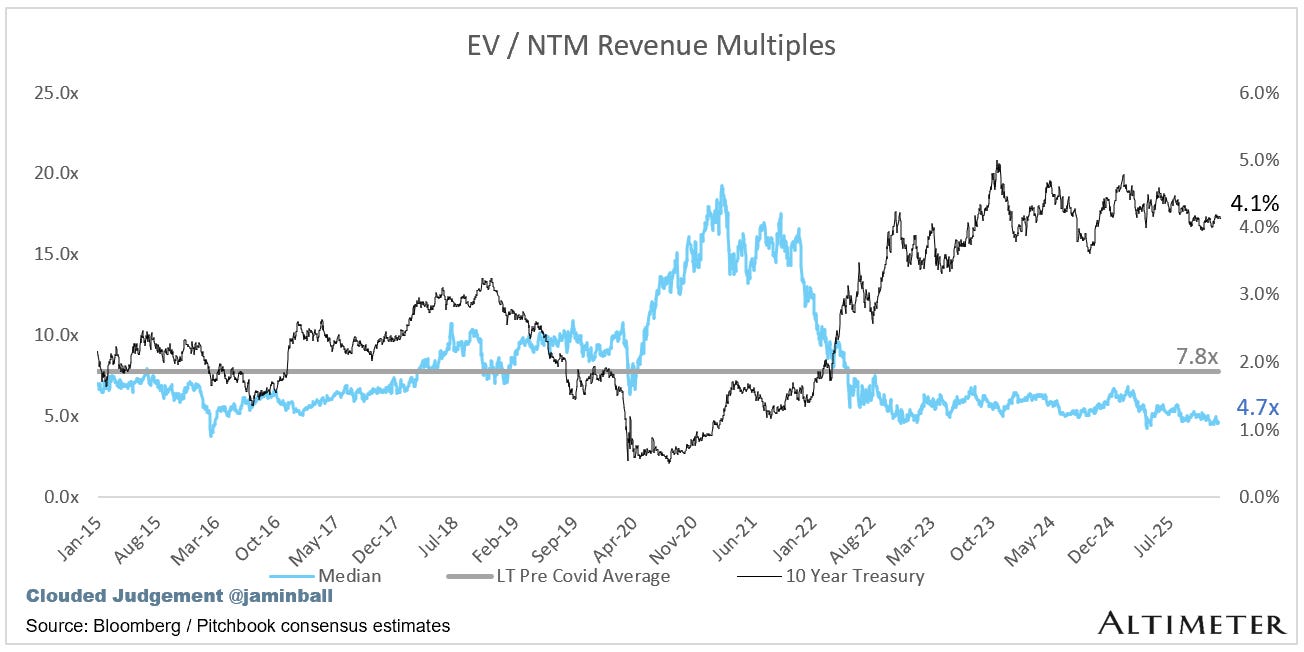
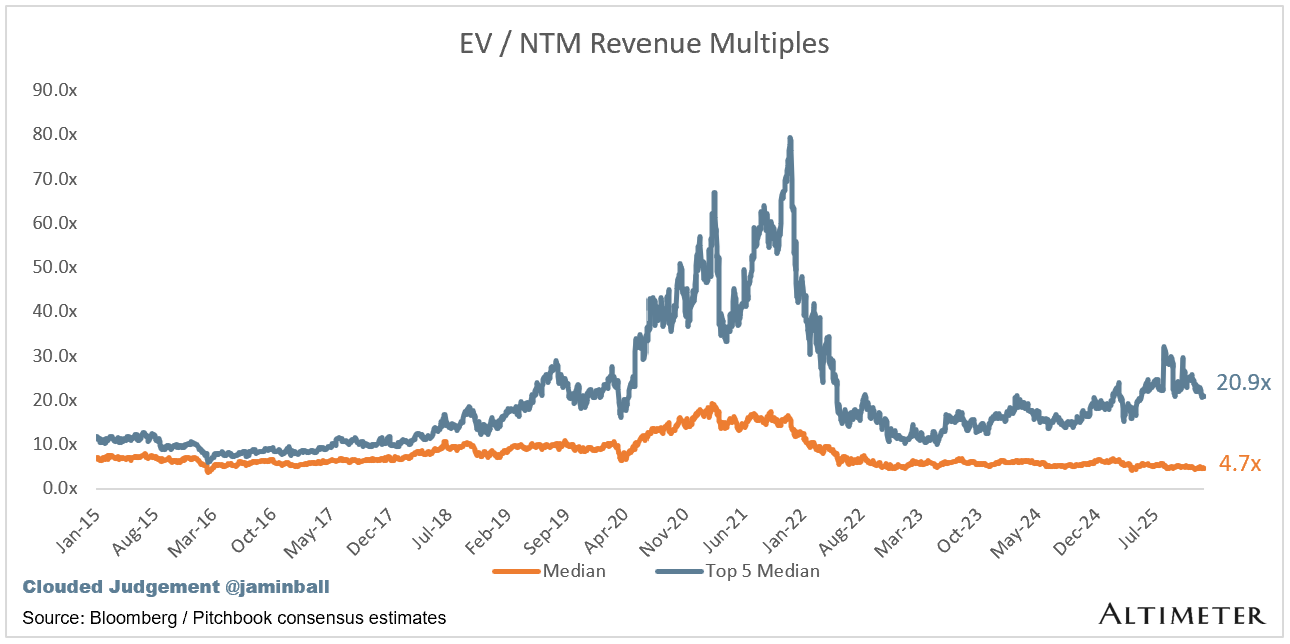
Update on Multiples
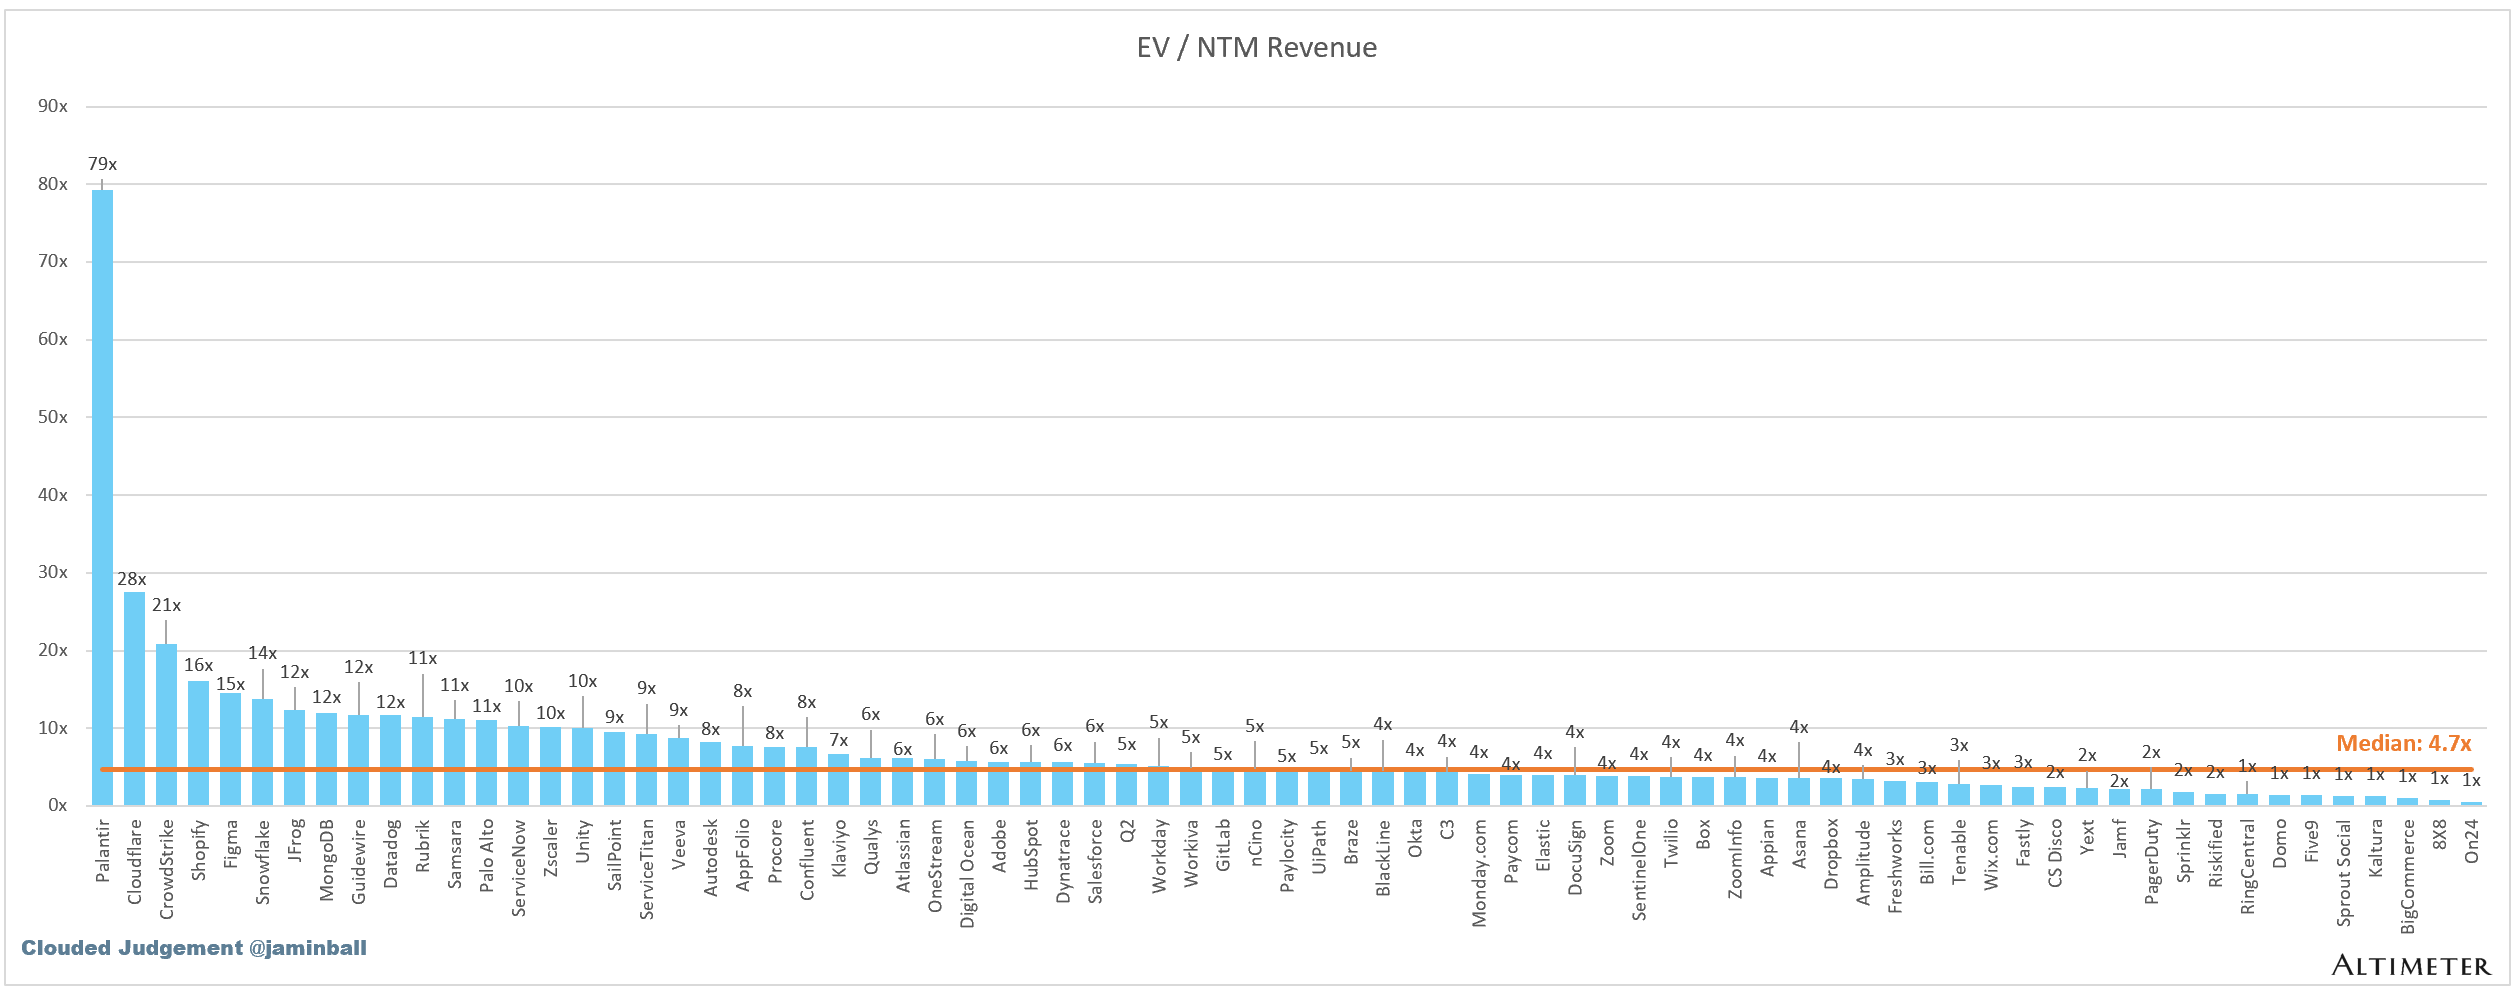
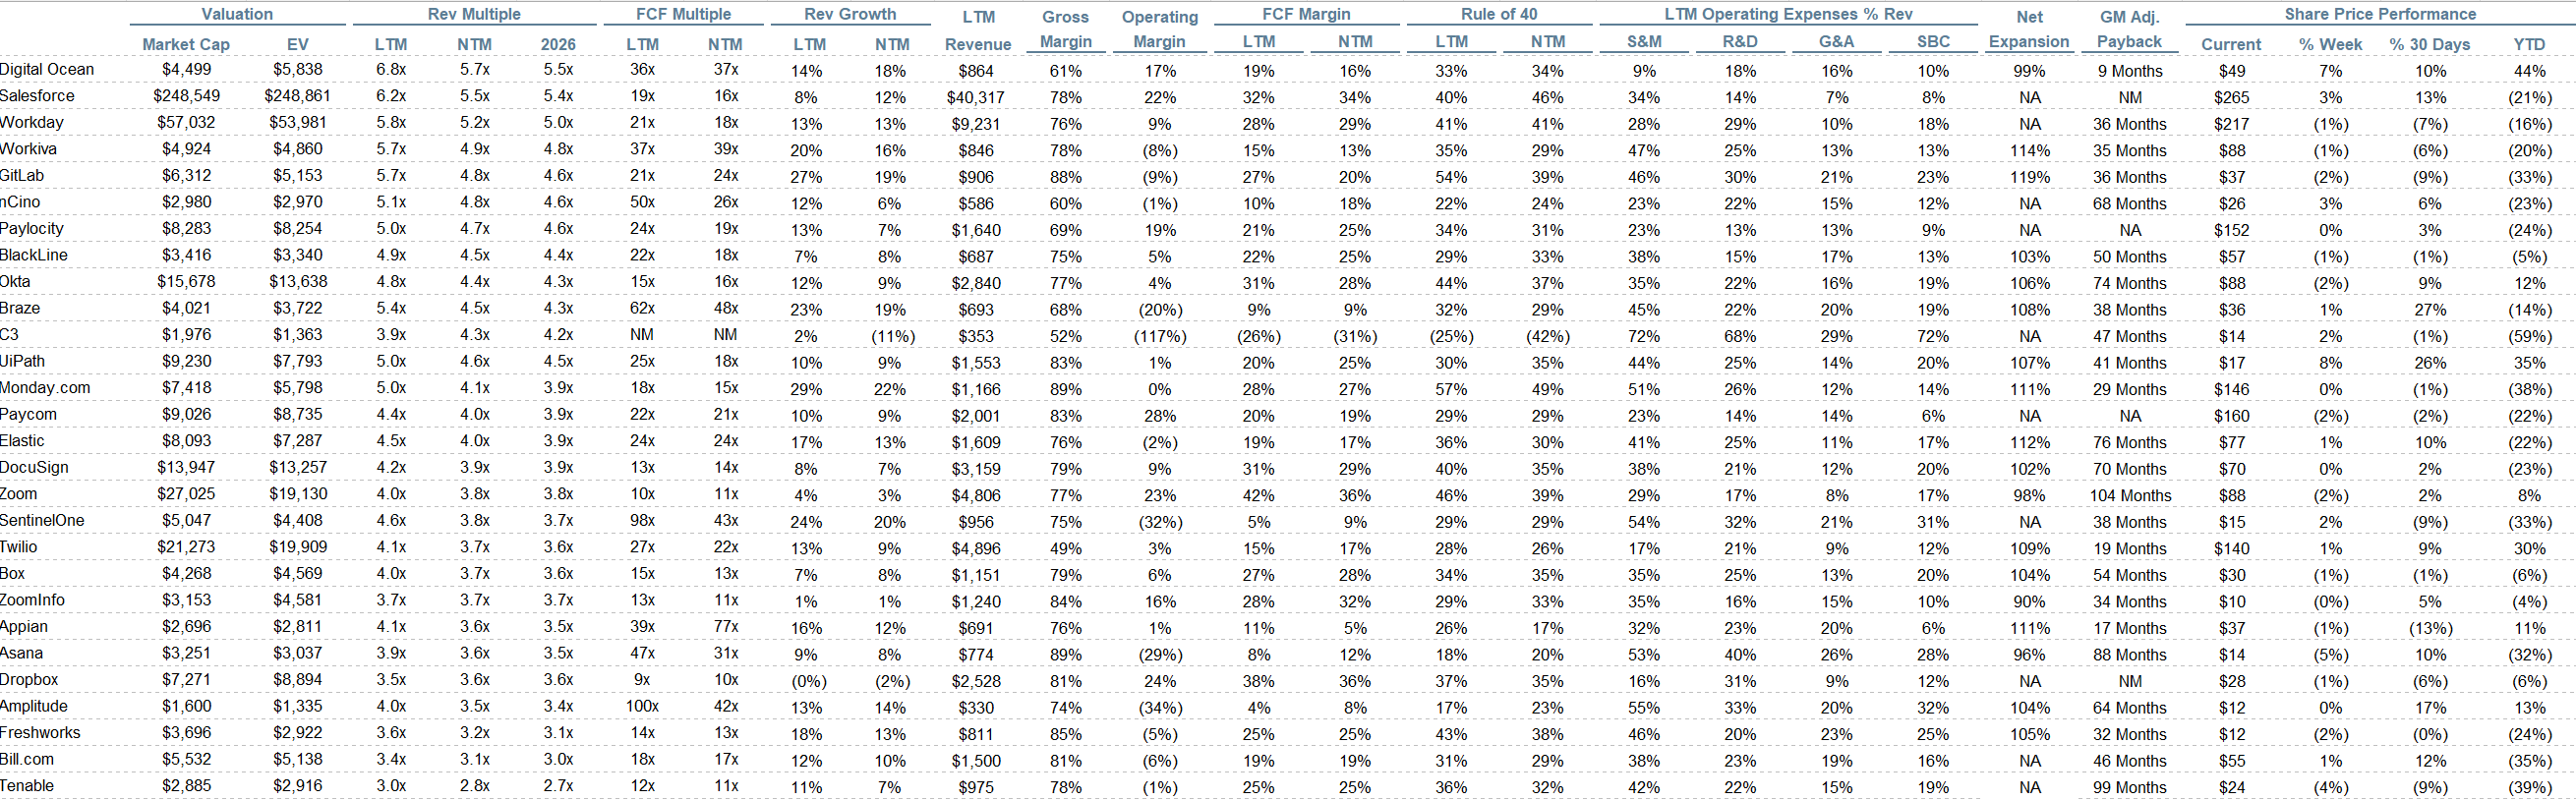
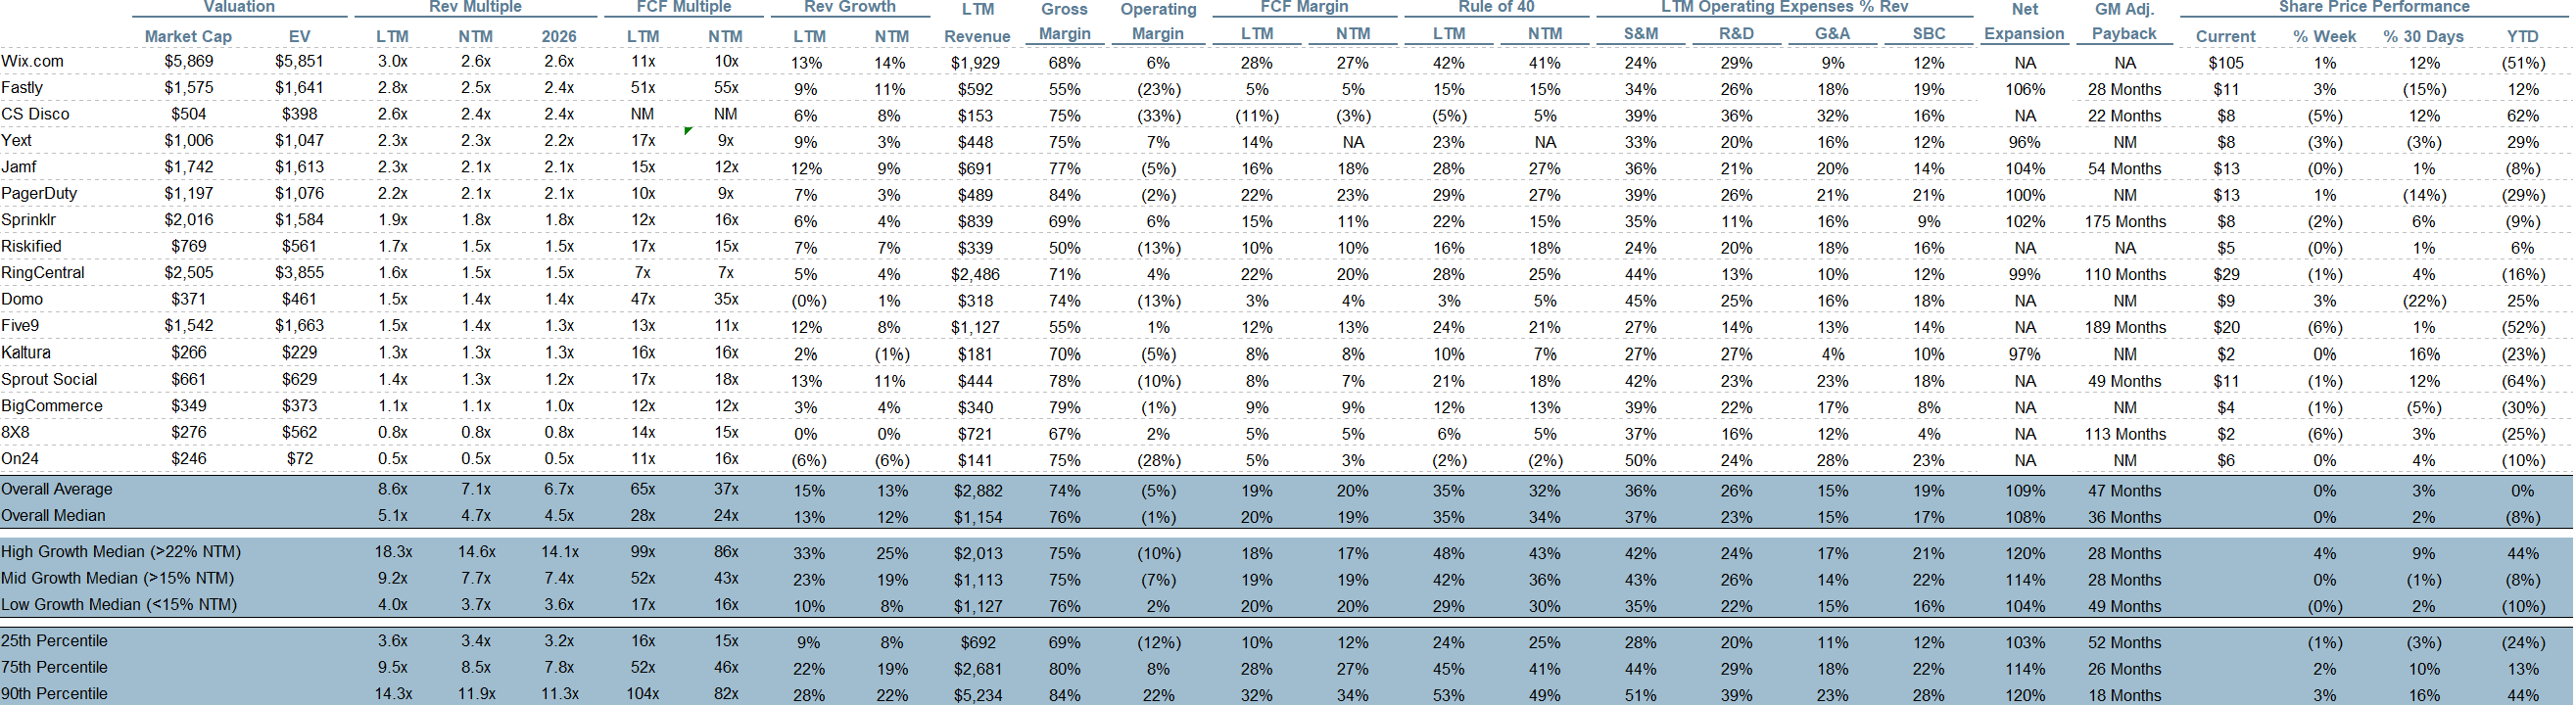
SaaS businesses are generally valued on a multiple of their revenue - in most cases the projected revenue for the next 12 months. Revenue multiples are a shorthand valuation framework. Given most software companies are not profitable, or not generating meaningful FCF, it’s the only metric to compare the entire industry against. Even a DCF is riddled with long term assumptions. The promise of SaaS is that growth in the early years leads to profits in the mature years. Multiples shown below are calculated by taking the Enterprise Value (market cap + debt - cash) / NTM revenue.
Overall Stats:
Overall Median: 4.7x
Top 5 Median: 20.9x
10Y: 4.1%
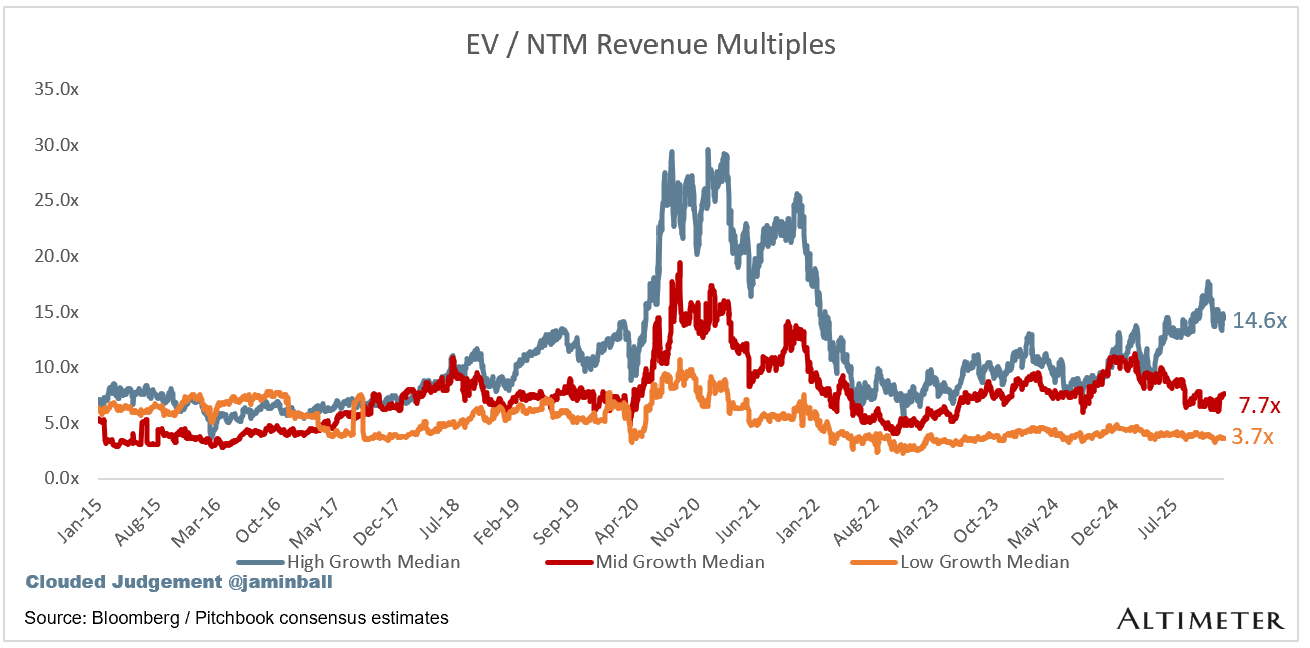
Bucketed by Growth. In the buckets below I consider high growth >22% projected NTM growth, mid growth 15%-22% and low growth <15%. I had to adjusted the cut off for “high growth.” If 22% feels a bit arbitrary, it’s because it is…I just picked a cutoff where there were ~10 companies that fit into the high growth bucket so the sample size was more statistically significant
High Growth Median: 14.6x
Mid Growth Median: 7.7x
Low Growth Median: 3.7x
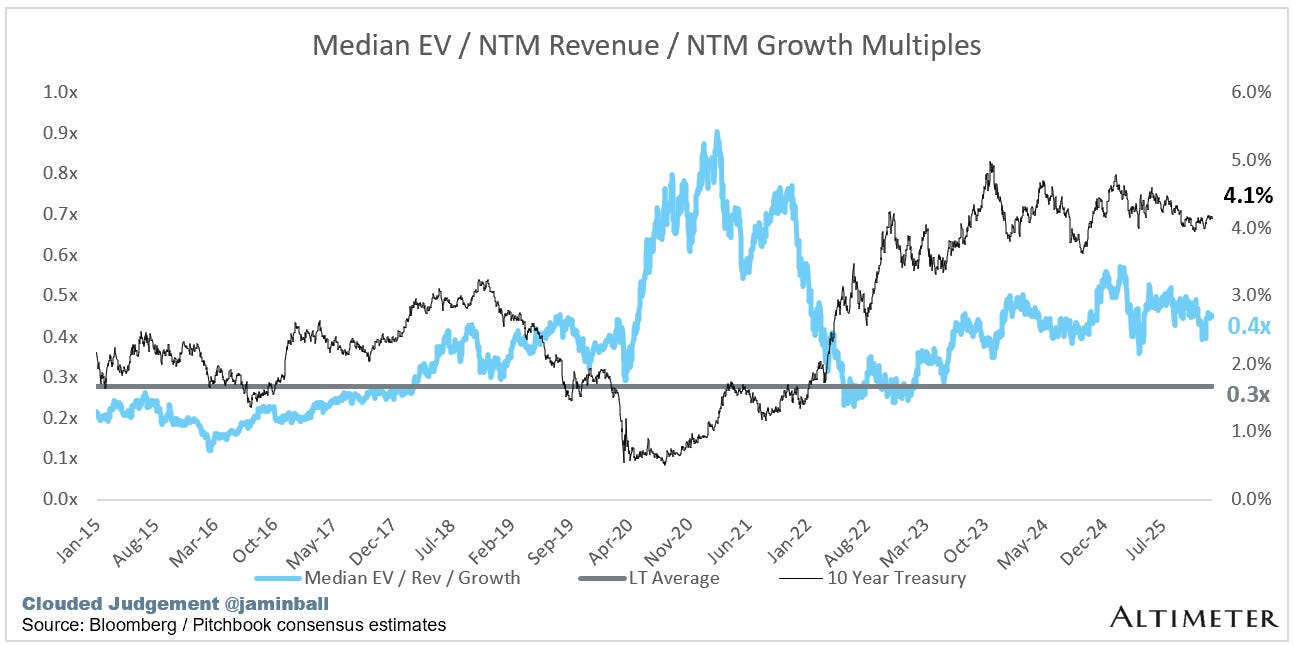
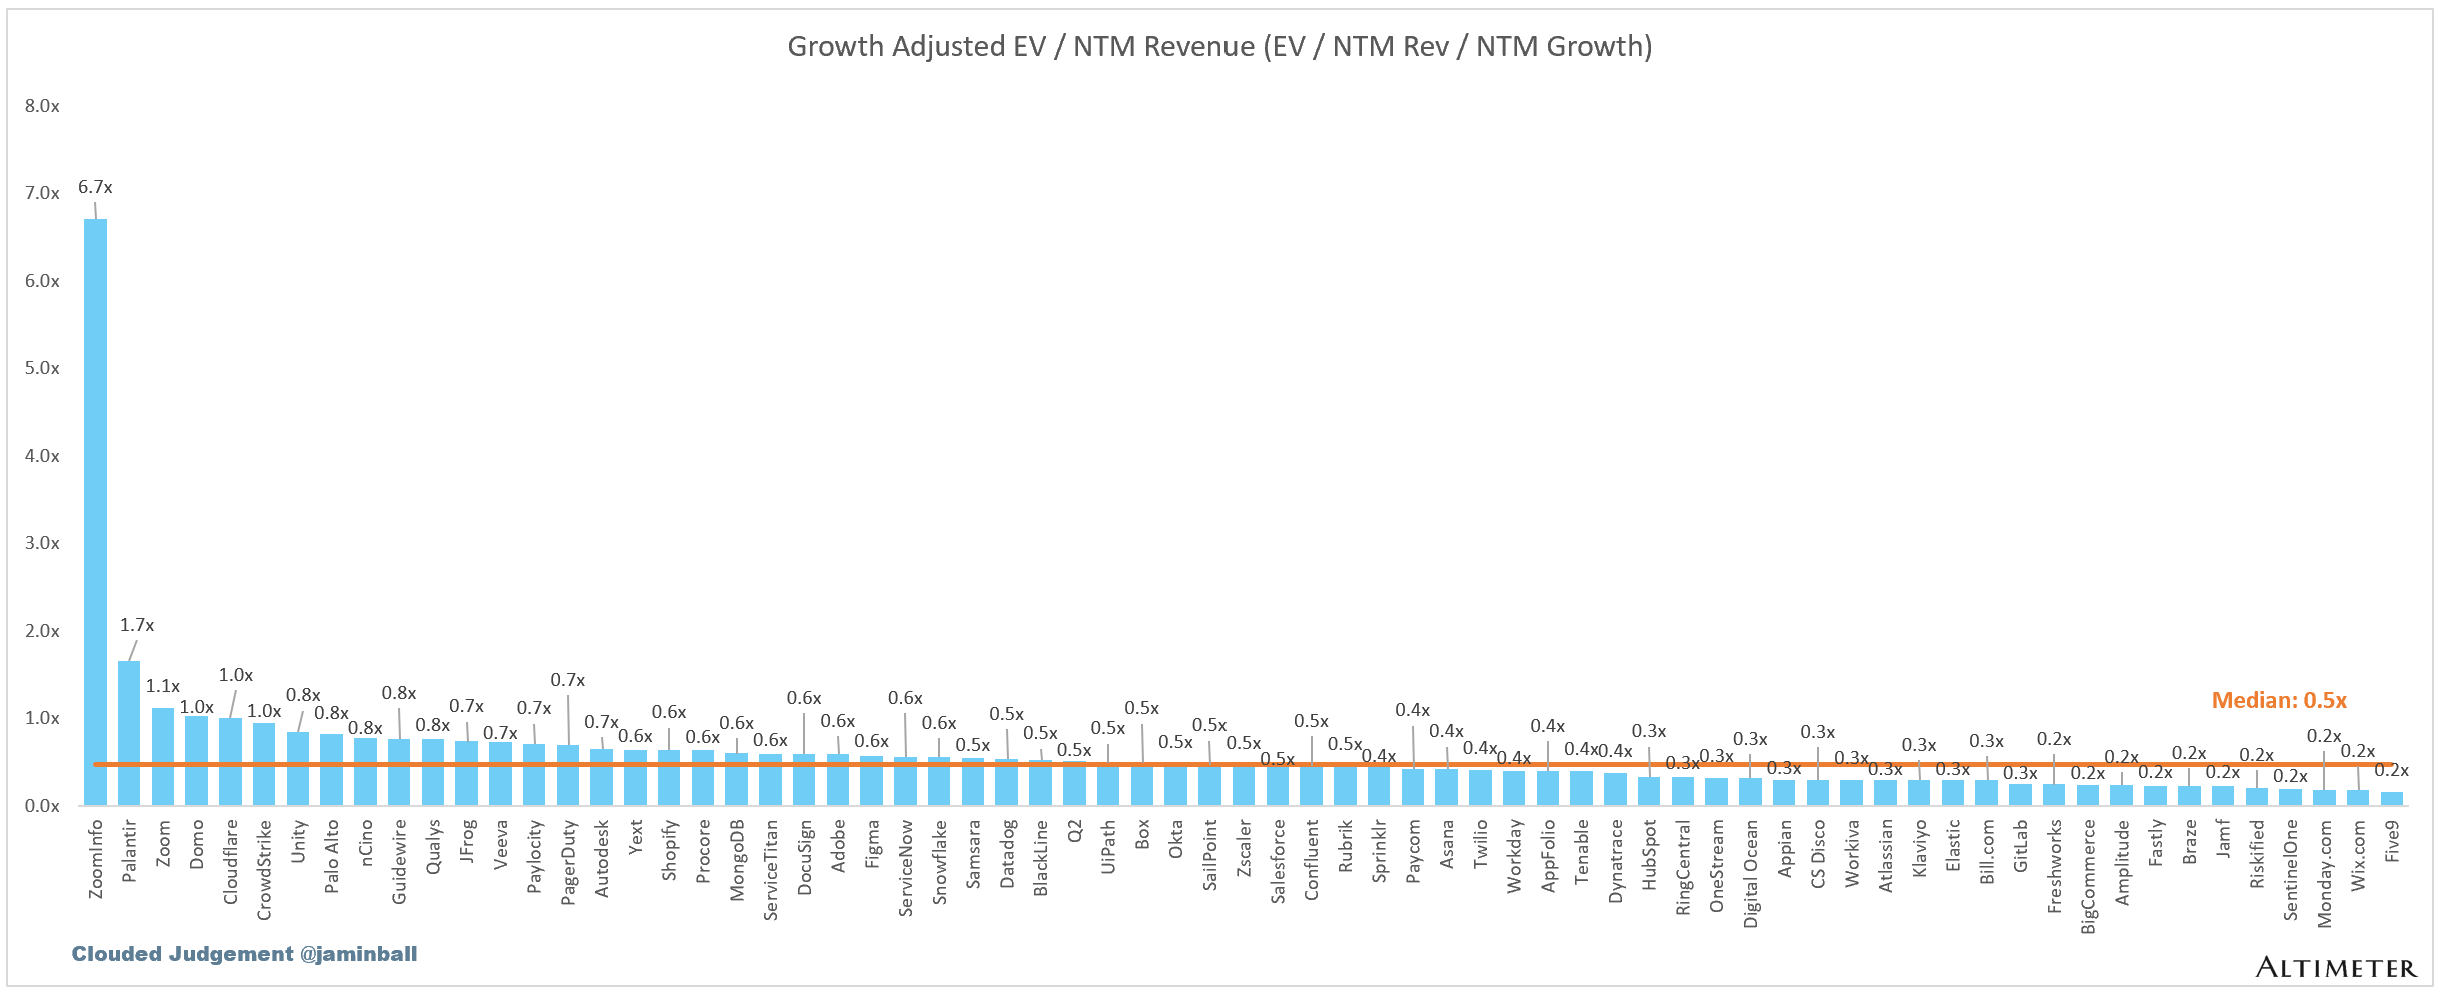
EV / NTM Rev / NTM Growth
The below chart shows the EV / NTM revenue multiple divided by NTM consensus growth expectations. So a company trading at 20x NTM revenue that is projected to grow 100% would be trading at 0.2x. The goal of this graph is to show how relatively cheap / expensive each stock is relative to its growth expectations.
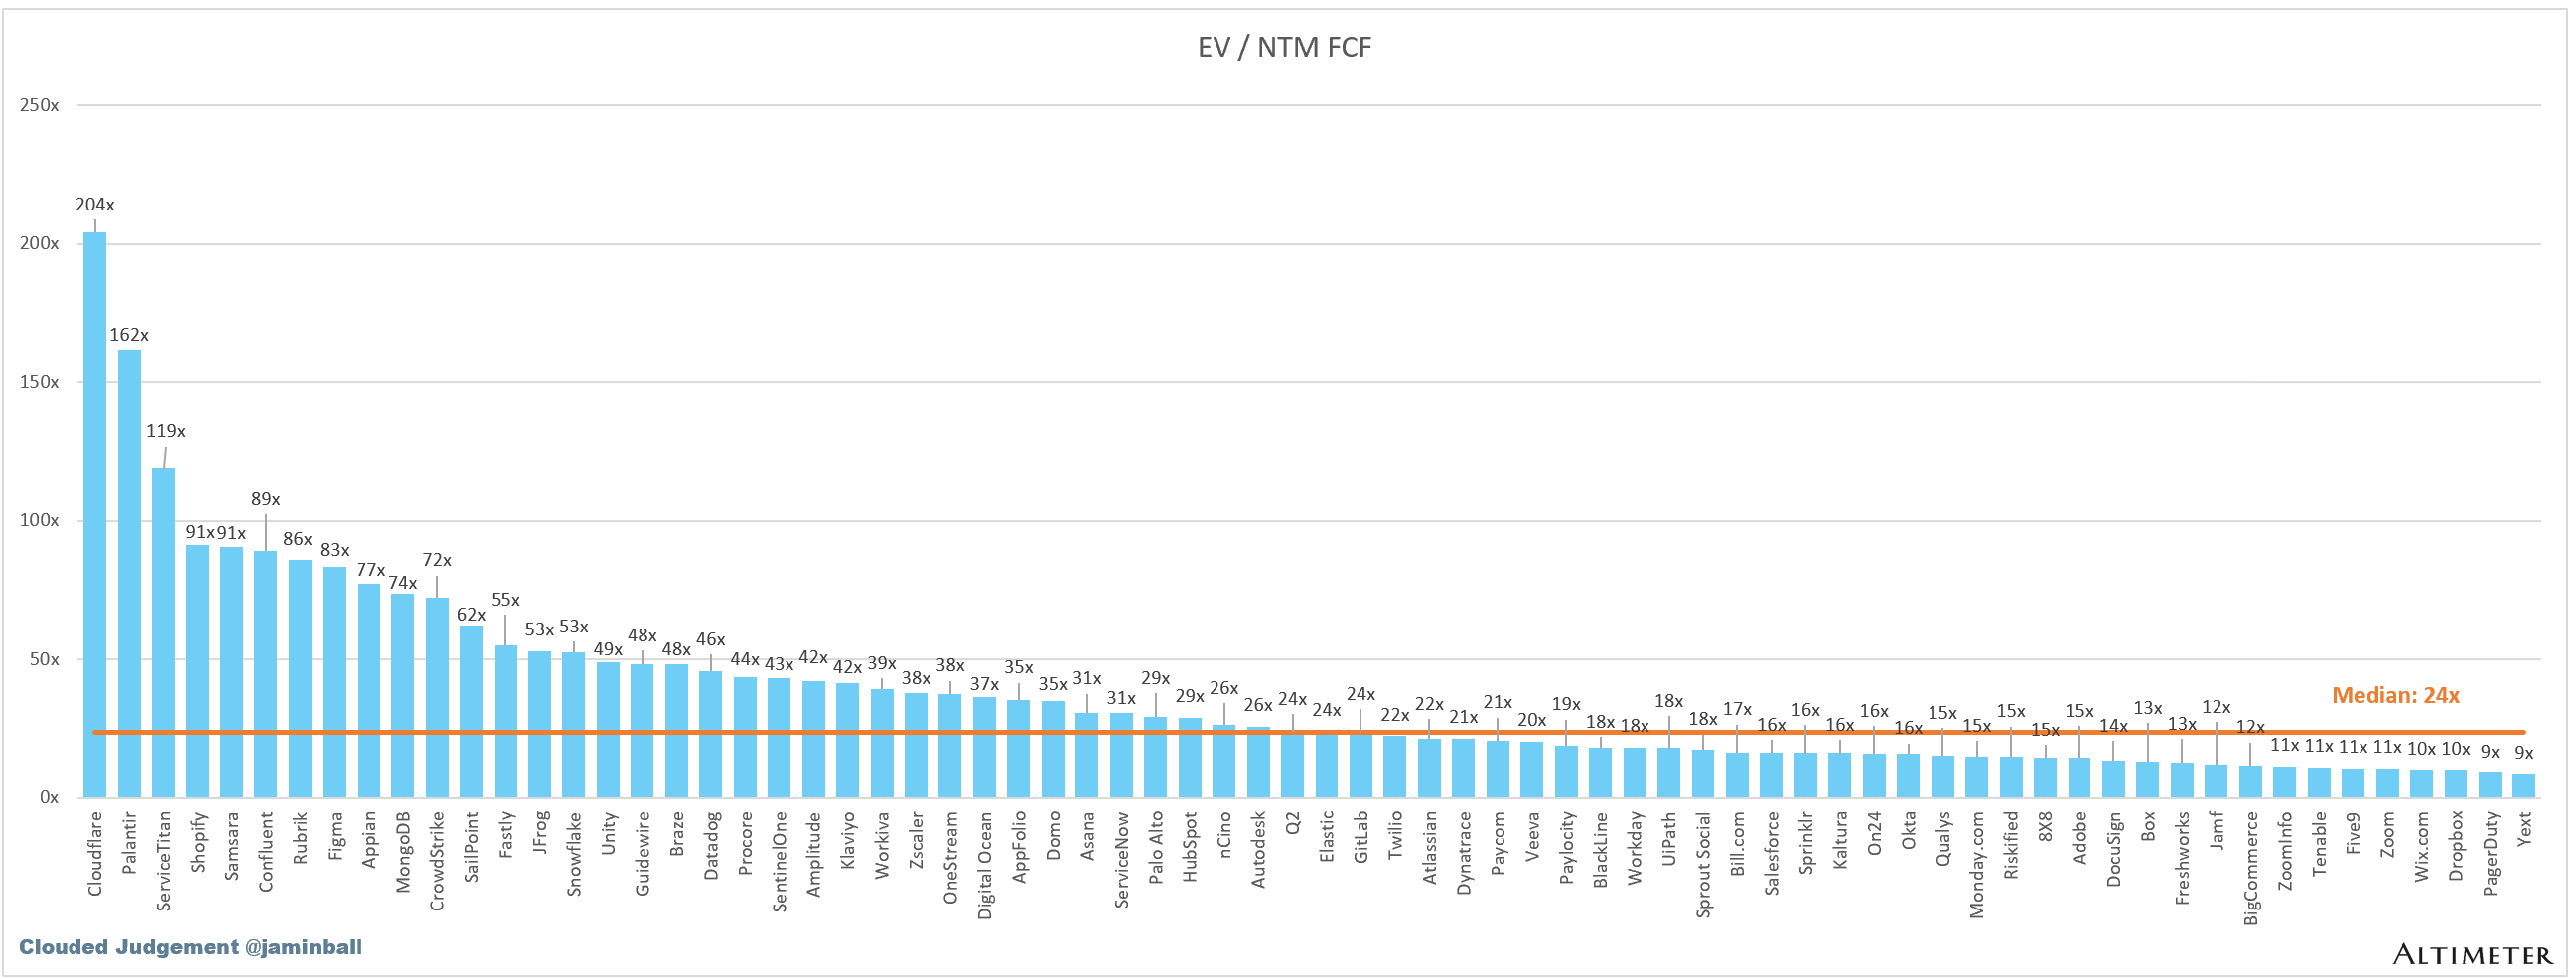
EV / NTM FCF
The line chart shows the median of all companies with a FCF multiple >0x and <100x. I created this subset to show companies where FCF is a relevant valuation metric.
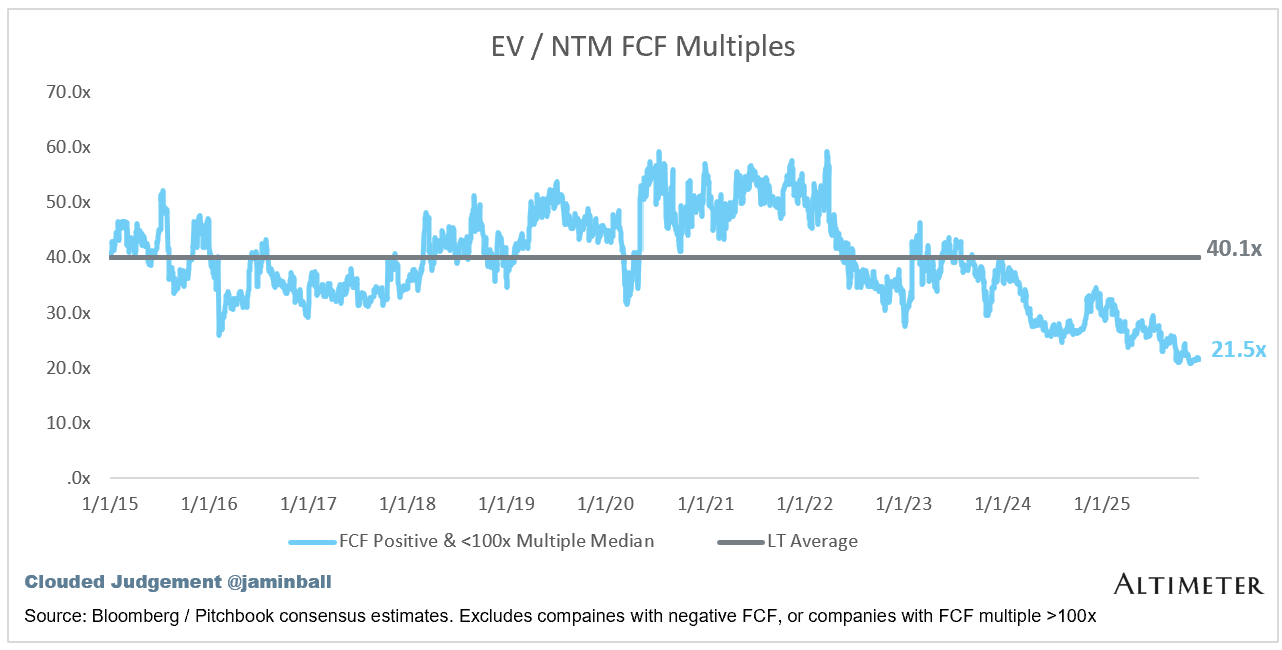
Companies with negative NTM FCF are not listed on the chart
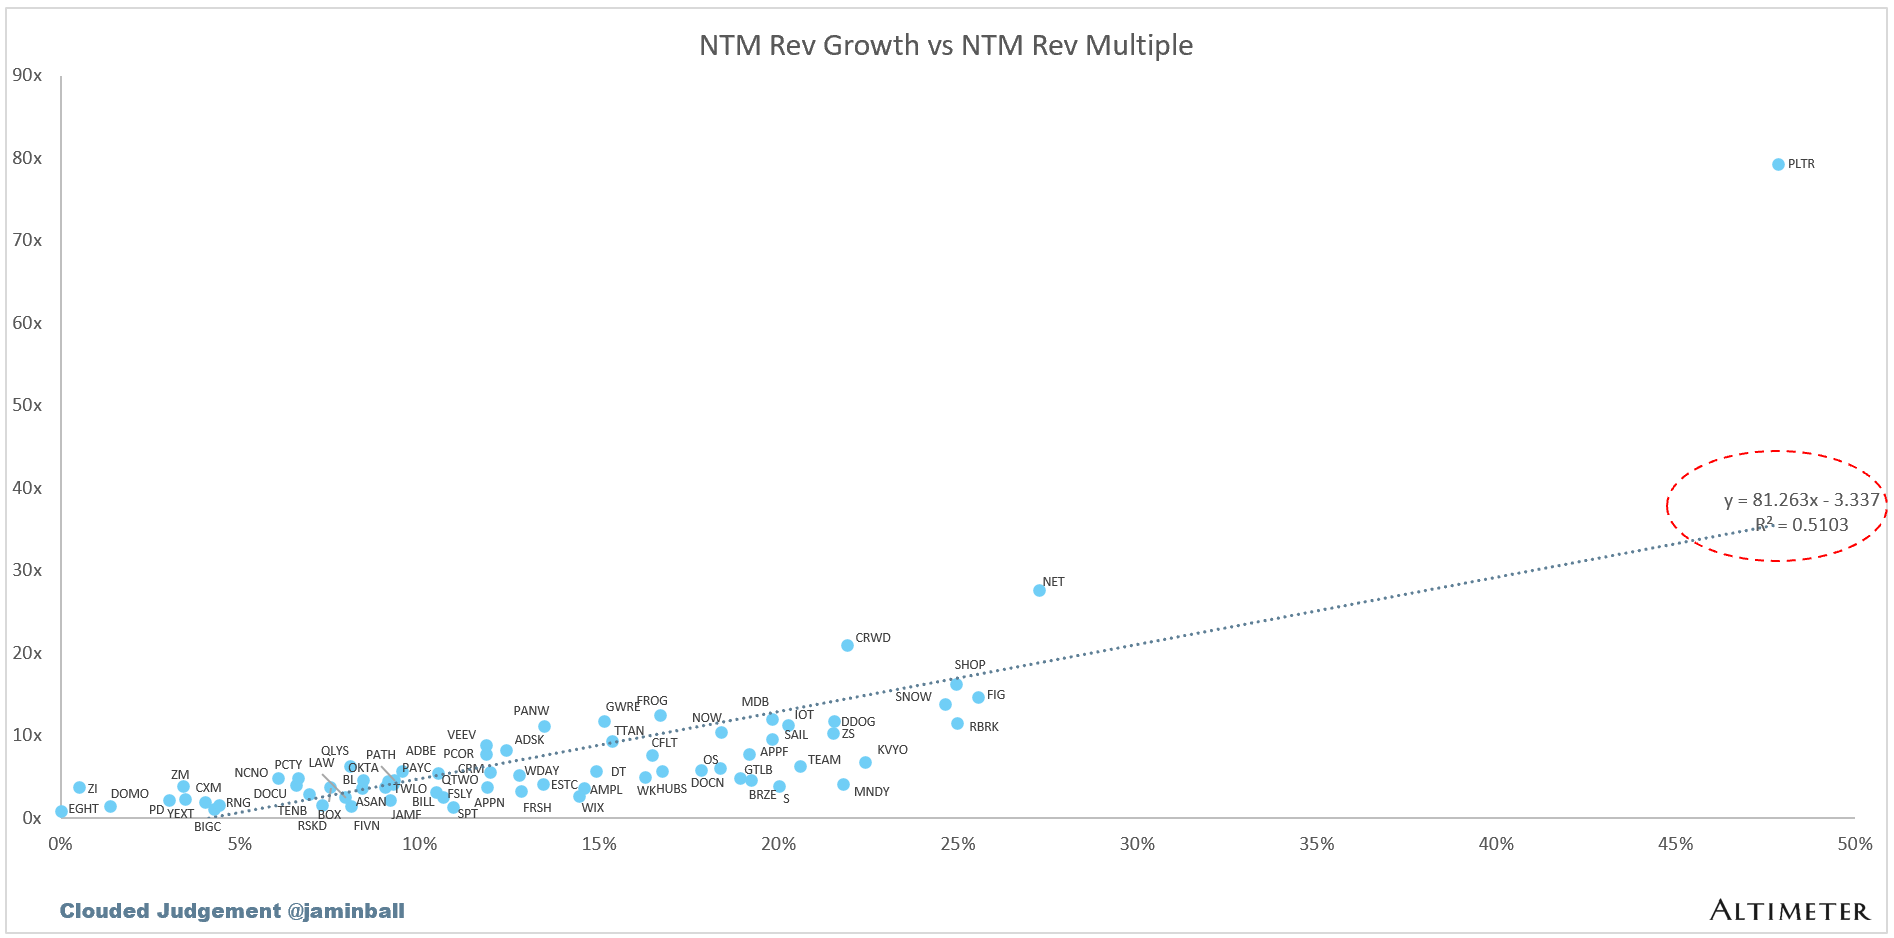
Scatter Plot of EV / NTM Rev Multiple vs NTM Rev Growth
How correlated is growth to valuation multiple?
Operating Metrics
Median NTM growth rate: 12%
Median LTM growth rate: 13%
Median Gross Margin: 76%
Median Operating Margin (1%)
Median FCF Margin: 19%
Median Net Retention: 108%
Median CAC Payback: 36 months
Median S&M % Revenue: 37%
Median R&D % Revenue: 23%
Median G&A % Revenue: 15%
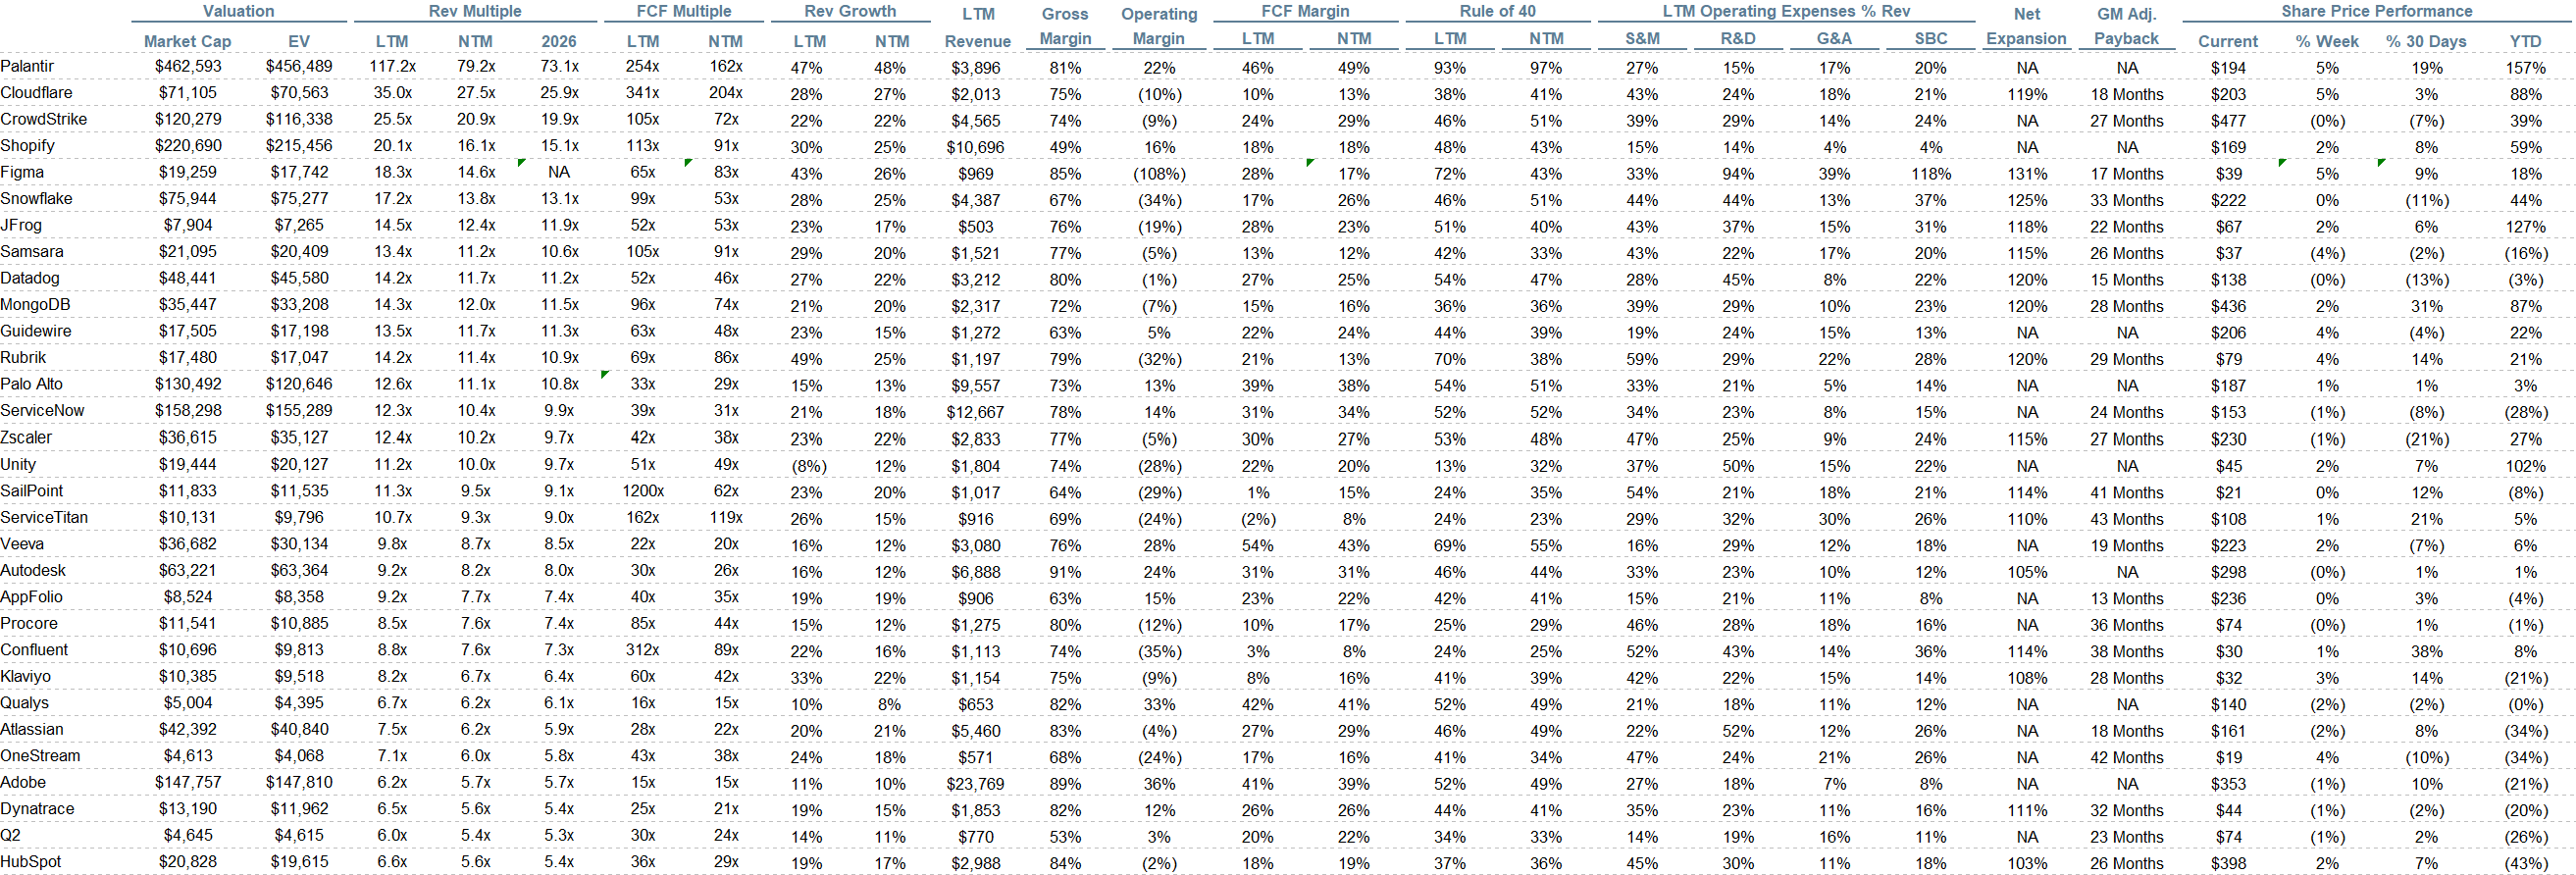
Comps Output
Rule of 40 shows rev growth + FCF margin (both LTM and NTM for growth + margins). FCF calculated as Cash Flow from Operations - Capital Expenditures
GM Adjusted Payback is calculated as: (Previous Q S&M) / (Net New ARR in Q x Gross Margin) x 12. It shows the number of months it takes for a SaaS business to pay back its fully burdened CAC on a gross profit basis. Most public companies don’t report net new ARR, so I’m taking an implied ARR metric (quarterly subscription revenue x 4). Net new ARR is simply the ARR of the current quarter, minus the ARR of the previous quarter. Companies that do not disclose subscription rev have been left out of the analysis and are listed as NA.
Sources used in this post include Bloomberg, Pitchbook and company filings
The information presented in this newsletter is the opinion of the author and does not necessarily reflect the view of any other person or entity, including Altimeter Capital Management, LP (”Altimeter”). The information provided is believed to be from reliable sources but no liability is accepted for any inaccuracies. This is for information purposes and should not be construed as an investment recommendation. Past performance is no guarantee of future performance. Altimeter is an investment adviser registered with the U.S. Securities and Exchange Commission. Registration does not imply a certain level of skill or training. Altimeter and its clients trade in public securities and have made and/or may make investments in or investment decisions relating to the companies referenced herein. The views expressed herein are those of the author and not of Altimeter or its clients, which reserve the right to make investment decisions or engage in trading activity that would be (or could be construed as) consistent and/or inconsistent with the views expressed herein.
This post and the information presented are intended for informational purposes only. The views expressed herein are the author’s alone and do not constitute an offer to sell, or a recommendation to purchase, or a solicitation of an offer to buy, any security, nor a recommendation for any investment product or service. While certain information contained herein has been obtained from sources believed to be reliable, neither the author nor any of his employers or their affiliates have independently verified this information, and its accuracy and completeness cannot be guaranteed. Accordingly, no representation or warranty, express or implied, is made as to, and no reliance should be placed on, the fairness, accuracy, timeliness or completeness of this information. The author and all employers and their affiliated persons assume no liability for this information and no obligation to update the information or analysis contained herein in the future.
78000
Probably the biggest driver will be base models from OpenAI and xAI getting to higher performance at lower token cost. We are getting there for a lot of agentic use cases but it’s still highly dependent on the scaffolding that the application layer is applying.
Reasoning is a bit too slow and expensive for most Enterprise applications, but if we get GPT5 high/xhigh levels of intelligence in a non reasoning base model, we are going to see an explosion of usage outside of coding.