
Clouded Judgement 1.7.22

Every week I’ll provide updates on the latest trends in cloud software companies. Follow along to stay up to date!
Update on Multiples
This week was quite volatile for cloud software businesses. Over the last week only one cloud software company traded up. When looking at median multiples we’re now back to where we were pre-covid. The overall median multiple is 2% above pre-covid highs, 24% above where we were on Jan 1, 2020, and exactly at the previous peak in August 2019.
However, high growth software multiples are still elevated. Looking at high growth software median only - we are still 57% above pre-covid highs, 86% above where we were on Jan 1, 2020, and 24% above the previous peak in September 2019.
It is a little tricky to look at high growth and compare it to pre-covid because many of hte companies in that bucket now were not public pre-covid. This list includes Snowflake, Hashicorp, Gitlab, SentinelOne, Confluent, Asana, Monday.com, Zoominfo, Amplitude, Braze, UiPath, DigitalOcean, Qualtrics, Freshworks, JFrog. If I remove the recent IPOs from the high growth median bucket the high growth bucket has a median multiple of closer to 18x (it’s 22x with them). The 18x multiple would be a 27% premium to pre-covid highs for the same basket of high growth companies.
Other Thoughts
There’s nothing magical about the “pre-covid” level for multiples. I don’t mean to imply that pre-covid levels are the lowest we could fall in this current sell off. If we look back historically pre-covid levels were (at the time) near all time highs! We very certainly could continue falling well past pre-covid multiples. The 10 year is around 1.7% today. In the Fall of 2018 it was closer to 3%, and median SaaS multiples were closer to 7x then.
There were a couple other good tweets I saw this week I wanted to share here:


Top 10 EV / NTM Revenue Multiples

Top 10 Weekly Share Price Movement

Update on Multiples
SaaS businesses are valued on a multiple of their revenue - in most cases the projected revenue for the next 12 months. Multiples shown below are calculated by taking the Enterprise Value (market cap + debt - cash) / NTM revenue.
Overall Stats:
Overall Median: 11.1x
Top 5 Median: 34.2x
3 Month Trailing Average: 9.6x
1 Year Trailing Average: 10.0x


Bucketed by Growth. In the buckets below I consider high growth >30% projected NTM growth, mid growth 15%-30% and low growth <15%
High Growth Median: 22.2x
Mid Growth Median: 10.4x
Low Growth Median: 4.8x


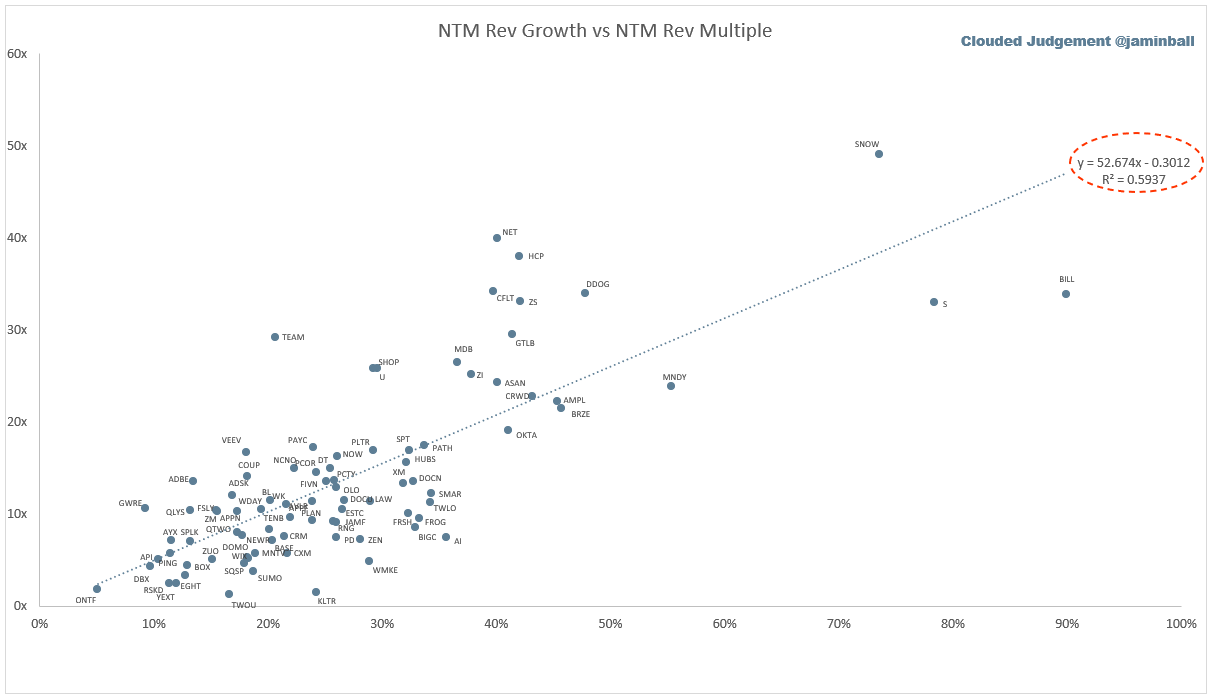
Scatter Plot of EV / NTM Rev Multiple vs NTM Rev Growth
How correlated is growth to valuation multiple?
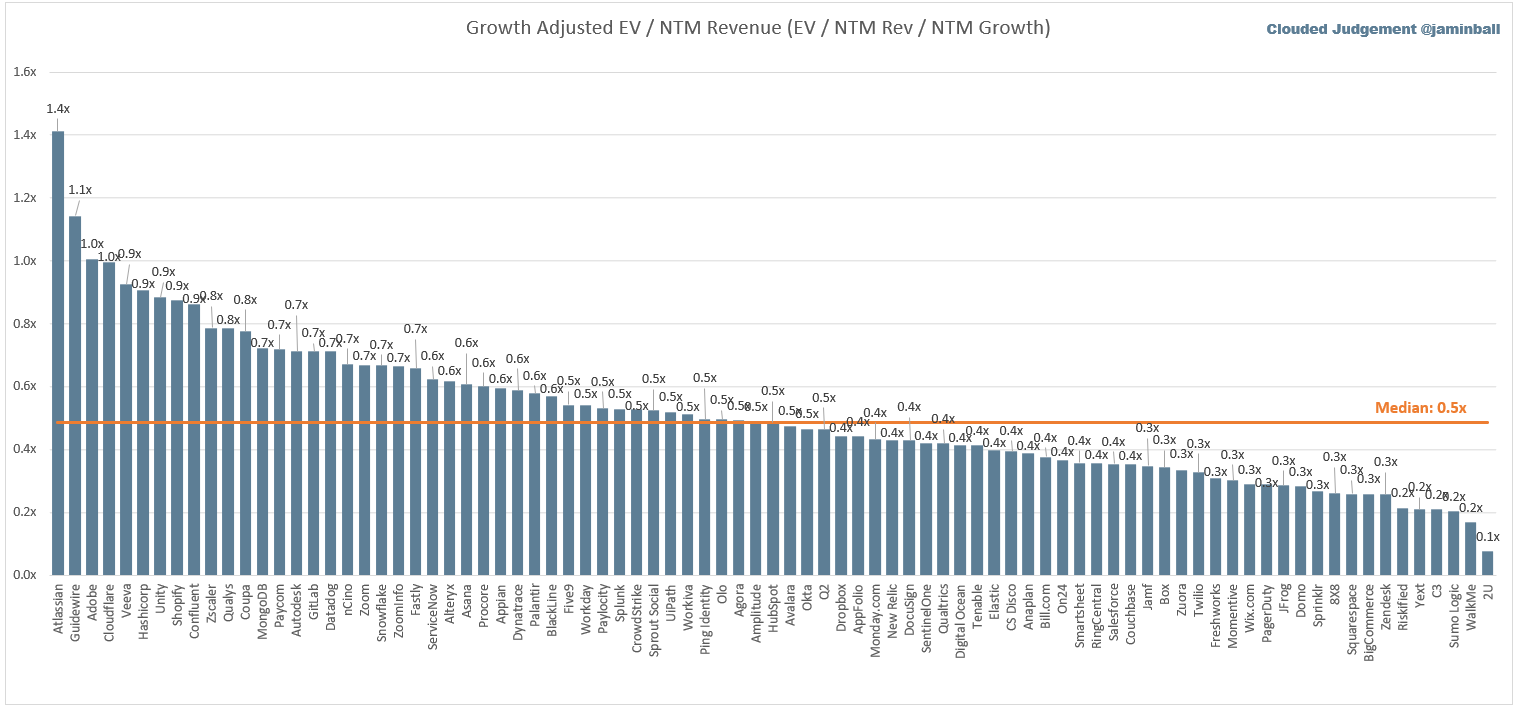
Growth Adjusted EV / NTM Rev
The below chart shows the EV / NTM revenue multiple divided by NTM consensus growth expectations. The goal of this graph is to show how relatively cheap / expensive each stock is relative to their growth expectations
Operating Metrics
Median NTM growth rate: 24%
Median LTM growth rate: 34%
Median Gross Margin: 74%
Median Operating Margin (19%)
Median FCF Margin: 4%
Median Net Retention: 119%
Median CAC Payback: 25 months
Median S&M % Revenue: 44%
Median R&D % Revenue: 26%
Median G&A % Revenue: 19%
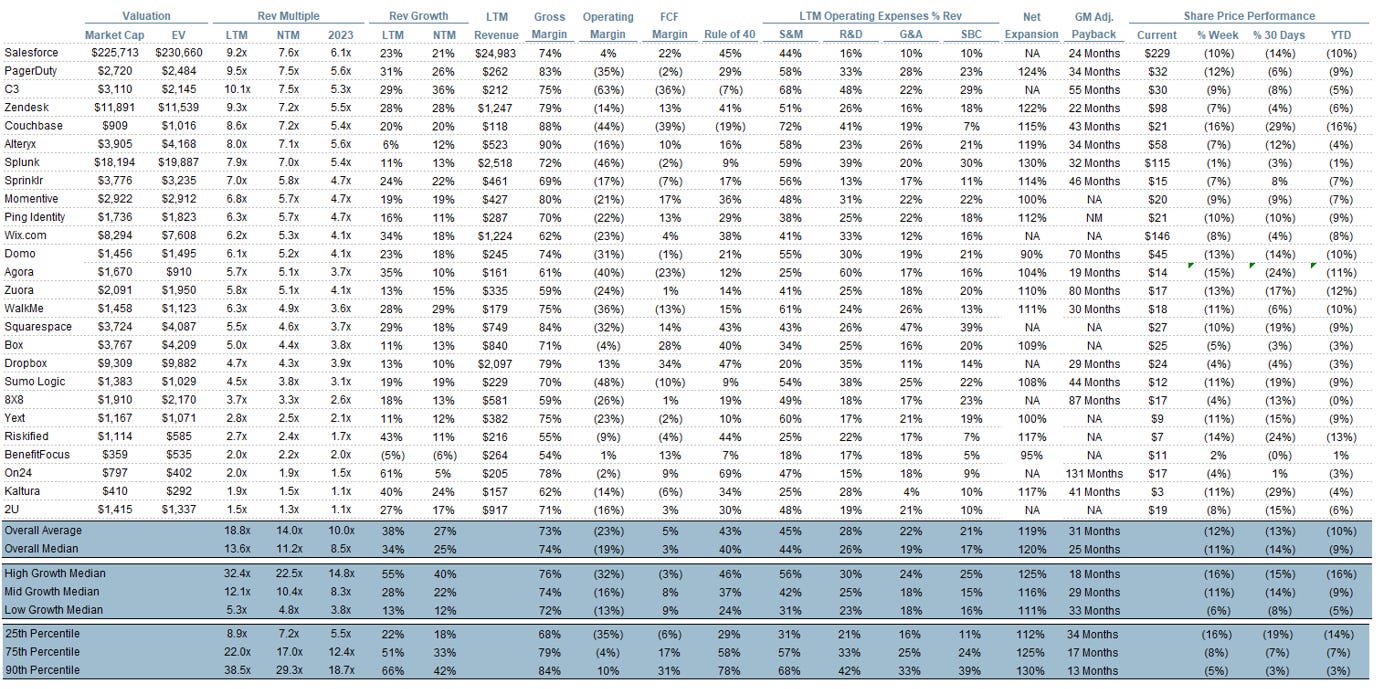
Comps Output
Rule of 40 shows LTM growth rate + LTM FCF Margin. FCF calculated as Cash Flow from Operations - Capital Expenditures
GM Adjusted Payback is calculated as: (Previous Q S&M) / (Net New ARR in Q x Gross Margin) x 12 . It shows the number of months it takes for a SaaS business to payback their fully burdened CAC on a gross profit basis. Most public companies don’t report net new ARR, so I’m taking an implied ARR metric (quarterly subscription revenue x 4). Net new ARR is simply the ARR of the current quarter, minus the ARR of the previous quarter. Companies that do not disclose subscription rev have been left out of the analysis and are listed as NA.


This post and the information presented are intended for informational purposes only. The views expressed herein are the author’s alone and do not constitute an offer to sell, or a recommendation to purchase, or a solicitation of an offer to buy, any security, nor a recommendation for any investment product or service. While certain information contained herein has been obtained from sources believed to be reliable, neither the author nor any of his employers or their affiliates have independently verified this information, and its accuracy and completeness cannot be guaranteed. Accordingly, no representation or warranty, express or implied, is made as to, and no reliance should be placed on, the fairness, accuracy, timeliness or completeness of this information. The author and all employers and their affiliated persons assume no liability for this information and no obligation to update the information or analysis contained herein in the future.
Would love if you could post the bottom mega-chart to download on excel out gsheets. Would be awesome to sort it. Big fan of your work!