Clouded Judgement 2.10.23 - Hard Landing? Soft Landing? No Landing?
Every week I’ll provide updates on the latest trends in cloud software companies. Follow along to stay up to date!
Hard Landing? Soft Landing? No Landing?
There’s a lot of talk about whether we’re headed to a deeper recession (hard landing) or a soft landing (light or no recession). And more recently there’s even talk about “no landing.” These terms get thrown out a lot, so I thought I’d take a step back and loosely define them (for those who hear the words but don’t always know what they mean), and lay out how each outcome may occur.
Hard Landing: This would be a recession. Generally this is thought of as multiple successive quarters of contracting GDP (a shrinking economy). How would this outcome play out? Today, it still seems to be the broader base case. The Fed has hiked rates quite quickly, and the full effects of those hikes (ie demand destruction) has yet to flow through the system. When it does, the outcome will be a shrinking economy due to a big drop-off in demand across the board. The sliver lining is inflation would be squashed. While the Fed has rejected this notion - there is a school of thought that conjectures that in this scenario (a hard landing), the Fed would actually start cutting rates to simulate the economy
Soft Landing: Light or no recession. The Fed keeps talking this up as a possibility. As I wrote about last week no one really believed it coming into the year, and now most acknowledge there’s at least a small probability it happens. In a soft landing, inflation comes down to the 2% target without triggering a recession. The tricky balance here is to get inflation down the Fed has to raise rates. And typically raising rates creates demand destruction that leads to a shrinking economy (recession). Threading the needle would be a scenario where the Fed is able to raise rates enough to bring down inflation, but not high enough to trigger a recession.
No Landing: This is a newer possibility folks are talking about. It would entail a scenario where the labor market remains very strong (ie low unemployment), which leads to wage growth, which leads to inflation staying “sticky” (or even reversing course and going back up), economic growth, and the Fed starting another hiking cycle. There’s no recession in this scenario, but instead higher rates for longer, or even another cycle of hikes. Last week the Fed added fuel to the fire of a potential soft landing. However, last Friday the jobs report came out very strong (which would in theory contradict the possibility of a soft landing, which I’ll get into). The economy added ~500k jobs in January vs expectations of ~200k (a big surprise to the upside!). And the unemployment rate hit the lowest it’s been in decades. Typically a “tight” labor market makes it very hard to fight inflation (the Fed will look at the labor market as a signal to how much room they have to keep hiking rates). Why? Let’s use an example in tech. When the economy is adding jobs, and there are more job openings than job seekers, employees have leverage in comp negotiations. Let’s say you’re an engineer coming out of college - in a tight labor market companies don’t have tons of options to hire folks (because everyone is already employed). This might mean as a new grad you’re debating between job offers from Google, Microsoft and Facebook. All 3 have to compete for your services, which naturally leads to higher salaries being offered. But let’s say unemployment is higher - in this case that new grad might only get one job offer. So there’s no room to negotiate and they “take what they can get.” This doesn’t lead to wage growth / inflation. Wage growth is typically a major factor in supporting inflation. If wages go up, inflation usually follows and consumers can weather the storm of higher prices for goods because their salary went up. So in summary - the tight labor market is an indicator that inflation may not be on a straight-line down to 2%, but instead could get “sticky” and stay at something like 4%, or even start going back up. HOWEVER - while the jobs report was quite strong, wage growth actually DIDN’T go up in a way you’d expect for a such a strong jobs report. You can interpret this in 2 ways. First, if unemployment stays low, wage growth stays moderate, we really could be heading for a soft landing as described above. You could also take the point of view that the wage growth figure was an anomaly, and wage growth will almost certainly start going up leading to stickier inflation and the Fed being forced to decide between hiking more, or at a minimum keeping rates higher for longer. In this scenario a recession (if one happens) would be pushed out much further in the future, hence the “no landing.”
Were 2023 Software Estimates Already De-Risked To Start The Year?
Another topic I’ve discussed at length here is the question of “are forward estimates too high” for software companies. Coming into the year, the consensus seemed to be an earnings recession, meaning forward estimates needed to come down a lot. We’ve seen a number of companies report Q4 ‘22, and then guide for the full year 2023 (first look at 2023 guides, or the companies view on how the year will turn out). So far, full year guides really haven’t been that far below consensus estimates. We’ve gotten data that clearly shows softness in software across the board, but not data that companies expect anything drastic over the full year. So it begs the question, did numbers NOT need to come down from where they were to start the year? The graph below shows how companies have guided for 2023 relative to consensus at the start of the year. I could only do this analysis for companies who’s fiscal year aligns with the calendar year (if not, then the Fiscal 2023 guide might be the 12 months ending June ‘23, vs the full year 2023). Companies that have reported, but who don’t have FY / CY overlap include Dynatrace, Bill, Atlassian, New Relic and a few others.
Cloudflare Quarter
I thought Cloudflare was a good representation of the type of earnings report that gets a positive reaction in this market. They reported Q4 ‘22 which came in almost exactly at consensus. Then they guided Q1 ‘23 to 0.5% below consensus. Just looking at those two figures, you’d think the stock would trade down. However, it was up >10% after hours on Thursday (I’m writing this Thursday night, so we’ll see how it trades Friday). The primary reason (I think)? They guided 2023 1% above consensus. As I described above, the fear coming into the year was that 2023 estimates were way too high. The market had priced in downward earnings revisions. But what a quarter like Cloudflare’s showed us is that if you guide in line with 2023 consensus, that’s a lot “better than feared” and shows the roof isn’t on fire. Those reports are getting bought, even though it’s pretty clear Q1 will be tough. Time will tell if the 2023 guide was optimistic.
Quarterly Reports Summary
Top 10 EV / NTM Revenue Multiples
I’ve added another column at the end that shows over the last year how often each company showed up in the top 10
Top 10 Weekly Share Price Movement
Update on Multiples
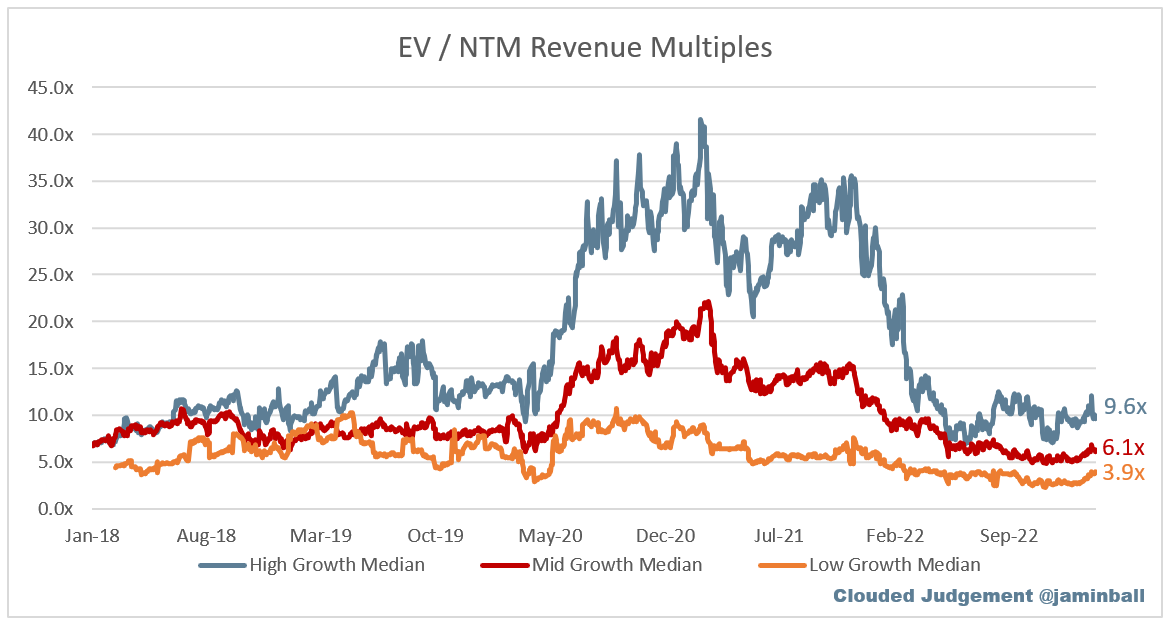
SaaS businesses are generally valued on a multiple of their revenue - in most cases the projected revenue for the next 12 months. Revenue multiples are a shorthand valuation framework. Given most software companies are not profitable, or not generating meaningful FCF, it’s the only metric to compare the entire industry against. Even a DCF is riddled with long term assumptions. The promise of SaaS is that growth in the early years leads to profits in the mature years. Multiples shown below are calculated by taking the Enterprise Value (market cap + debt - cash) / NTM revenue.
Overall Stats:
Overall Median: 5.9x
Top 5 Median: 12.6x
10Y: 3.6%
Bucketed by Growth. In the buckets below I consider high growth >30% projected NTM growth, mid growth 15%-30% and low growth <15%
High Growth Median: 9.6x
Mid Growth Median: 6.1x
Low Growth Median: 3.9x
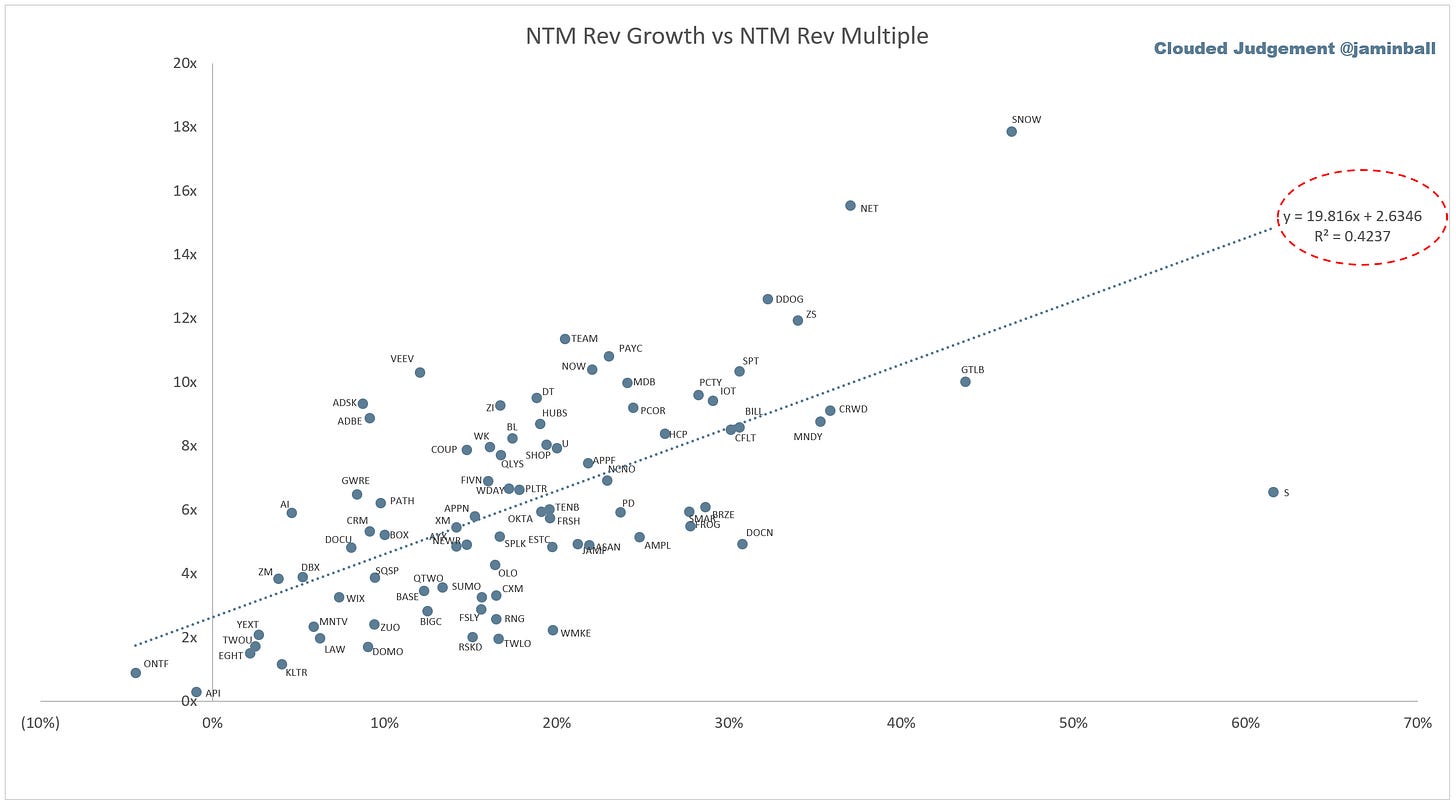
Scatter Plot of EV / NTM Rev Multiple vs NTM Rev Growth
How correlated is growth to valuation multiple?
Growth Adjusted EV / NTM Rev
The below chart shows the EV / NTM revenue multiple divided by NTM consensus growth expectations. The goal of this graph is to show how relatively cheap / expensive each stock is relative to their growth expectations
Operating Metrics
Median NTM growth rate: 17%
Median LTM growth rate: 29%
Median Gross Margin: 74%
Median Operating Margin (25%)
Median FCF Margin: 0%
Median Net Retention: 119%
Median CAC Payback: 38 months
Median S&M % Revenue: 48%
Median R&D % Revenue: 28%
Median G&A % Revenue: 20%
Comps Output
Rule of 40 shows LTM growth rate + LTM FCF Margin. FCF calculated as Cash Flow from Operations - Capital Expenditures
GM Adjusted Payback is calculated as: (Previous Q S&M) / (Net New ARR in Q x Gross Margin) x 12 . It shows the number of months it takes for a SaaS business to payback their fully burdened CAC on a gross profit basis. Most public companies don’t report net new ARR, so I’m taking an implied ARR metric (quarterly subscription revenue x 4). Net new ARR is simply the ARR of the current quarter, minus the ARR of the previous quarter. Companies that do not disclose subscription rev have been left out of the analysis and are listed as NA.
This post and the information presented are intended for informational purposes only. The views expressed herein are the author’s alone and do not constitute an offer to sell, or a recommendation to purchase, or a solicitation of an offer to buy, any security, nor a recommendation for any investment product or service. While certain information contained herein has been obtained from sources believed to be reliable, neither the author nor any of his employers or their affiliates have independently verified this information, and its accuracy and completeness cannot be guaranteed. Accordingly, no representation or warranty, express or implied, is made as to, and no reliance should be placed on, the fairness, accuracy, timeliness or completeness of this information. The author and all employers and their affiliated persons assume no liability for this information and no obligation to update the information or analysis contained herein in the future.


Appreciate the data