Clouded Judgement 2.11.22
Every week I’ll provide updates on the latest trends in cloud software companies. Follow along to stay up to date!
Inflation…Rate Hikes…Recession? What Does It Mean For Cloud Software?
Another very interesting week for cloud software companies. Many people are wondering if we’ve hit the bottom of the cloud software drawdown. It’s a very hard question to answer, but we may have gotten a clue this week. As I’ve talked about before, valuations and multiples of risk assets like cloud software stocks are tied to interest rates. During Covid, we saw the government pump trillions of dollars into the economy and take rates to zero. This drove unprecedented levels of capital flows into cloud software stocks, driving multiples up. There was also an element of cloud penetration accelerating, but the bulk of the move was driven by the Fed and macro policy. Recently, the Fed has signaled a number of rate hikes for this year. The market expects rates to go up, and in turn capital flows moved out of risk assets and growth software stocks fell. However - the unanswered question is exactly how much will rates go up in 2022? The initial expectation was 4-5 hikes of 25bps each. Now, this doesn’t mean the market was pricing this in. The market is a weighing machine which may expect more than this.
One important aside - raising interest rates is generally fiscal policy used to fight rising inflation. So to the extent inflation stays out of control, the Fed can choose to increase rates to stop inflation.
We saw something very interesting yesterday - CPI (a measure of inflation) data came out yesterday, and it was quite high (7.5% in Jan). This was the highest it’s been since the 80’s!
And what comes with out of control inflation? Increased rates. Immediately the tone around future rate hikes changed. The 10 year hit 2% for the first time since 2019. The market moved to expect a 50bps rate hike in March (up from previous expected 25bps), and a full percentage point increase by July. The expectations around rate hikes went up! However - something really interesting happened - cloud software stocks ripped higher! This didn’t last, and the WCLD ETF ended slightly down on the day (but not by much, <1%). The overall cloud software market didn’t move much on what should have been quite significant negative news.
What does this tell me? The market had already priced in a larger increase in rate hikes. Now, my personal view is most software stocks are currently swinging up or down based purely on macro policy. Fed signals rate hikes — software stocks fall. So, the primary reason software stocks might fall again in the near term (meaning we haven’t yet hit the bottom) would be even higher expectations for increased rates (then where we sit after Jan CPI data).
The key question for “have we hit the bottom” is - do we expect even more rate hikes than what is currently priced in after today’s CPI print? I believe the answer is no. Why? Two primary reasons:
I think inflation gets under control in the back half of the year. Throughout Covid the government sent out massive stimulus packages. But with everything shut down, people couldn’t spend that money on vacations, sporting event tickets, or other areas of discretionary spend. Instead, they spent those dollars on goods driving up inflation. As stimulus programs end, this effect goes away
Most importantly - The only way for the market to absorb quick rate hikes is if economic growth is surging. Combining rate hikes with slowing economic growth results in recession. This is worst case scenario. My personal view is economic growth won’t be very strong this year, which hamstrings the fed a bit. I don’t think they increase rates more than what expectations are currently (1% by July) because doing this could swing the pendulum of the economy into a recession (just my opinion, that’s not a sure thing by any means!)
So net net - my views are inflation reigns in back half of the year, and the Fed won’t risk raising rates significantly more than what’s projected, meaning we’ve most likely hit the bottom (or close to it) for cloud software. The key part of this assumption is that the market had already priced in a more aggressive Fed, and we saw some evidence of this yesterday when cloud stocks remained relatively unchanged when the expectation for rate hikes went up significantly. Doesn’t mean we’ll have swings back and forth, but for the most part I think the cloud software market won’t have much room to keep declining. Time will tell if this prediction proves accurate! We’re still in the middle of earnings season, so lots of volatility is expected through March.
Now on to the regularly scheduled programming:
Quarterly Reports Summary
Top 10 EV / NTM Revenue Multiples
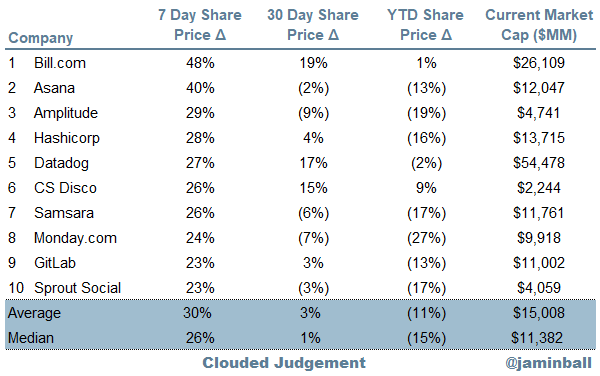
Top 10 Weekly Share Price Movement
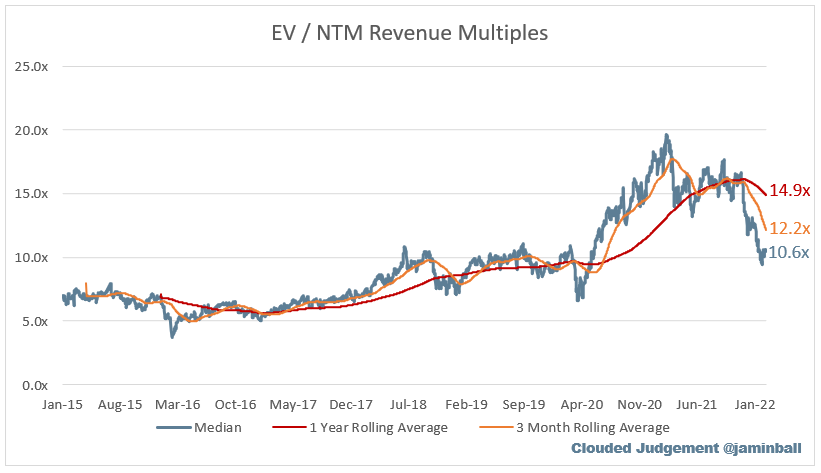
Update on Multiples
SaaS businesses are valued on a multiple of their revenue - in most cases the projected revenue for the next 12 months. Multiples shown below are calculated by taking the Enterprise Value (market cap + debt - cash) / NTM revenue.
Overall Stats:
Overall Median: 10.6x
Top 5 Median: 38.8x
3 Month Trailing Average: 14.9x
1 Year Trailing Average: 12.2x
Bucketed by Growth. In the buckets below I consider high growth >30% projected NTM growth, mid growth 15%-30% and low growth <15%
High Growth Median: 21.0x
Mid Growth Median: 13.8x
Low Growth Median: 7.1x
Scatter Plot of EV / NTM Rev Multiple vs NTM Rev Growth
How correlated is growth to valuation multiple?
Growth Adjusted EV / NTM Rev
The below chart shows the EV / NTM revenue multiple divided by NTM consensus growth expectations. The goal of this graph is to show how relatively cheap / expensive each stock is relative to their growth expectations
Operating Metrics
Median NTM growth rate: 24%
Median LTM growth rate: 34%
Median Gross Margin: 74%
Median Operating Margin (19%)
Median FCF Margin: 4%
Median Net Retention: 119%
Median CAC Payback: 25 months
Median S&M % Revenue: 44%
Median R&D % Revenue: 26%
Median G&A % Revenue: 19%
Comps Output
Rule of 40 shows LTM growth rate + LTM FCF Margin. FCF calculated as Cash Flow from Operations - Capital Expenditures
GM Adjusted Payback is calculated as: (Previous Q S&M) / (Net New ARR in Q x Gross Margin) x 12 . It shows the number of months it takes for a SaaS business to payback their fully burdened CAC on a gross profit basis. Most public companies don’t report net new ARR, so I’m taking an implied ARR metric (quarterly subscription revenue x 4). Net new ARR is simply the ARR of the current quarter, minus the ARR of the previous quarter. Companies that do not disclose subscription rev have been left out of the analysis and are listed as NA.
This post and the information presented are intended for informational purposes only. The views expressed herein are the author’s alone and do not constitute an offer to sell, or a recommendation to purchase, or a solicitation of an offer to buy, any security, nor a recommendation for any investment product or service. While certain information contained herein has been obtained from sources believed to be reliable, neither the author nor any of his employers or their affiliates have independently verified this information, and its accuracy and completeness cannot be guaranteed. Accordingly, no representation or warranty, express or implied, is made as to, and no reliance should be placed on, the fairness, accuracy, timeliness or completeness of this information. The author and all employers and their affiliated persons assume no liability for this information and no obligation to update the information or analysis contained herein in the future.


Hi JB, Great work you are doing. Your comments and data organization simplifies investment decisions for me.
Is there a way to get downloadable or at least sortable versions of your spread sheets.
Thanks, John
Hi! What do you think about Livechat Software (from Central Europe)?