
Clouded Judgement 2.13.26 - Build vs Buy

Every week I’ll provide updates on the latest trends in cloud software companies. Follow along to stay up to date!
Build vs Buy
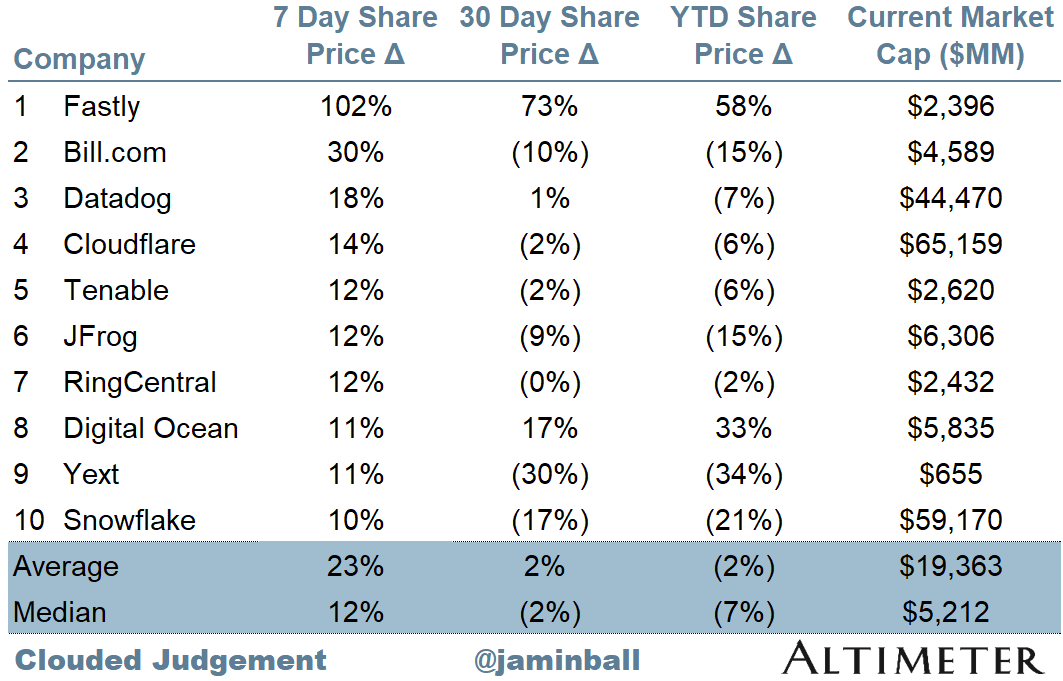
Another week and software continues to grind lower. However, despite all of the carnage, there was another big winner this week! Fastly is up ~100% over the last week. The week prior, 8x8 had the big week (they were up ~70% in a week). Always an opportunity somewhere…
I thought I was done talking about “is software dead” after the last couple weeks Clouded Judgement posts, but I just had more thoughts I wanted to share… I think two things are true. I think people are simultaneously under and over estimating the impact AI will have on the existing software complex. The difference is the timing. Overestimating in the short term, and underestimating in the long term.
I see a lot of arguments claiming software is dead because everyone will just vibe code their own software. I don’t buy this at all… This is really just another iteration of the “build vs buy” debate. Historically, people have chosen not to build internal tools for a few reasons:
Total cost of ownership: Internal software looks “free” until you account for maintenance, infrastructure, support, upgrades, and opportunity cost of diverted talent.
Speed to market: Vendors were already built and production ready. Internal builds often took quarters or years, especially once edge cases surfaced.
Focus on core differentiation: Engineering time is scarce. Companies preferred to spend it on what made them unique, not rebuilding commoditized infrastructure or applications.
Ongoing maintenance and technical debt: Software is never done. Security patches, compliance updates, performance tuning, and feature requests turn into permanent internal burden.
Economies of scale and feature velocity: Vendors amortize R&D across thousands of customers and ship improvements continuously. A single company rarely matches that pace.
Reliability, security, and compliance expertise: Enterprise grade uptime, SOC2, GDPR, industry regulations, audit logs, monitoring. Vendors build teams around this. Internal projects often underinvest until something breaks.
Now, being able to “vibe code” certainly eliminates some of the historical challenges of building your own software. But a lot remains…We can’t underestimate how good vibe coding will get, but I don’t think it changes the overall viewpoint on build vs buy.
However - I think there is a different (but very related) reason that software is challenged. The cost of creating software is going to zero. The risk isn’t that someone will vibe code a internal CRM replacement…The risk is that 10 companies could now create a new CRM, from the ground up, built for a new end user in mind (agents vs people), with a business model for the AI world (consumption / usage vs seats), and now all of a sudden the market is flooded with offerings and the legacy space commoditizes.
This, to me, is the real risk. Software broadly commoditizes, with a new crop of software / value emerging. A big constraint to the development of software is engineering resources. Before the cloud, a constraint was how quickly could you stand up racks of servers to support user growth. In the cloud era that was commoditized, and engineering resources became the constraining factor (how quickly could you develop software). With AI, that constraining resource (engineering velocity) is going away.
So what happens from here…The world is about to be flooded with software. For companies that can’t innovate and capture this next S-Curve of innovation, they will slowly fade to irrelevance. The will be valued as companies in a post-growth industry, and receive a post-growth valuation multiple (see ya revenue multiples…). For those who can, a new vector of growth lays ahead of them.
I’ll end this weeks post with (hopefully) two final anecdotes about the topic of “is software dead.”
First - when looking for examples of historical “major disruption” periods, one many people point to was the iPhone. The first iPhone came out in 2007. In that year, Nokia had a market share of ~40%. They were the king. Well, we all know what happened from there. Apple became one of the most dominant tech companies in history. However, it might surprise people that Nokia still has a ~$40b market cap today. Far from dead! This is down from ~$150b in 2007 (and they’ve had to re-invent themselves). The point is, despite Apple seemingly “killing” them, they never fully died.
Second - the market will typically discount stocks facing major disruption potential far before earnings are impacted (ie before the disruption shows up in the numbers). If we bring this back to the “is software dead” conversation, many are pointing to the recent Q4 earnings reports (we’re in the middle of earnings season right now) as “evidence” that AI isn’t eating software. For the most part, earnings have been good! Retention figures don’t seem to show any sign of cracking. However, I found an awesome graphic floating around X this week (copied below). It showed an index of newspaper companies stock performance and earnings over time (starting in 2002). What you’ll see, is the voting machine of the market saw the disruption coming from the internet, and started to discount the newspaper stocks right away. From 2002 to 2009 those stocks basically went down in a straight line. However, if you look at earnings estimates for that same set of companies, they actually grew for about 5 straight years! During that time, the stocks continued to drop. It wasn’t until 2007 when the earnings really started to get disrupted. Earnings then fell off a cliff. All of this to say - don’t take too much comfort in the short term quarterly results :) Disruption generally takes a bit longer
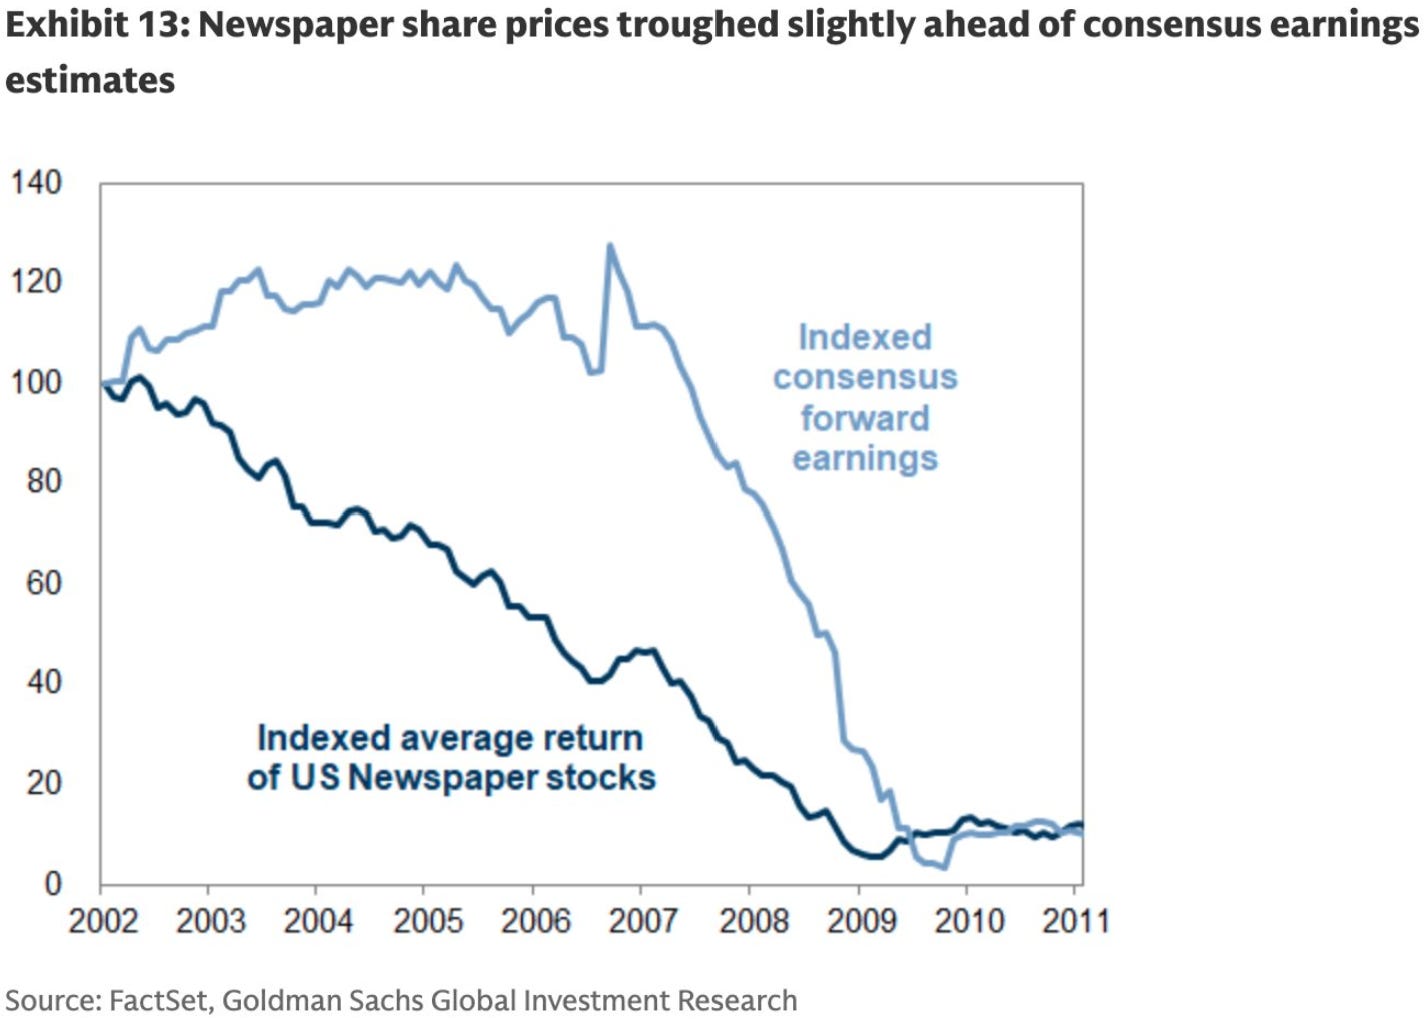
Of course, there is so much different when comparing the newspaper industry in 2002 to the software industry in 2026…. First - back then legacy newspaper players were slow to adapt. Today, legacy software companies are embracing AI rapidly. Second, newspapers lost their entire core business (print ads) to zero-cost alternatives. Software disruption via AI is more nuanced: I believe the downside is more about trimming growth rates, not erasing demand completely. Third, newspapers were low-barrier commodities (anyone could print and distribute) with fragmented markets and razor-thin margins once ads fled. Software has more network effects, data moats, and higher switching costs. There are many other differences, these were just a few call outs.
There’s a lot that’s quite different about the disruption newspapers faced vs what software companies are facing today. However, the point that could be similar - short term performance may not be the “sign of safety” we think. Software is more likely to die a slow death than an instant one. The threat AI poses is very real (one of biggest risks I wrote about a few weeks back). Most companies face a real commoditization risk as the cost of creating software craters. Only some will capture the next tailwind. At the end of the day, most “AI companies” are really “software companies",” so really the important question is how has a path for durable predictable growth into the future.
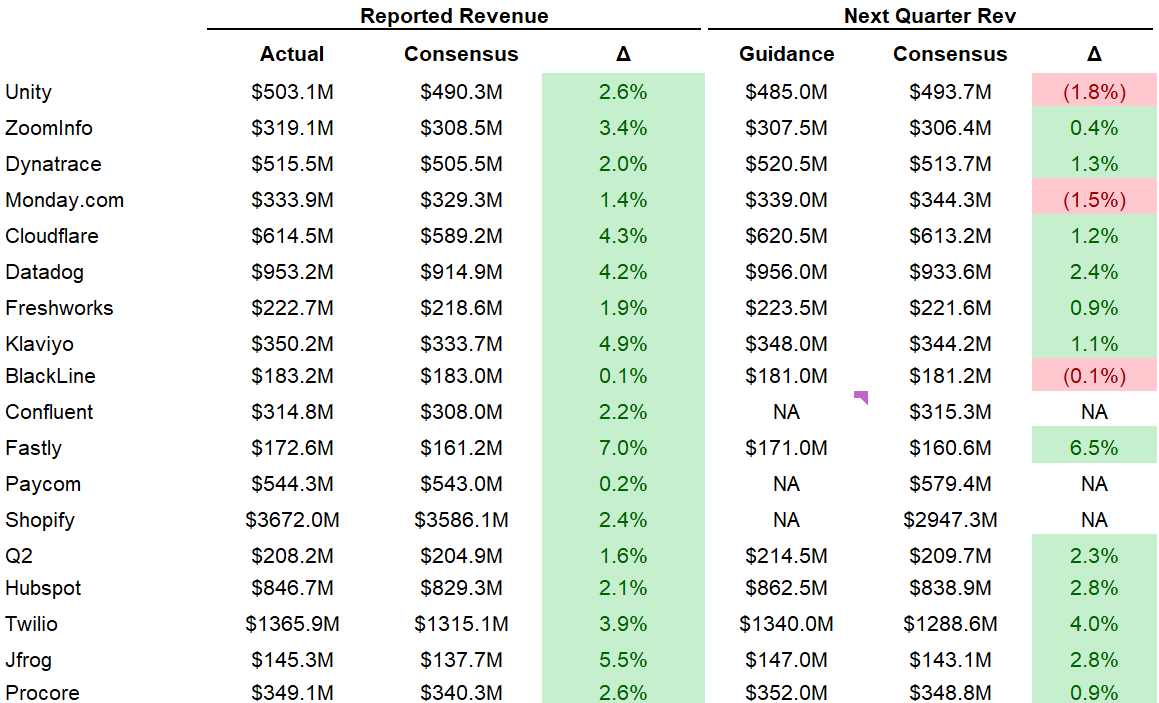
Quarterly Reports Summary
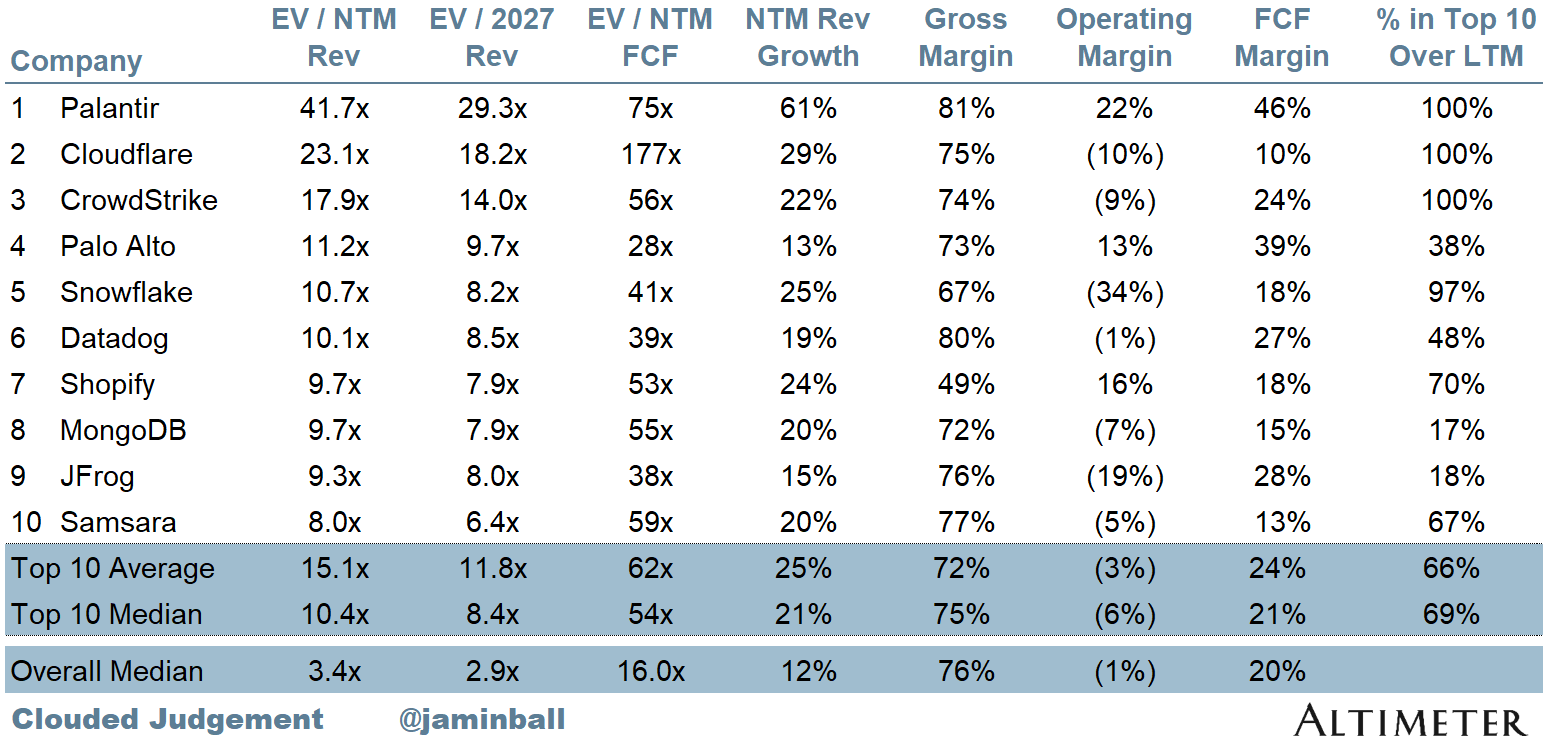
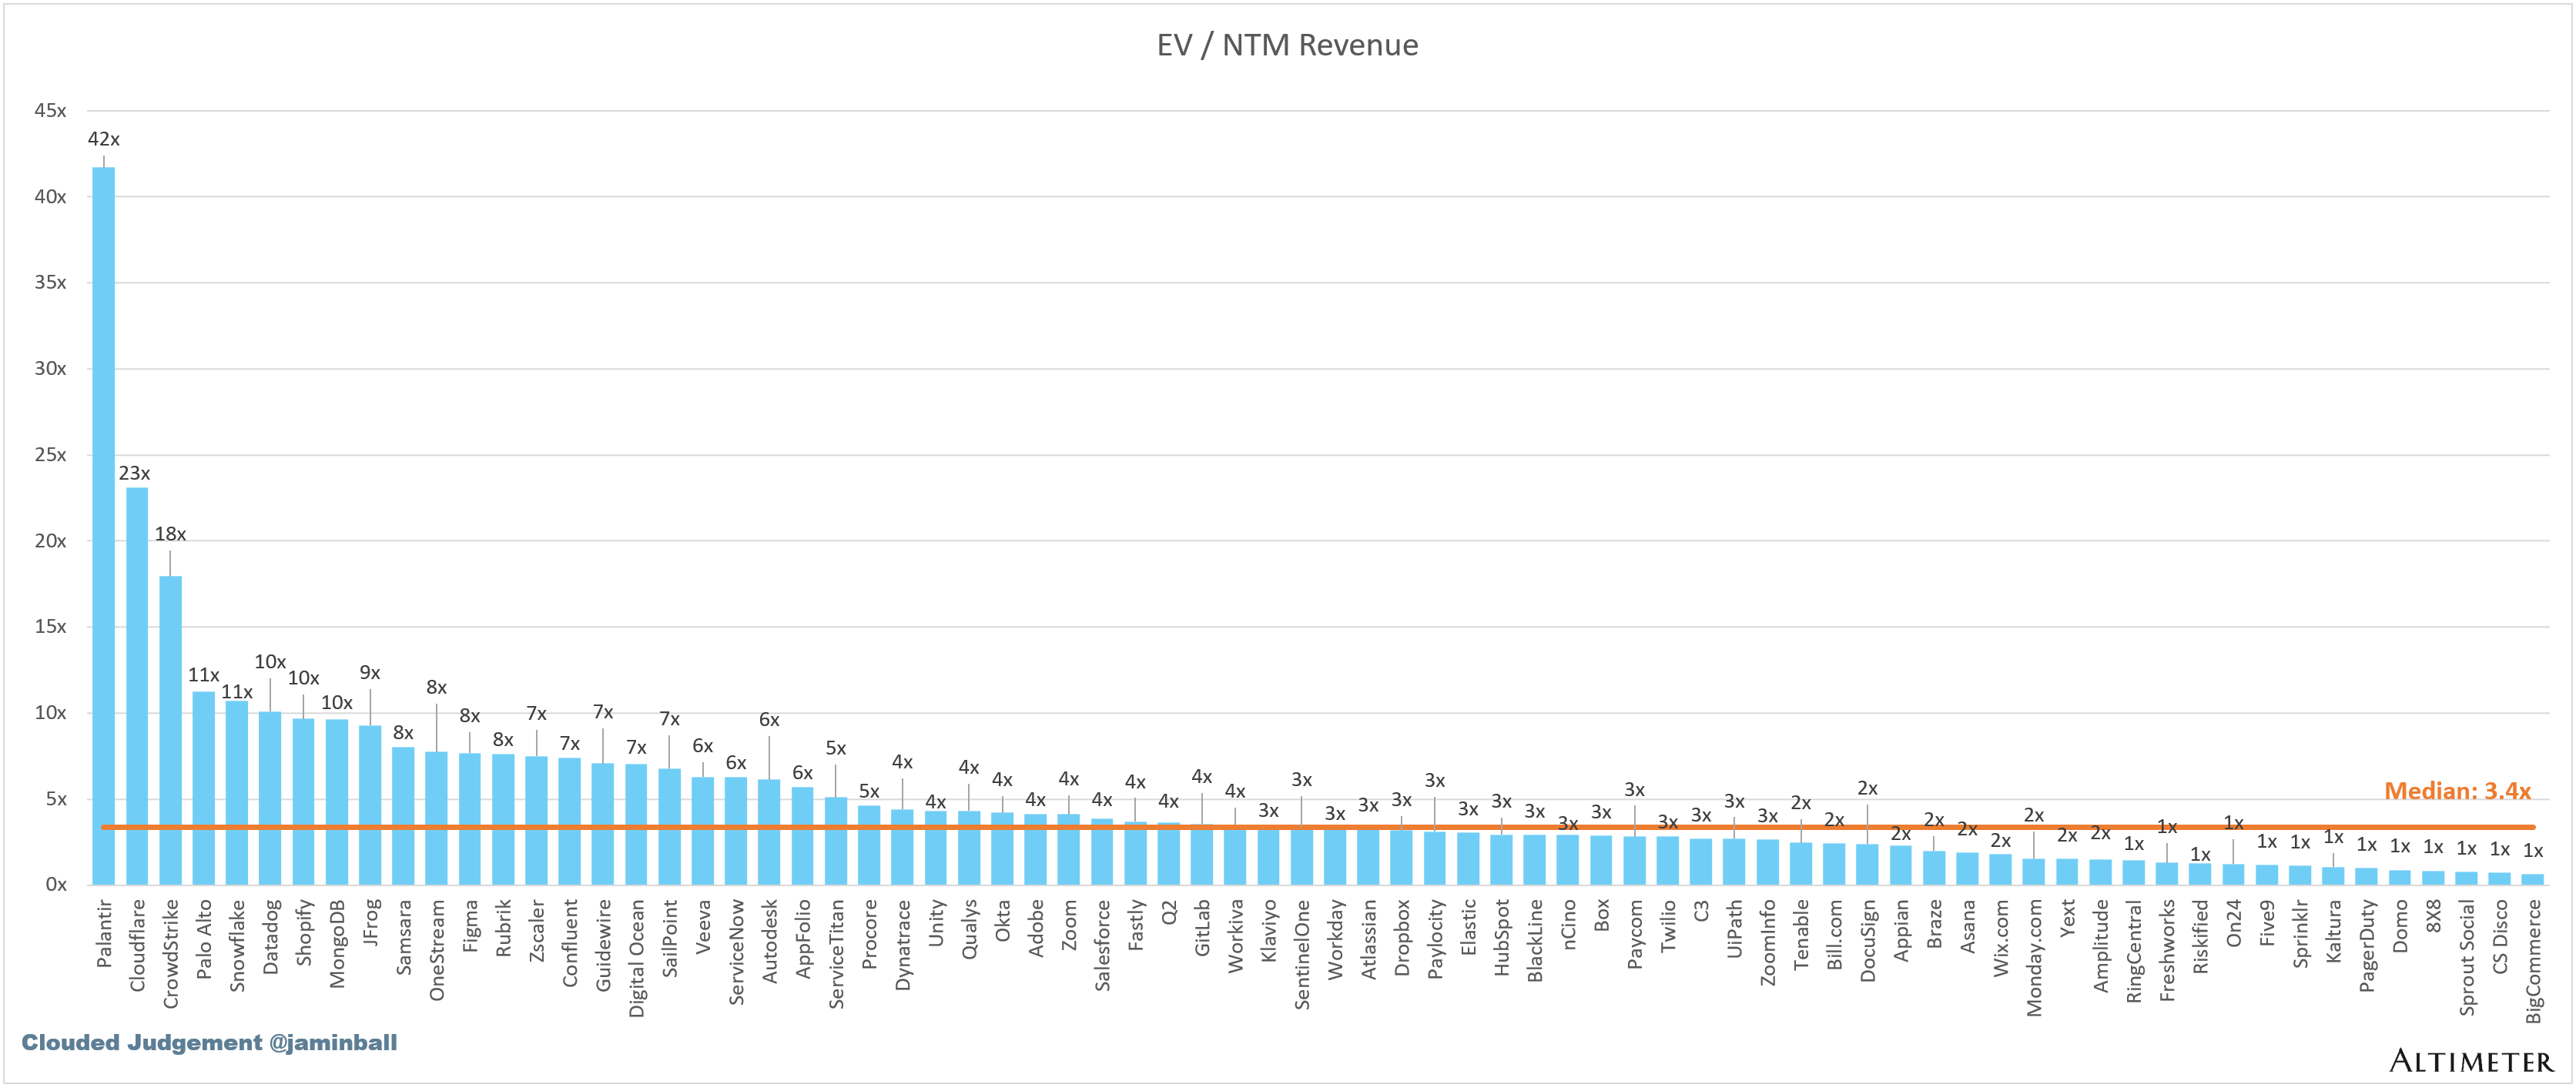
Top 10 EV / NTM Revenue Multiples
Top 10 Weekly Share Price Movement
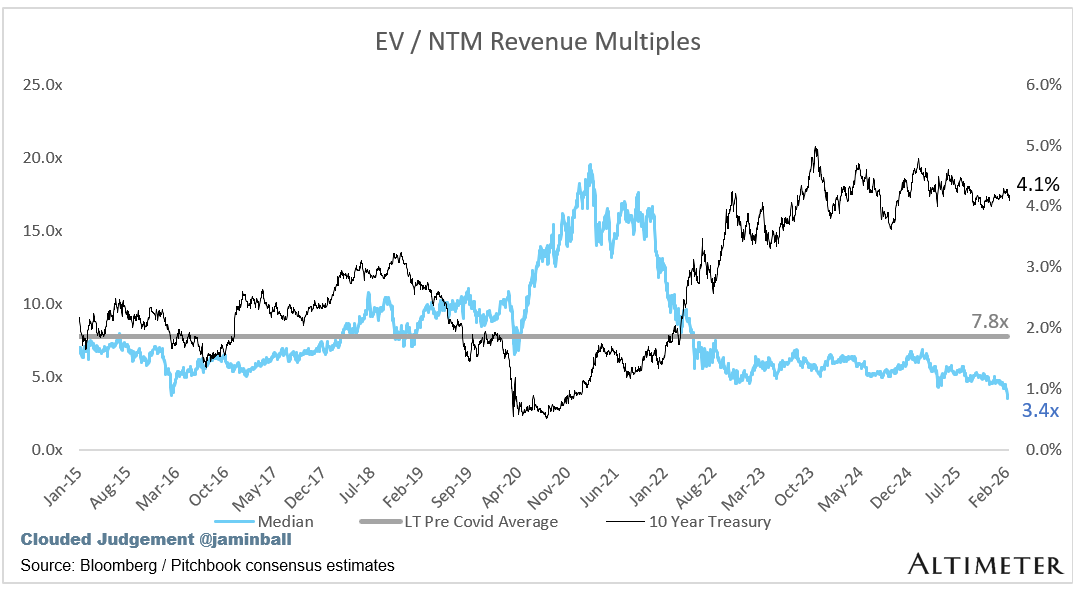
Update on Multiples
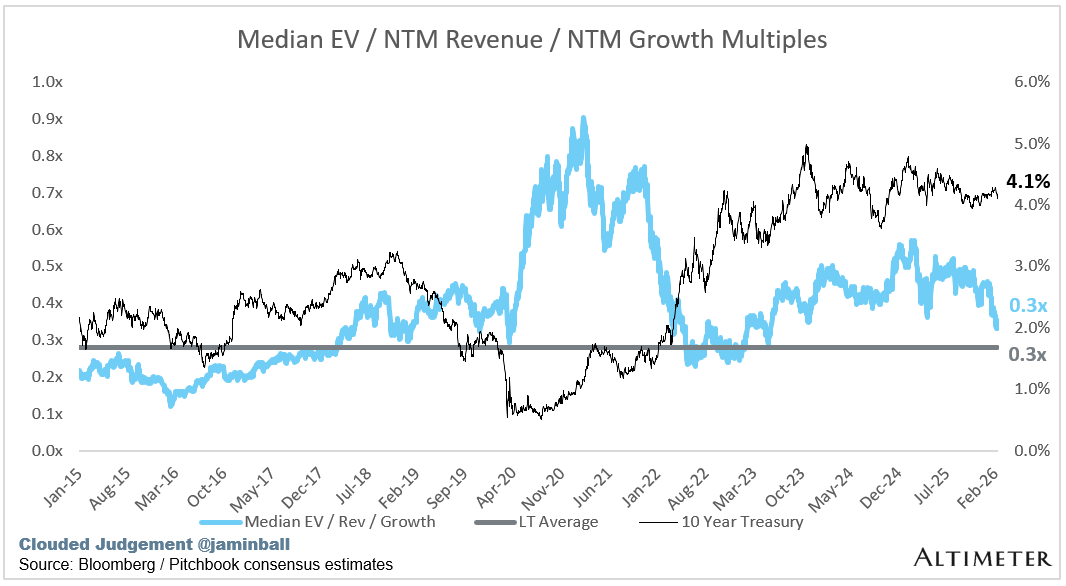
SaaS businesses are generally valued on a multiple of their revenue - in most cases the projected revenue for the next 12 months. Revenue multiples are a shorthand valuation framework. Given most software companies are not profitable, or not generating meaningful FCF, it’s the only metric to compare the entire industry against. Even a DCF is riddled with long term assumptions. The promise of SaaS is that growth in the early years leads to profits in the mature years. Multiples shown below are calculated by taking the Enterprise Value (market cap + debt - cash) / NTM revenue.
Overall Stats:
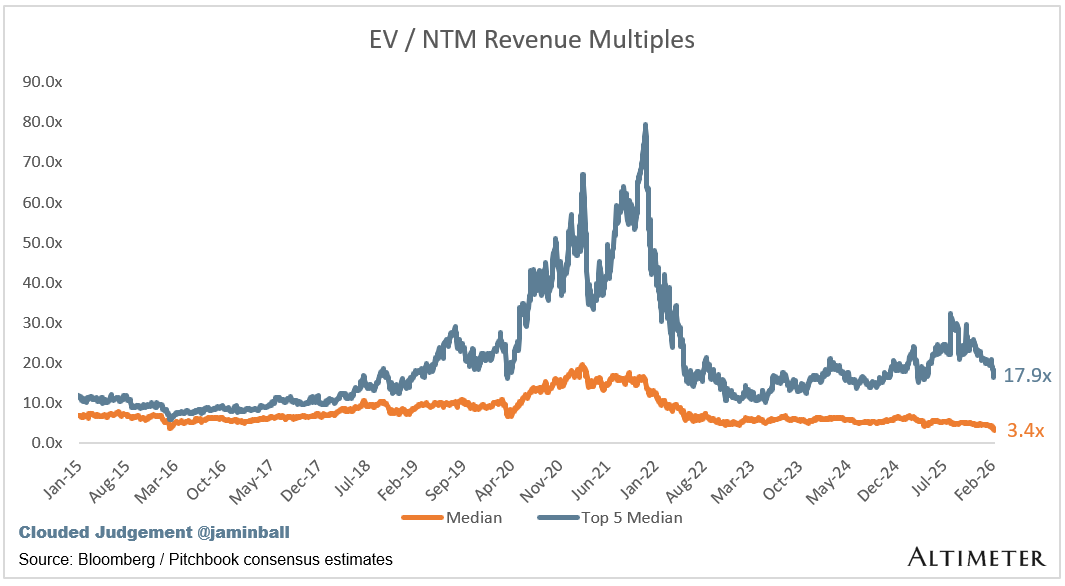
Overall Median: 3.4x
Top 5 Median: 17.9x
10Y: 4.1%
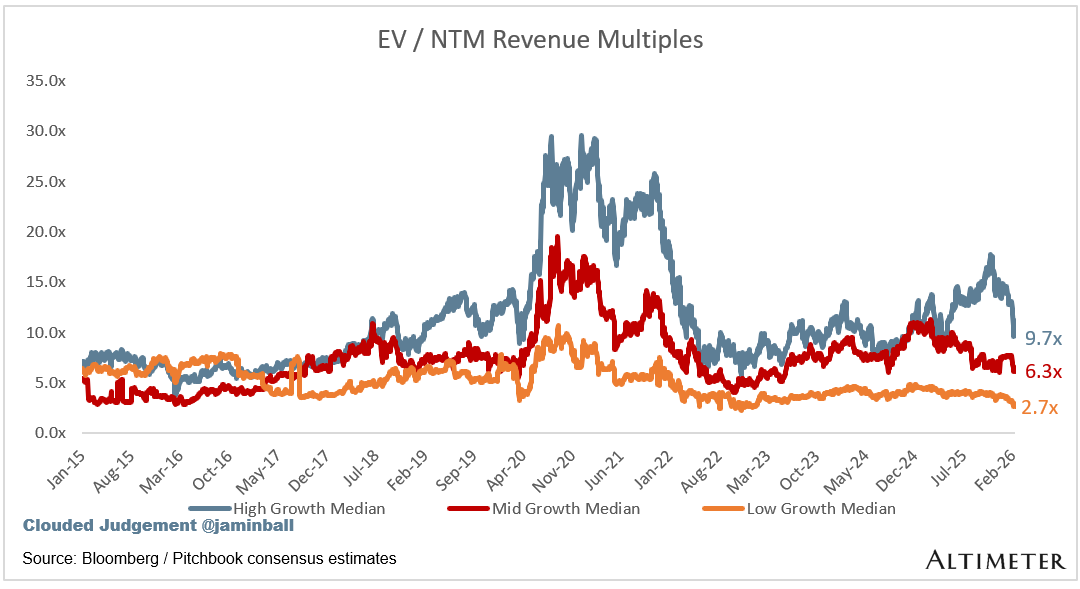
Bucketed by Growth. In the buckets below I consider high growth >22% projected NTM growth, mid growth 15%-22% and low growth <15%. I had to adjusted the cut off for “high growth.” If 22% feels a bit arbitrary, it’s because it is…I just picked a cutoff where there were ~10 companies that fit into the high growth bucket so the sample size was more statistically significant
High Growth Median: 9.7x
Mid Growth Median: 6.3x
Low Growth Median: 2.7x
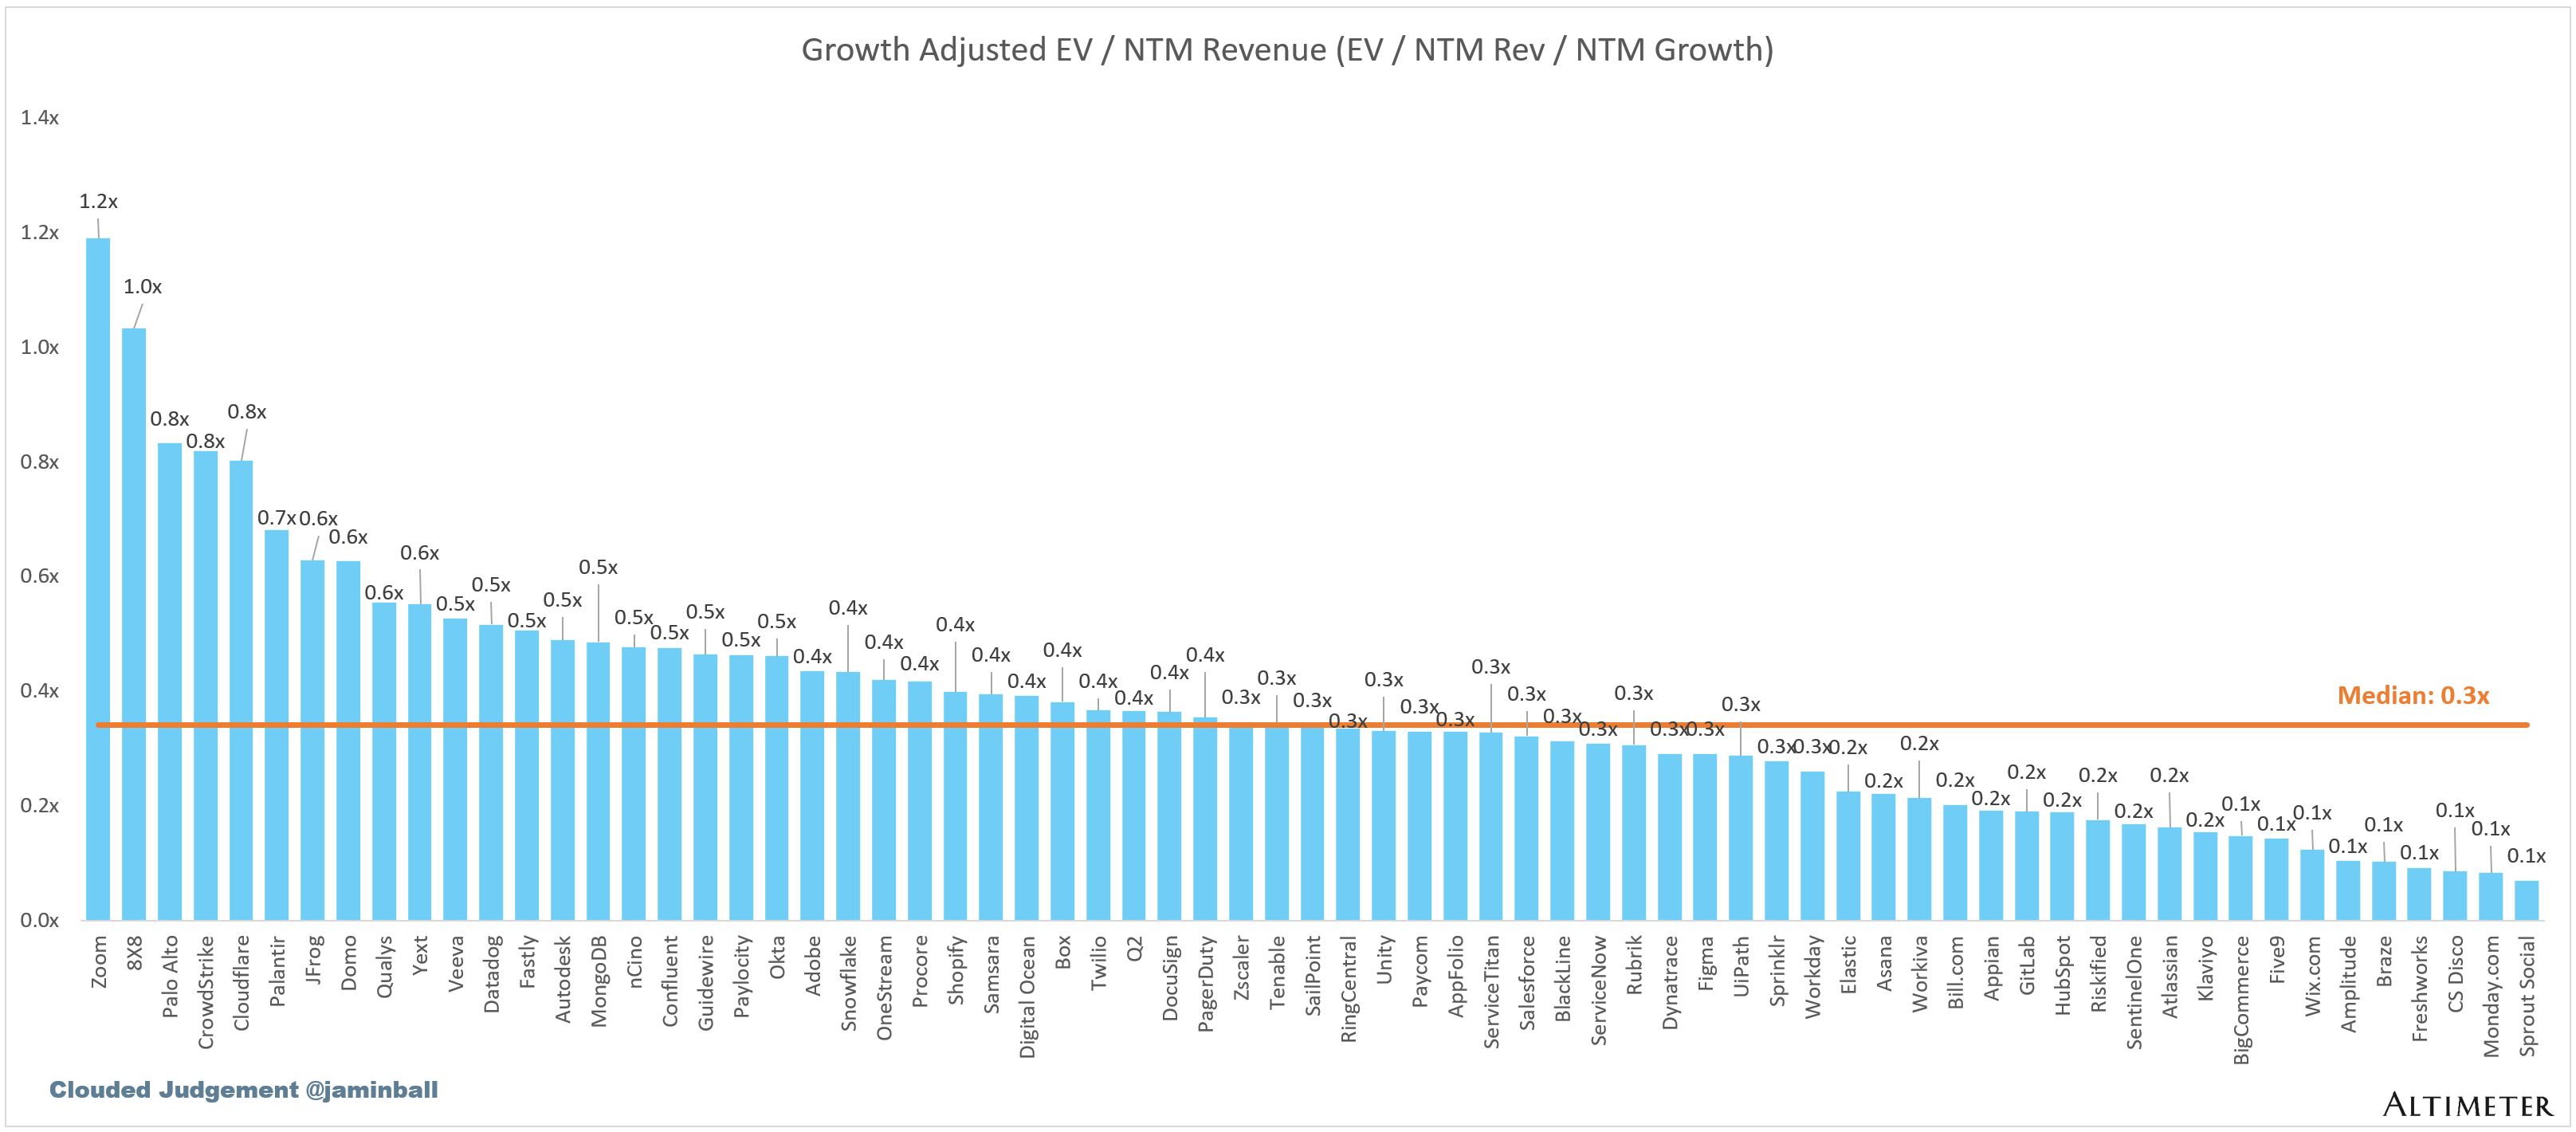
EV / NTM Rev / NTM Growth
The below chart shows the EV / NTM revenue multiple divided by NTM consensus growth expectations. So a company trading at 20x NTM revenue that is projected to grow 100% would be trading at 0.2x. The goal of this graph is to show how relatively cheap / expensive each stock is relative to its growth expectations.
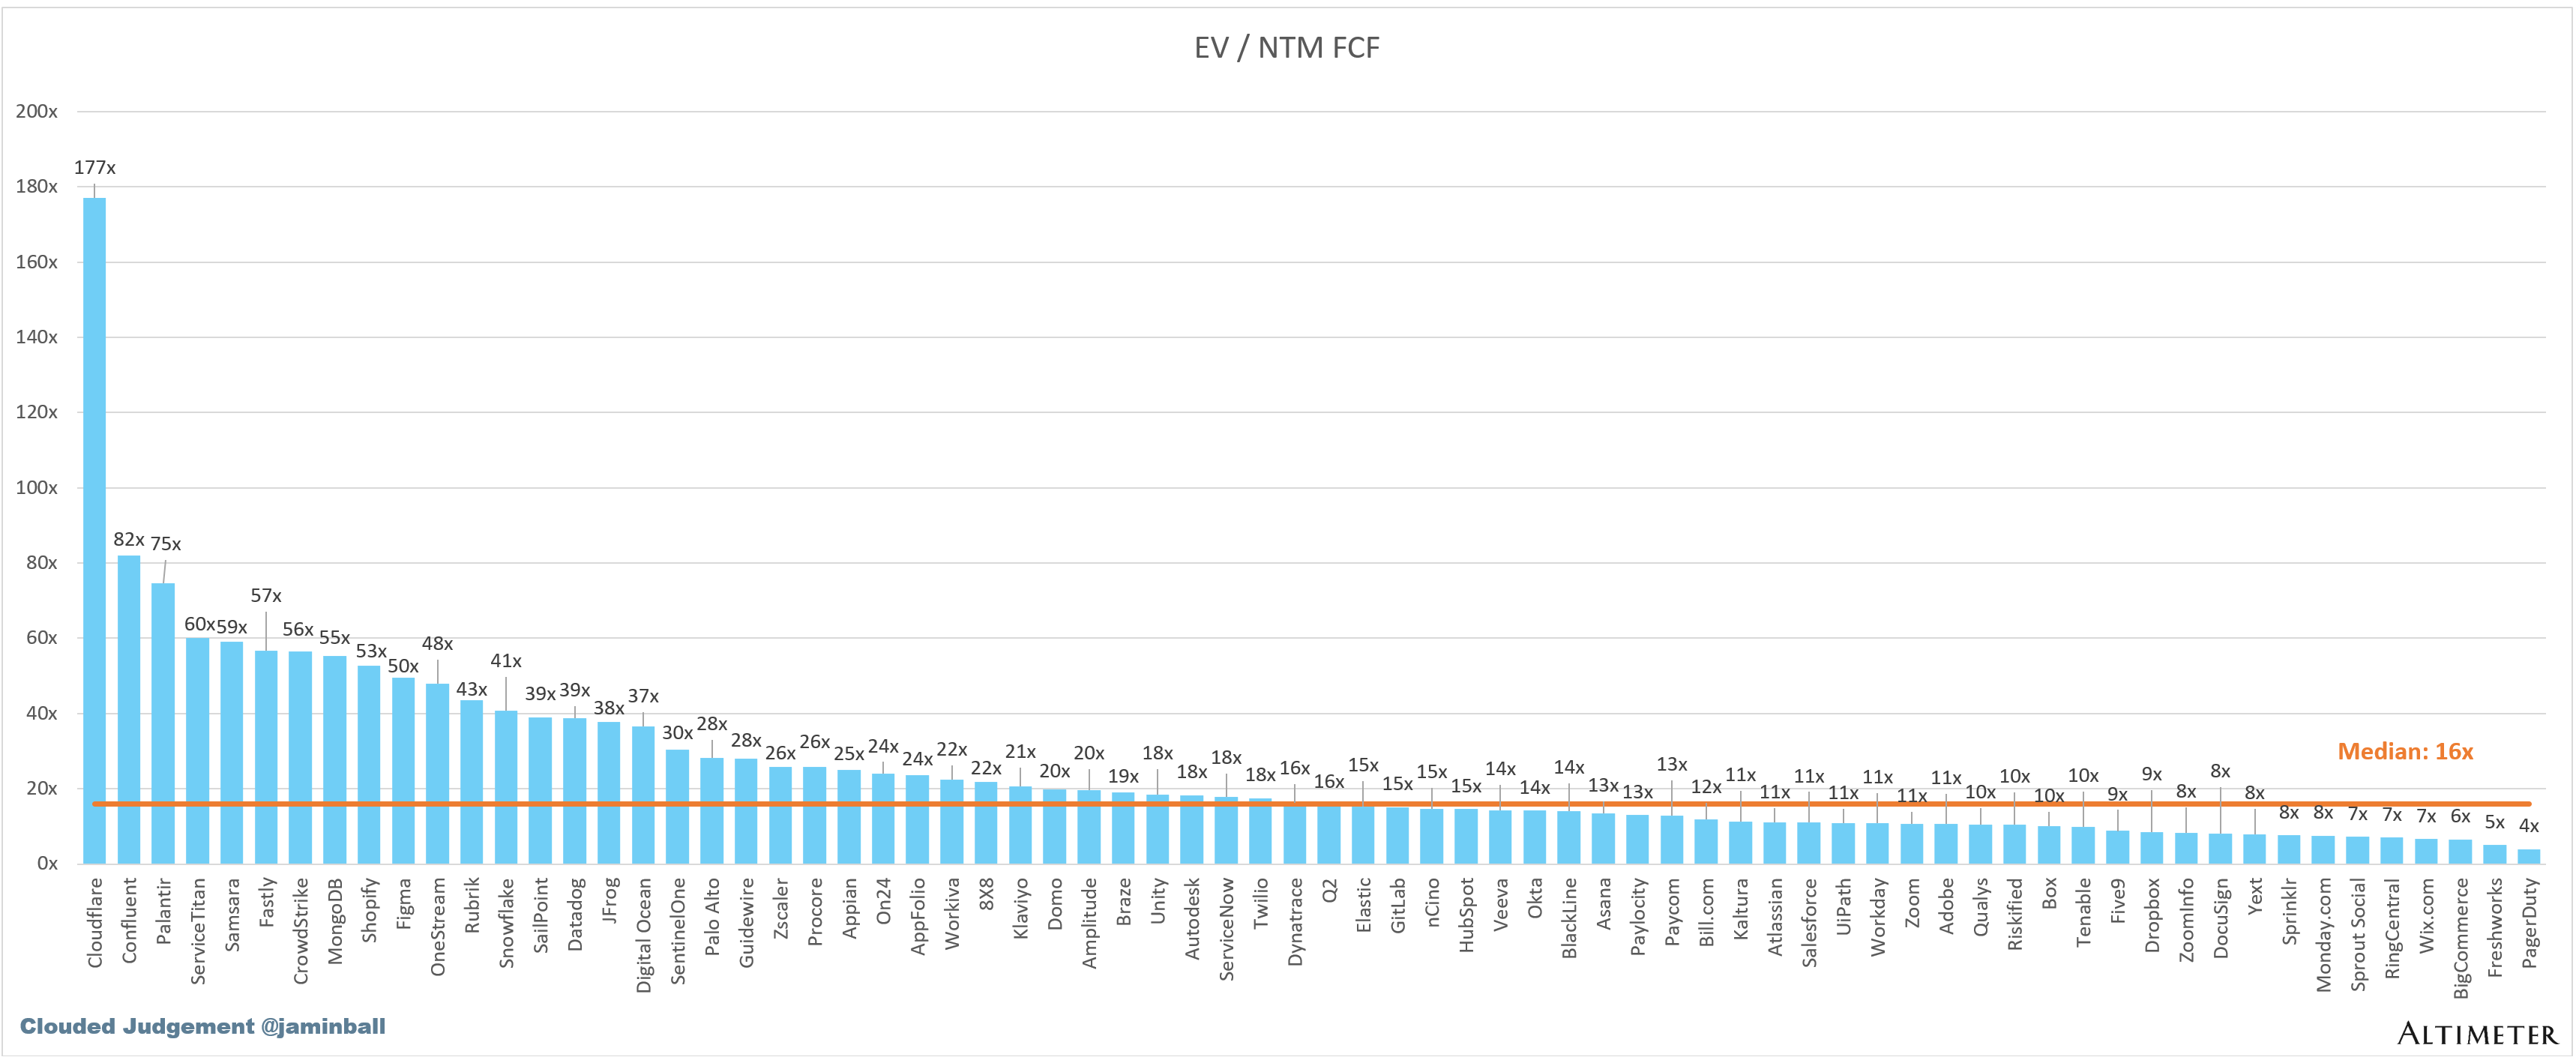
EV / NTM FCF
The line chart shows the median of all companies with a FCF multiple >0x and <100x. I created this subset to show companies where FCF is a relevant valuation metric.
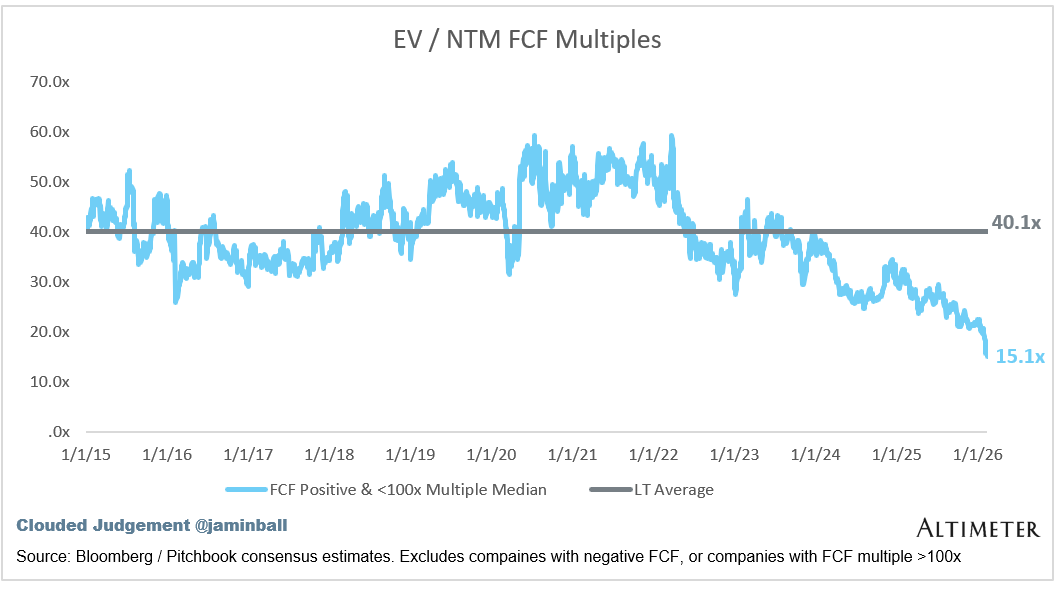
Companies with negative NTM FCF are not listed on the chart
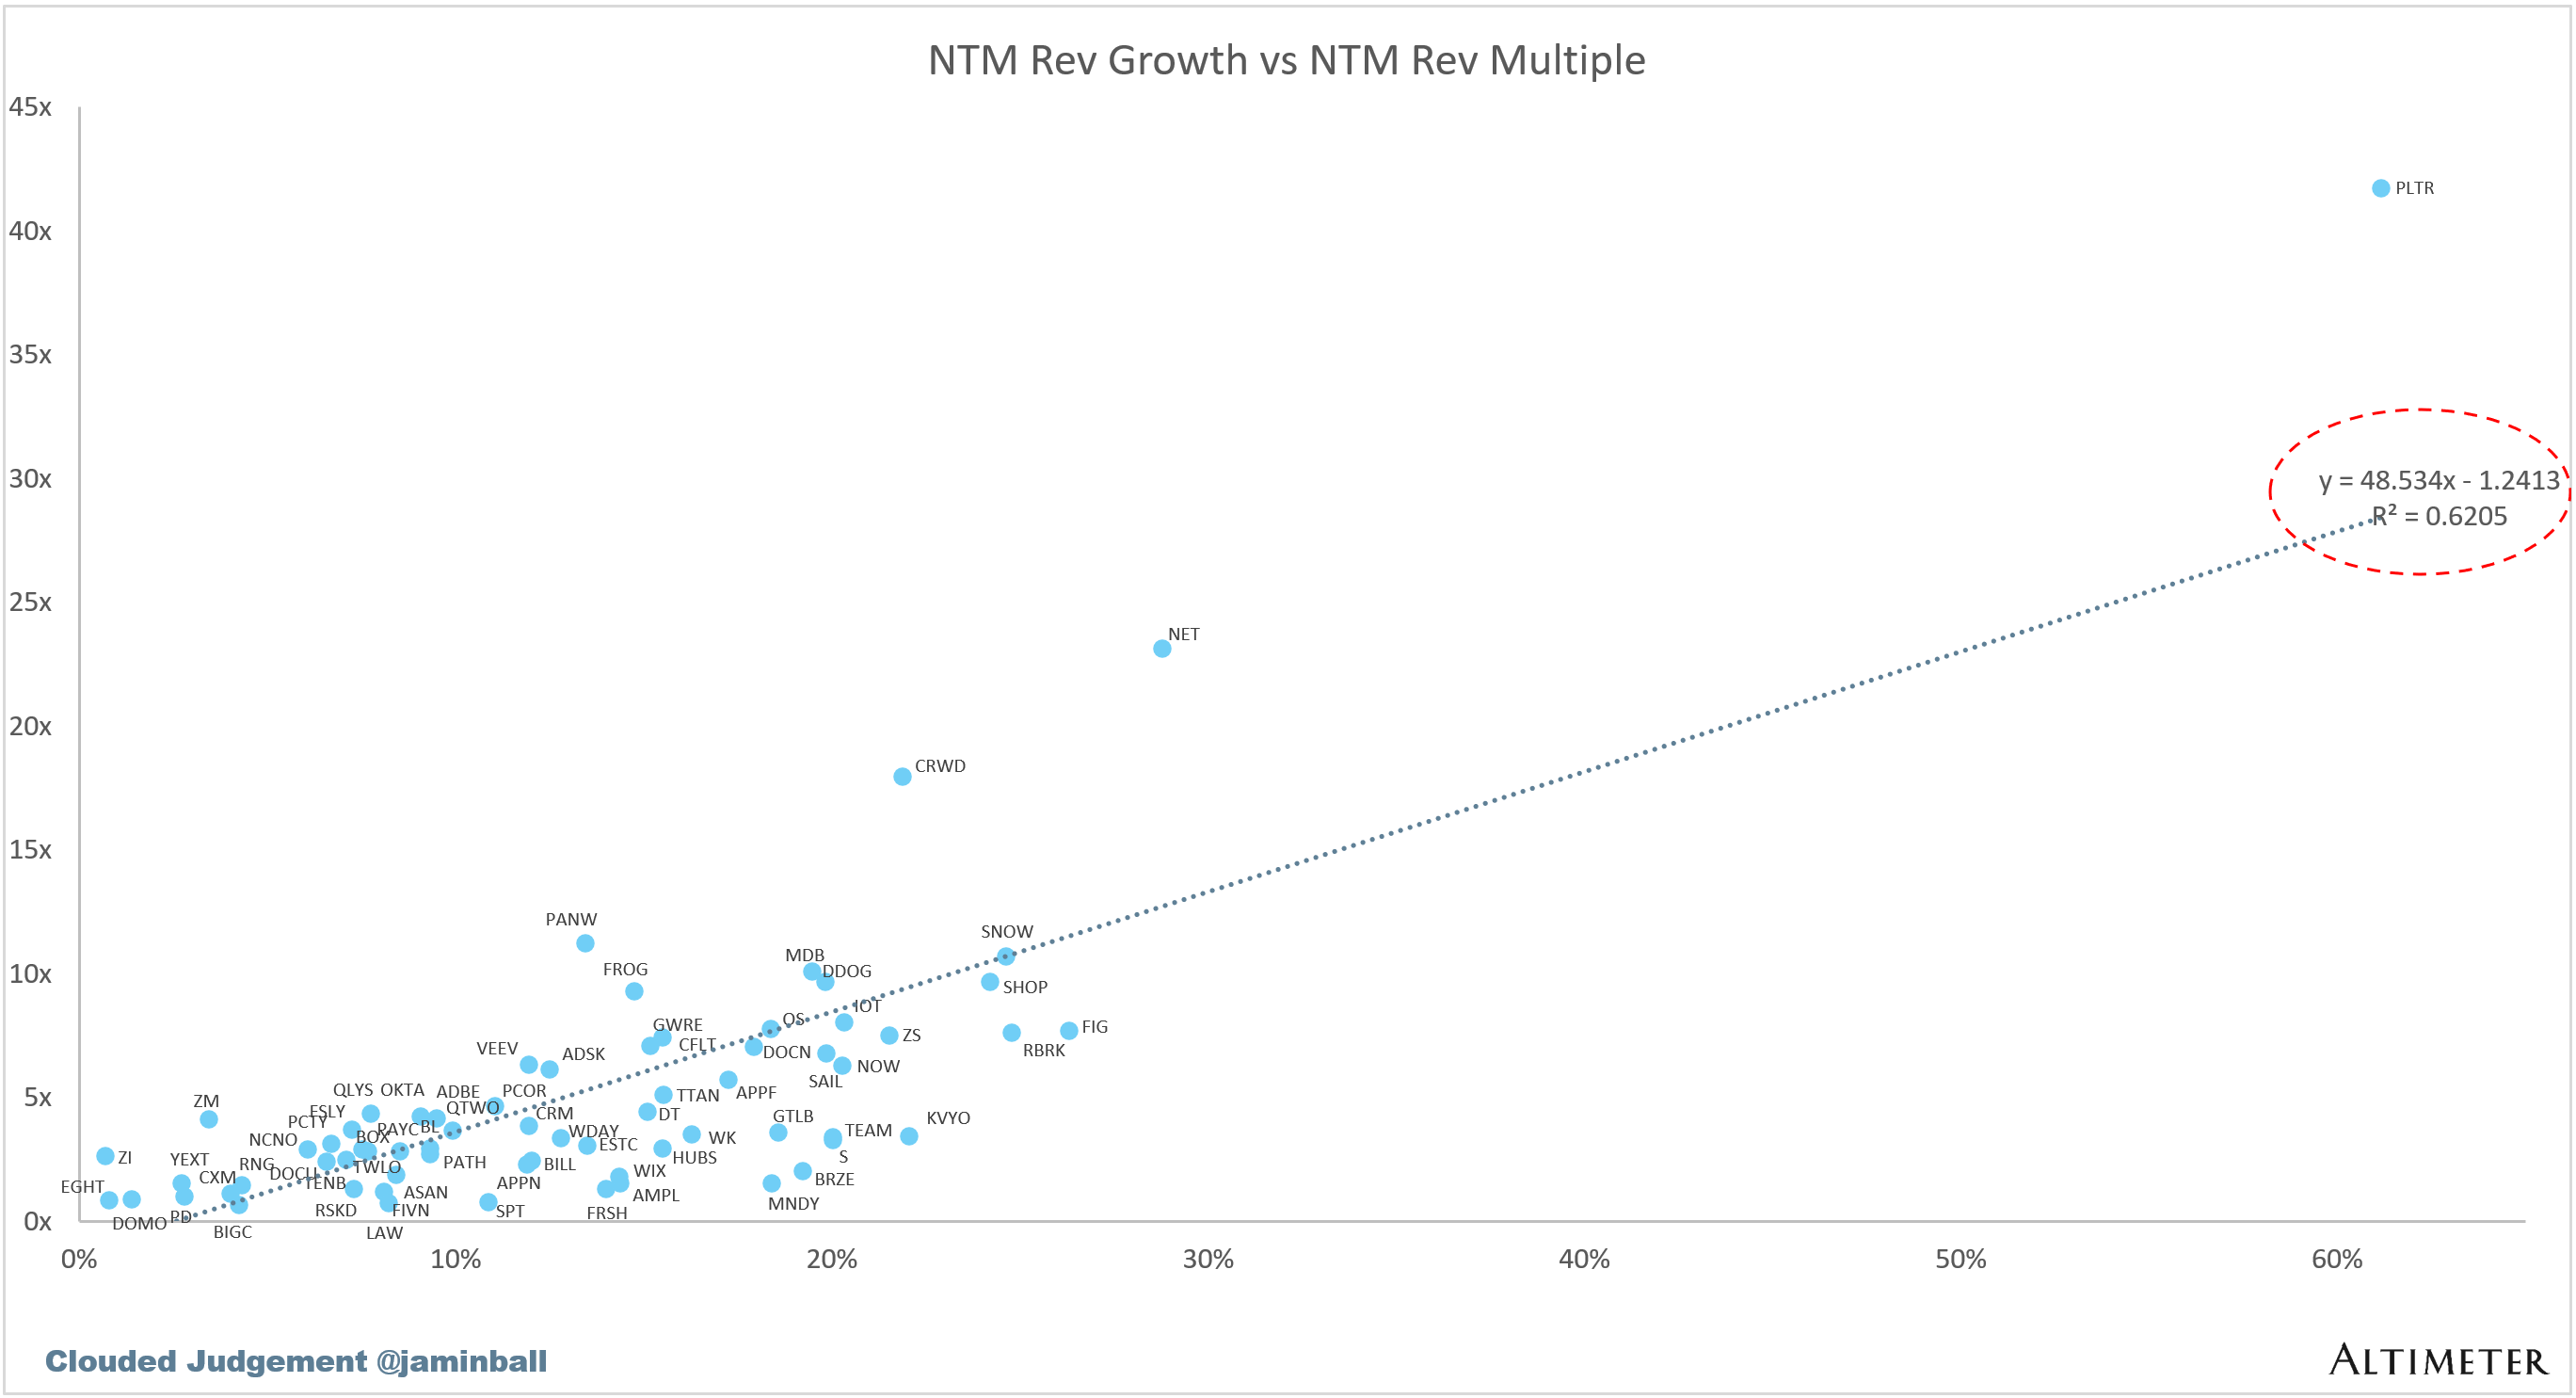
Scatter Plot of EV / NTM Rev Multiple vs NTM Rev Growth
How correlated is growth to valuation multiple?
Operating Metrics
Median NTM growth rate: 12%
Median LTM growth rate: 14%
Median Gross Margin: 76%
Median Operating Margin (1%)
Median FCF Margin: 20%
Median Net Retention: 110%
Median CAC Payback: 36 months
Median S&M % Revenue: 36%
Median R&D % Revenue: 24%
Median G&A % Revenue: 15%
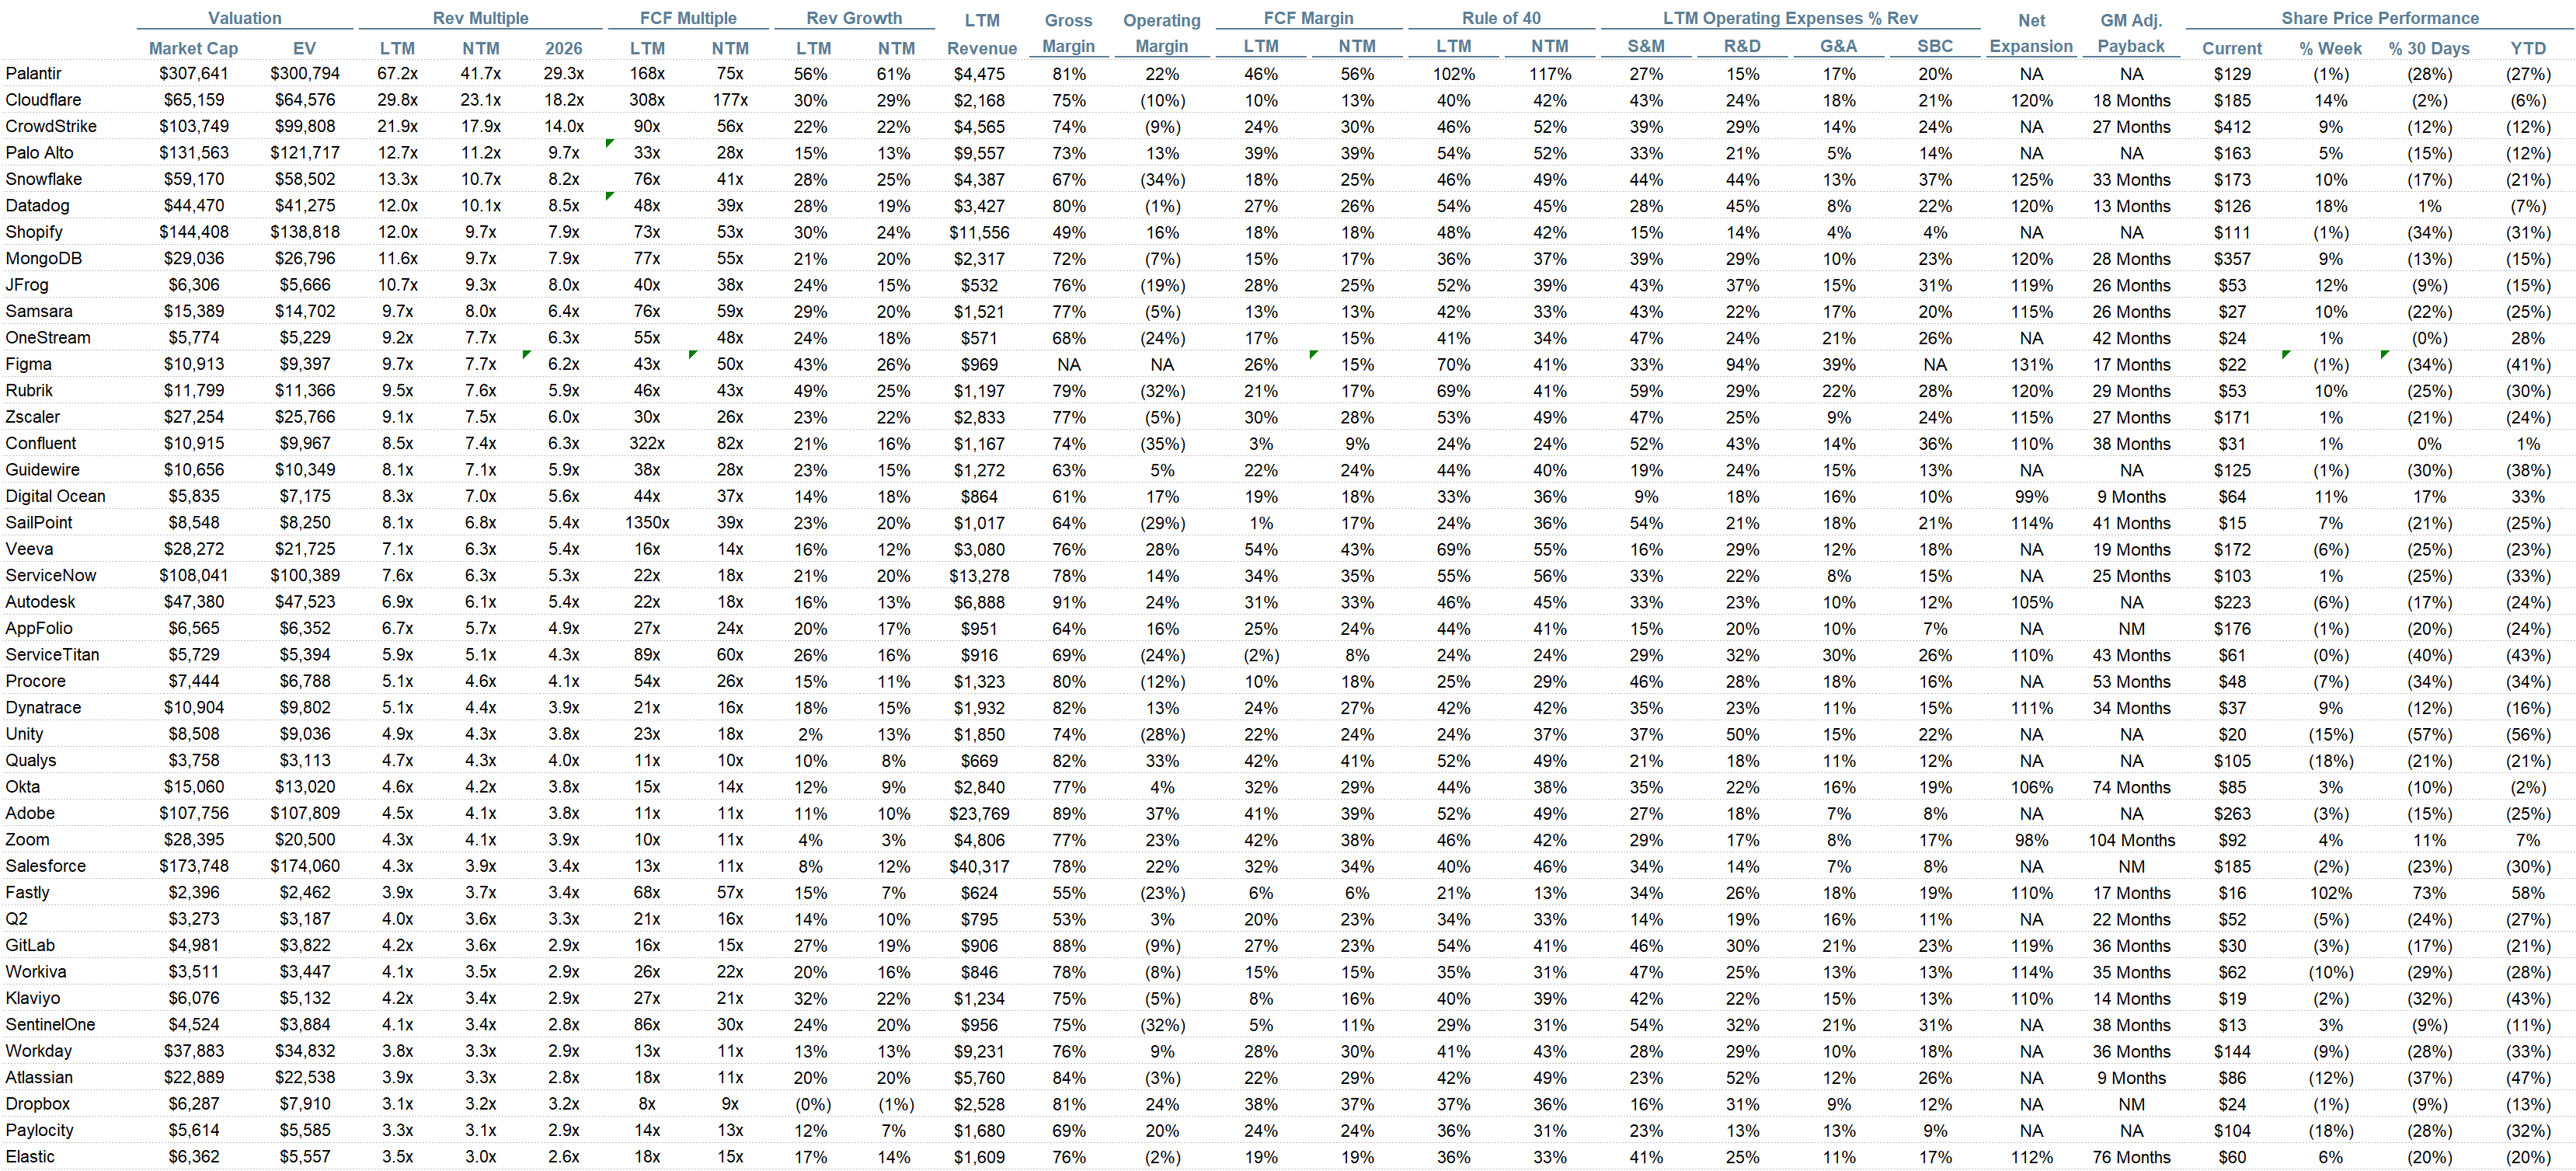
Comps Output
Rule of 40 shows rev growth + FCF margin (both LTM and NTM for growth + margins). FCF calculated as Cash Flow from Operations - Capital Expenditures
GM Adjusted Payback is calculated as: (Previous Q S&M) / (Net New ARR in Q x Gross Margin) x 12. It shows the number of months it takes for a SaaS business to pay back its fully burdened CAC on a gross profit basis. Most public companies don’t report net new ARR, so I’m taking an implied ARR metric (quarterly subscription revenue x 4). Net new ARR is simply the ARR of the current quarter, minus the ARR of the previous quarter. Companies that do not disclose subscription rev have been left out of the analysis and are listed as NA.
Sources used in this post include Bloomberg, Pitchbook and company filings
The information presented in this newsletter is the opinion of the author and does not necessarily reflect the view of any other person or entity, including Altimeter Capital Management, LP (”Altimeter”). The information provided is believed to be from reliable sources but no liability is accepted for any inaccuracies. This is for information purposes and should not be construed as an investment recommendation. Past performance is no guarantee of future performance. Altimeter is an investment adviser registered with the U.S. Securities and Exchange Commission. Registration does not imply a certain level of skill or training. Altimeter and its clients trade in public securities and have made and/or may make investments in or investment decisions relating to the companies referenced herein. The views expressed herein are those of the author and not of Altimeter or its clients, which reserve the right to make investment decisions or engage in trading activity that would be (or could be construed as) consistent and/or inconsistent with the views expressed herein.
This post and the information presented are intended for informational purposes only. The views expressed herein are the author’s alone and do not constitute an offer to sell, or a recommendation to purchase, or a solicitation of an offer to buy, any security, nor a recommendation for any investment product or service. While certain information contained herein has been obtained from sources believed to be reliable, neither the author nor any of his employers or their affiliates have independently verified this information, and its accuracy and completeness cannot be guaranteed. Accordingly, no representation or warranty, express or implied, is made as to, and no reliance should be placed on, the fairness, accuracy, timeliness or completeness of this information. The author and all employers and their affiliated persons assume no liability for this information and no obligation to update the information or analysis contained herein in the future.
spot on...