


Clouded Judgement 2.14.25 - Jan Inflation + Software Earnings Check In

Every week I’ll provide updates on the latest trends in cloud software companies. Follow along to stay up to date!
Software Earnings Kick Off
Software earnings season is in full swing, and so far the results have been uninspiring… Q4 earnings are great because companies for the first time guide for the next full year (and then every quarter they update the full year guidance). But Q4 is when we get the “unveiling” of the first full year guide. It’s always great to compare companies own guide vs consensus estimates at the time to see where the discrepancies lie. The chart below shows how companies full year guide compared to full year consensus earnings before the company announced Q4.

Many first reactions to that chart will be “but the guide bakes in a beat and raise! There’s a cushion!” That is true, however we haven’t seen that as much in the last 12 months. I wrote a piece a couple weeks back titled “Beat and No Raise” which compared full year results (for 2024) to consensus estimates at the start of the year. The takeaway - the median 2024 full year actual result was only 0.2% higher than consensus estimates at the start of the year…So throughout the year numbers really didn’t go up (on average).
Will this year be different? Will the macro turn in favor of software buyers? Will full year results end up much better than expectations at the start of the year? We’ll see! So far, most companies have guided roughly in line with consensus (Palantir a meaningful outlier). The hope is that companies will march numbers up throughout the year, marching valuation up.
What’s also interesting, is there wasn’t tons of correlation between guiding higher than full year consensus and stock performance. Fastly dropped 20% (but had second highest guide relative to consensus), and Confluent rose >20% despite having the worst guide relative to consensus estimates.
We’ll see how the rest of software earnings shake out - but so far I’d categorize the guides / outlooks for the year as “meh” at best. There’s good commentary out there from CEO’s on earnings call about the macro improving, but they’re not backing it up with strong guides (yet).
January Inflation
January inflation came in hot! The 10Y had dropped to ~4.4% at the beginning of Feb, but was back up to ~4.65% after the recent inflation update.
January Inflation (CPI) Update:
Headline CPI: 3.0% YoY (2.9% consensus) and 0.5% MoM (0.3% consensus)
In December Headline CPI was 2.9% YoY and 0.4% MoM
Core CPI: 3.3% YoY (3.1% consensus) and 0.4% MoM (0.3% consensus)
In December Core CPI was 3.2% YoY and 0.2% MoM
I saw this graph floating around X this week that shows the evolution of inflation over the last few years:

Quarterly Reports Summary

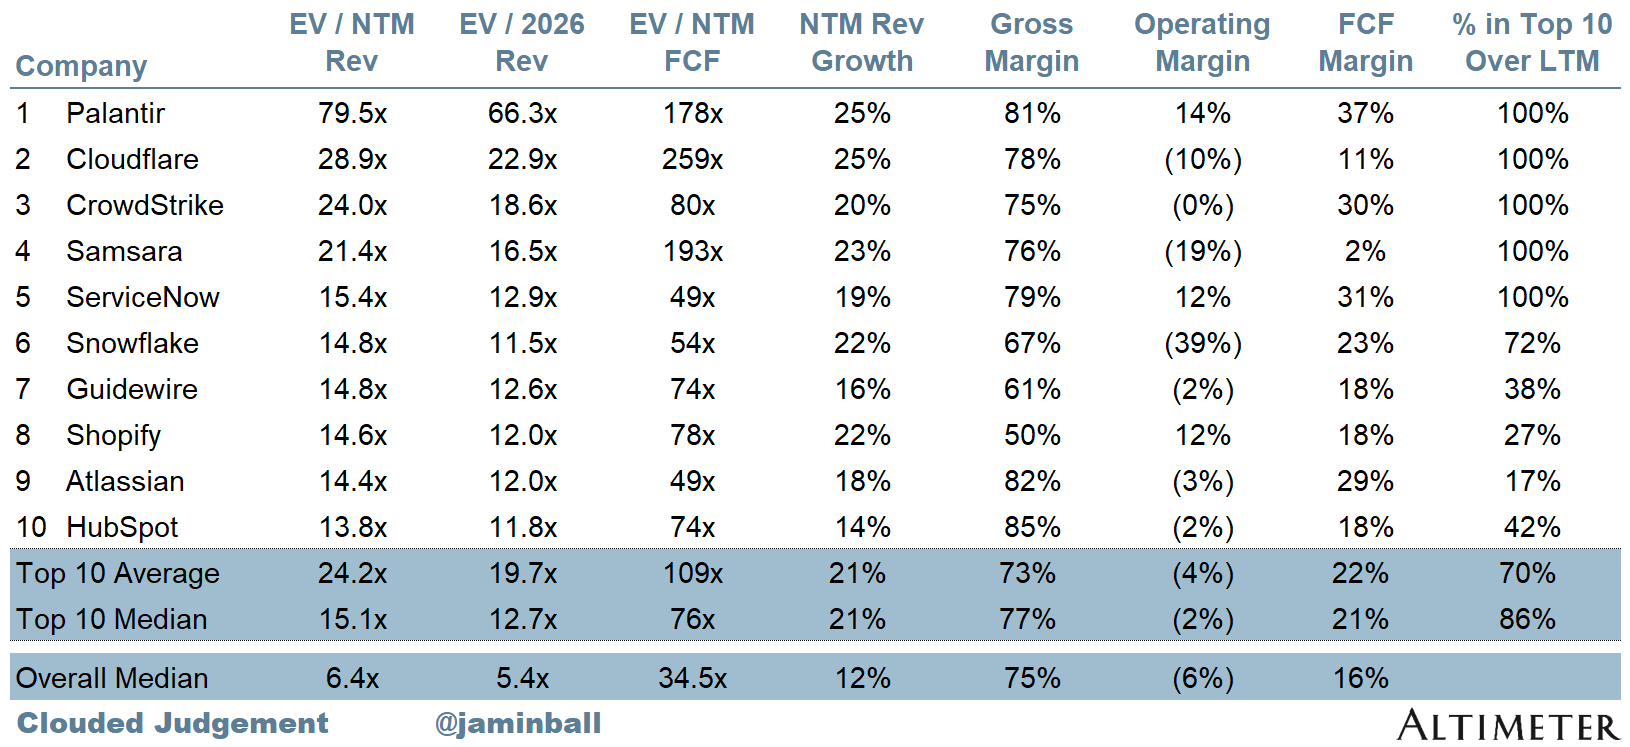
Top 10 EV / NTM Revenue Multiples
Top 10 Weekly Share Price Movement

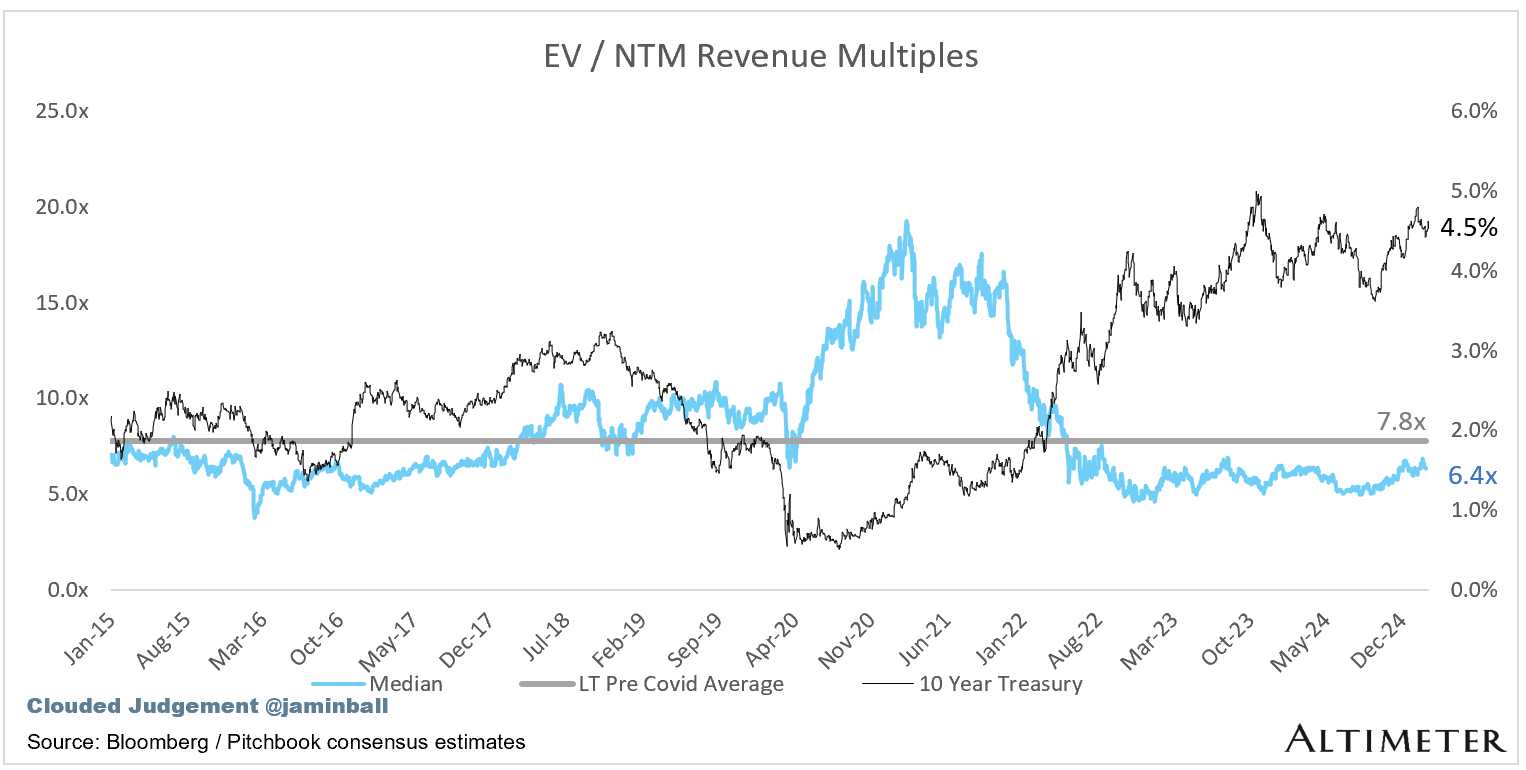
Update on Multiples
SaaS businesses are generally valued on a multiple of their revenue - in most cases the projected revenue for the next 12 months. Revenue multiples are a shorthand valuation framework. Given most software companies are not profitable, or not generating meaningful FCF, it’s the only metric to compare the entire industry against. Even a DCF is riddled with long term assumptions. The promise of SaaS is that growth in the early years leads to profits in the mature years. Multiples shown below are calculated by taking the Enterprise Value (market cap + debt - cash) / NTM revenue.
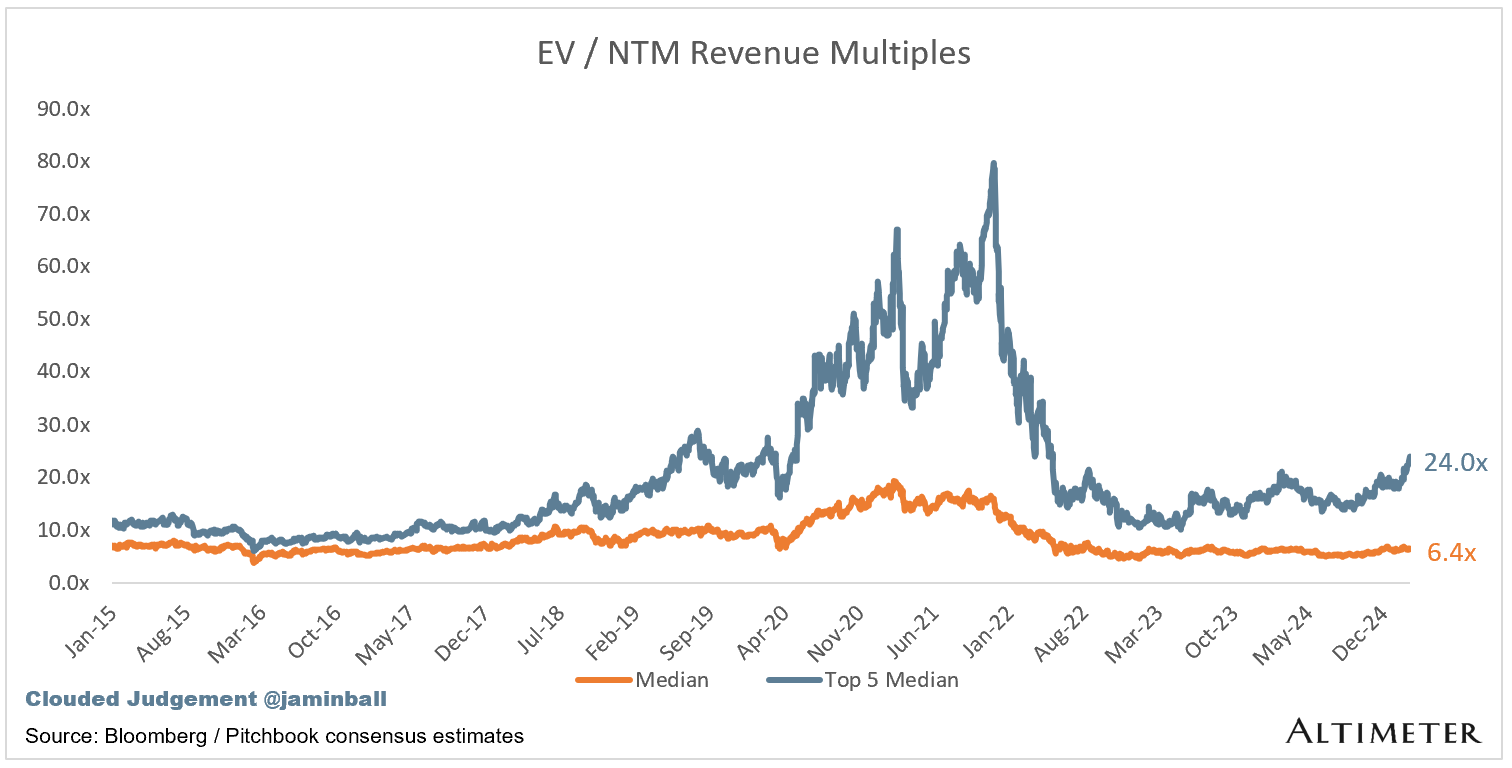
Overall Stats:
Overall Median: 6.4x
Top 5 Median: 24.0x
10Y: 4.5%
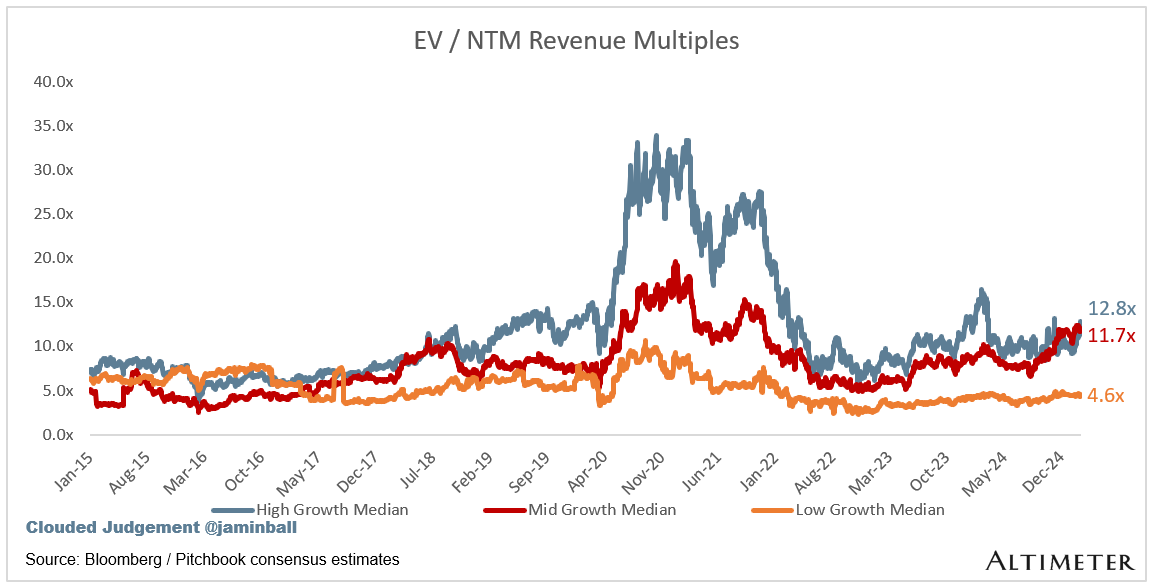
Bucketed by Growth. In the buckets below I consider high growth >27% projected NTM growth (I had to update this, as there’s only 1 company projected to grow >30% after this quarter’s earnings), mid growth 15%-27% and low growth <15%
High Growth Median: 12.8x
Mid Growth Median: 11.7x
Low Growth Median: 4.5x

EV / NTM Rev / NTM Growth
The below chart shows the EV / NTM revenue multiple divided by NTM consensus growth expectations. So a company trading at 20x NTM revenue that is projected to grow 100% would be trading at 0.2x. The goal of this graph is to show how relatively cheap / expensive each stock is relative to their growth expectations


EV / NTM FCF
The line chart shows the median of all companies with a FCF multiple >0x and <100x. I created this subset to show companies where FCF is a relevant valuation metric.

Companies with negative NTM FCF are not listed on the chart

Scatter Plot of EV / NTM Rev Multiple vs NTM Rev Growth
How correlated is growth to valuation multiple?

Operating Metrics
Median NTM growth rate: 12%
Median LTM growth rate: 14%
Median Gross Margin: 76%
Median Operating Margin (7%)
Median FCF Margin: 16%
Median Net Retention: 109%
Median CAC Payback: 37 months
Median S&M % Revenue: 40%
Median R&D % Revenue: 24%
Median G&A % Revenue: 17%
Comps Output
Rule of 40 shows rev growth + FCF margin (both LTM and NTM for growth + margins). FCF calculated as Cash Flow from Operations - Capital Expenditures
GM Adjusted Payback is calculated as: (Previous Q S&M) / (Net New ARR in Q x Gross Margin) x 12 . It shows the number of months it takes for a SaaS business to payback their fully burdened CAC on a gross profit basis. Most public companies don’t report net new ARR, so I’m taking an implied ARR metric (quarterly subscription revenue x 4). Net new ARR is simply the ARR of the current quarter, minus the ARR of the previous quarter. Companies that do not disclose subscription rev have been left out of the analysis and are listed as NA.

Sources used in this post include Bloomberg, Pitchbook and company filings
The information presented in this newsletter is the opinion of the author and does not necessarily reflect the view of any other person or entity, including Altimeter Capital Management, LP ("Altimeter"). The information provided is believed to be from reliable sources but no liability is accepted for any inaccuracies. This is for information purposes and should not be construed as an investment recommendation. Past performance is no guarantee of future performance. Altimeter is an investment adviser registered with the U.S. Securities and Exchange Commission. Registration does not imply a certain level of skill or training.
This post and the information presented are intended for informational purposes only. The views expressed herein are the author’s alone and do not constitute an offer to sell, or a recommendation to purchase, or a solicitation of an offer to buy, any security, nor a recommendation for any investment product or service. While certain information contained herein has been obtained from sources believed to be reliable, neither the author nor any of his employers or their affiliates have independently verified this information, and its accuracy and completeness cannot be guaranteed. Accordingly, no representation or warranty, express or implied, is made as to, and no reliance should be placed on, the fairness, accuracy, timeliness or completeness of this information. The author and all employers and their affiliated persons assume no liability for this information and no obligation to update the information or analysis contained herein in the future.