


Clouded Judgement 2.21.25 - The Platform Evolution Cycle

Every week I’ll provide updates on the latest trends in cloud software companies. Follow along to stay up to date!
The Platform Evolution Cycle
I think we’re entering a really interesting point in the AI platform shift. When I think back to other platform shifts (like the internet or cloud) I think they all followed a similar trajectory of stages:
Basic infra, which led to:
Basic applications, which led to:
Complex infra (as we realized where the gaps were), which led to:
Complex applications
Steps 3 and 4 then continued to loop as the platform shift matured.
Let’s look at the internet as an example.
Basic Infra Phase: We had the creation of core networking infrastructure, including TCP/IP (ARPANET was the predecessor to the Internet in the 70’s / 80’s), early ISPs, the Netscape browser enabling mass internet access, etc. Technology made internet connectivity widely available and set up basic protocols for communication
Basic Application Phase: Early search engines (Google, Yahoo), eCommerce (Amazon, eBay) and email applications. We explored what’s possible with this new infrastructure—basic apps for communication, content, and commerce
Complex Infrastructure Phase: The rise of CDNs (Akamai), broadband, cloud computing (AWS), and security solutions to support more demanding applications. We addressed infrastructure bottlenecks, made the internet faster, more reliable, and capable of supporting more complex applications
Complex Application Phase: The emergence of social networks (Facebook, YouTube, Twitter)), streaming services (Netflix), SaaS platforms, and highly interactive web applications
What gets me really excited is entering phase 3 and 4. I call this the “Reinvention Loop", and I think we’re just starting to hit this point in the AI platform shift. There are almost always a couple early adopter winners from phase 1 and 2 that help define the platform shift(OpenAI?), but the explosion of innovation happens in this Reinvention Loop. We’re getting through the basic infra phase (compute buildout, models as an API). We’ve seen some basic apps (the “OpenAI Wrappers”). In many ways ChatGPT can be viewed as a “basic app” in the same way the google search product was “basic.” And now we’re realizing where the gaps lie that are holding us back from building really complex AI apps and agents. Complex infrastructure is being built today to bridge those gaps and support those complex apps / agents. There will undoubtedly (in my opinion) be a ton of value creation happening at both the infra and app layer during this Reinvention Loop, and it’s what gets me so excited to be investing in technology today.
I really do think we’re entering another golden age of tech investing. Rarely do you get moments in time where massive greenfield opportunities present themselves. As we got more mature in the internet / cloud platform shifts most of the innovation we saw was “a better version of [older cloud company].” Markets were more crowded, innovation curves weren’t as steep, and it was a knife fight. Today, many AI markets are greenfield - new products aren’t replacing old ones, but enabling entirely new experiences and capabilities. This is why we’re seeing some of these AI companies scale as quickly as they are. There’s a greenfield landgrab happening like we haven’t seen in a long time.
And all of this does not come without a fair amount of hype :) BUT - because I think the size of the prize (and size of the pie) are all growing meaningfully, the hype will be justified in time. Not to say we won’t have “overhype” periods along the way - but I think the change we’ll see from this AI platform shift will be truly transformational.
I wanted to share a couple slides from a different presentation I put together that compared what I observed from the early days of the cloud to the early days of AI. If we rewind the clock back to 2011 - one prevailing view at the time was that we were entering a new tech bubble. Valuations were high, silicon valley VCs were paying dumb prices for startups, etc. But, we all know how the 10 years after 2011 turned out for those investing during that “bubble”! Here are a couple headlines I grabbed from early 2011 (there are many others). Some are from folks who were simply addressing the notion of “are we in a bubble in 2011” with their own rebuttals.

It really is hard to try and put ourselves back in that 2011 mindset, but there really was a prevailing view at the time that we were entering the next big bubble. But, a lot of that hype translated to real value. Companies grew larger (and faster) than anyone imagined. TAMs compounded. Companies were built differently. Business models changed an unlocked new vectors of scaling. It appeared like a bubble because we viewed the world though the same lens of the prior platform (and what that implied about the size of the prizes, how companies scaled, etc). But technology grows on an exponential curves, and it turns out we were underestimating the impact of the cloud.
Below is a timeline comparing the two periods. I think today we get a lot of people calling for a bubble.

Of course, just because 2011 turned out not to be a bubble doesn’t mean 2025 will have the same outcome. There’s a chance people calling for a bubble today will be vindicated! I’m simply saying I see similarities from the early days of the cloud to today, and get even more excited as this AI platform shifts enters its own Reinvention Loop phase. I’m lucky to have the seat that I do - being able to work with early stage companies driving a lot of this innovation, while also sitting alongside a team analyzing public companies who are also driving innovation.
It’s certainly the most exciting time (of my career) to be investing in tech!
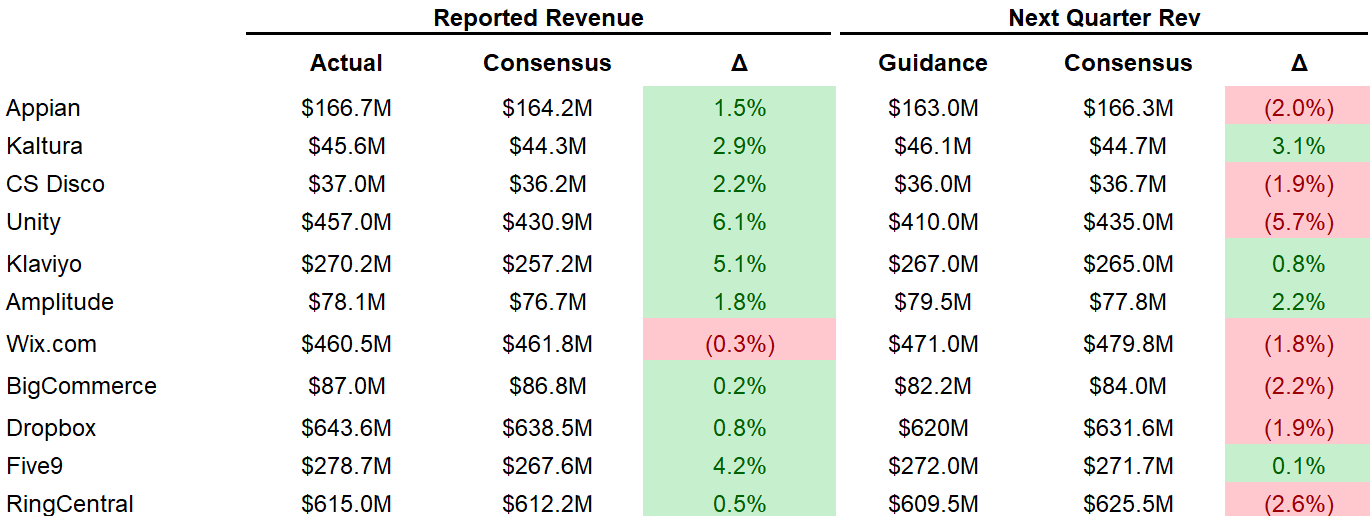
Quarterly Reports Summary
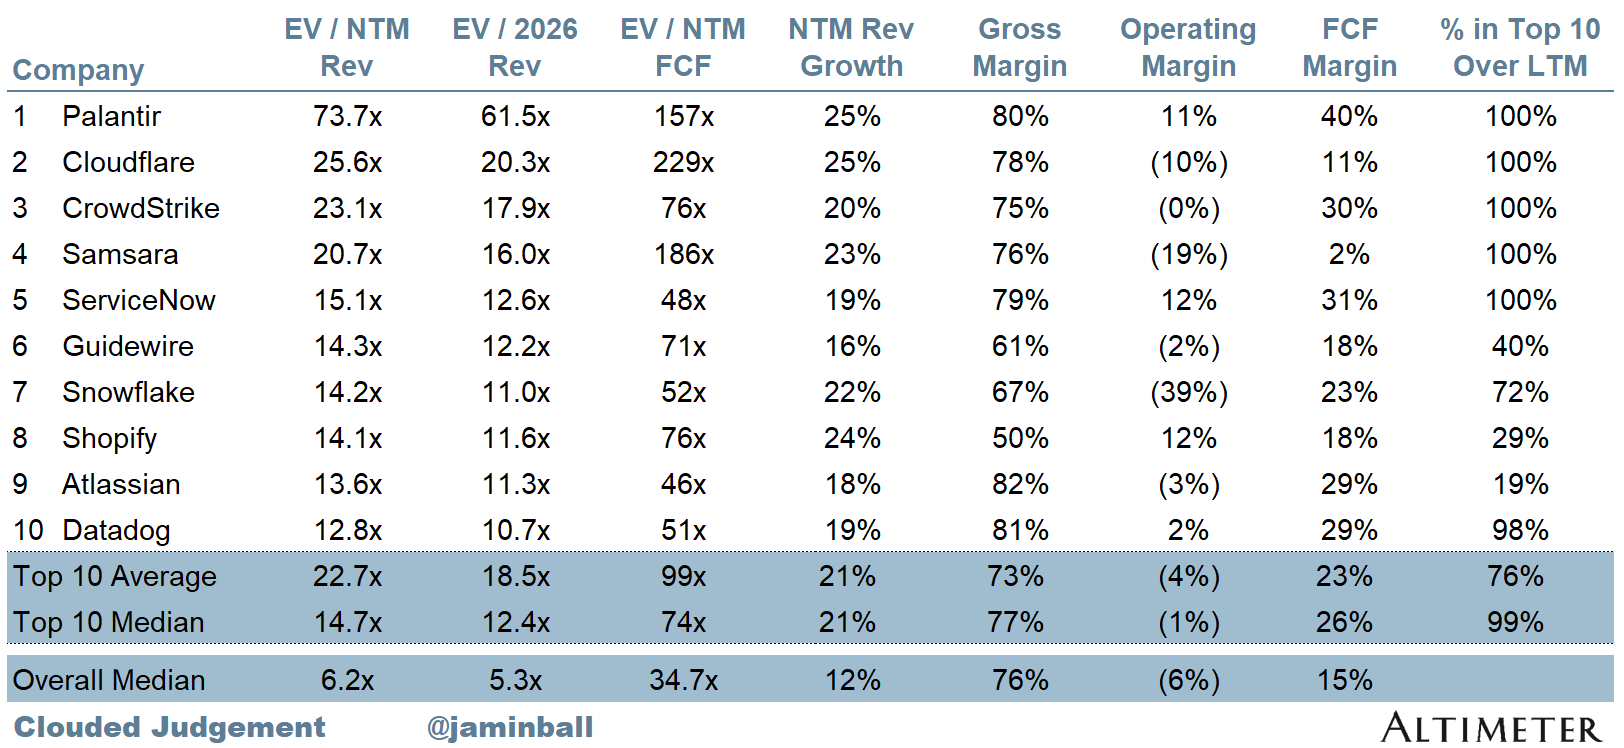
Top 10 EV / NTM Revenue Multiples
Top 10 Weekly Share Price Movement

Update on Multiples
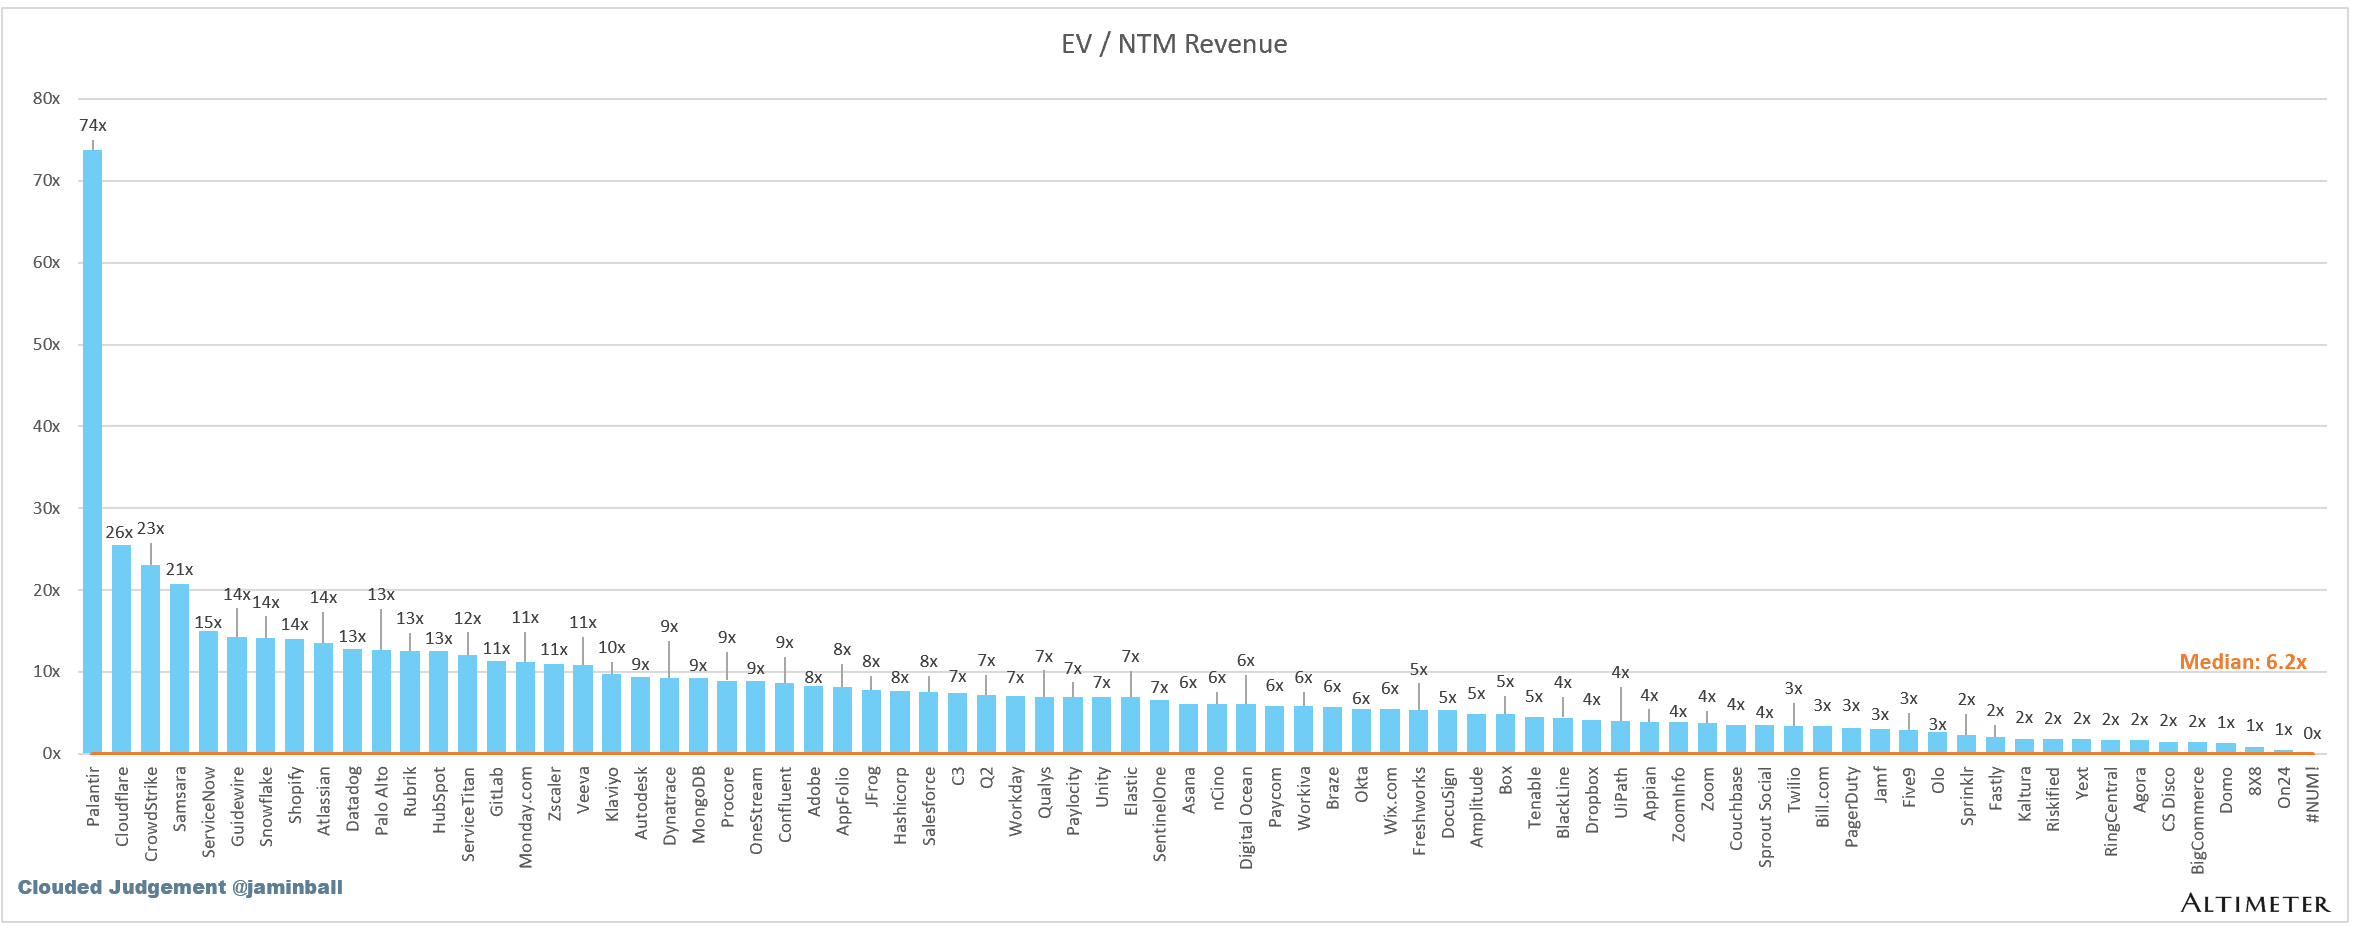
SaaS businesses are generally valued on a multiple of their revenue - in most cases the projected revenue for the next 12 months. Revenue multiples are a shorthand valuation framework. Given most software companies are not profitable, or not generating meaningful FCF, it’s the only metric to compare the entire industry against. Even a DCF is riddled with long term assumptions. The promise of SaaS is that growth in the early years leads to profits in the mature years. Multiples shown below are calculated by taking the Enterprise Value (market cap + debt - cash) / NTM revenue.
Overall Stats:
Overall Median: 6.2x
Top 5 Median: 23.1x
10Y: 4.5%


Bucketed by Growth. In the buckets below I consider high growth >27% projected NTM growth (I had to update this, as there’s only 1 company projected to grow >30% after this quarter’s earnings), mid growth 15%-27% and low growth <15%
High Growth Median: 12.6x
Mid Growth Median: 11.0x
Low Growth Median: 4.6x

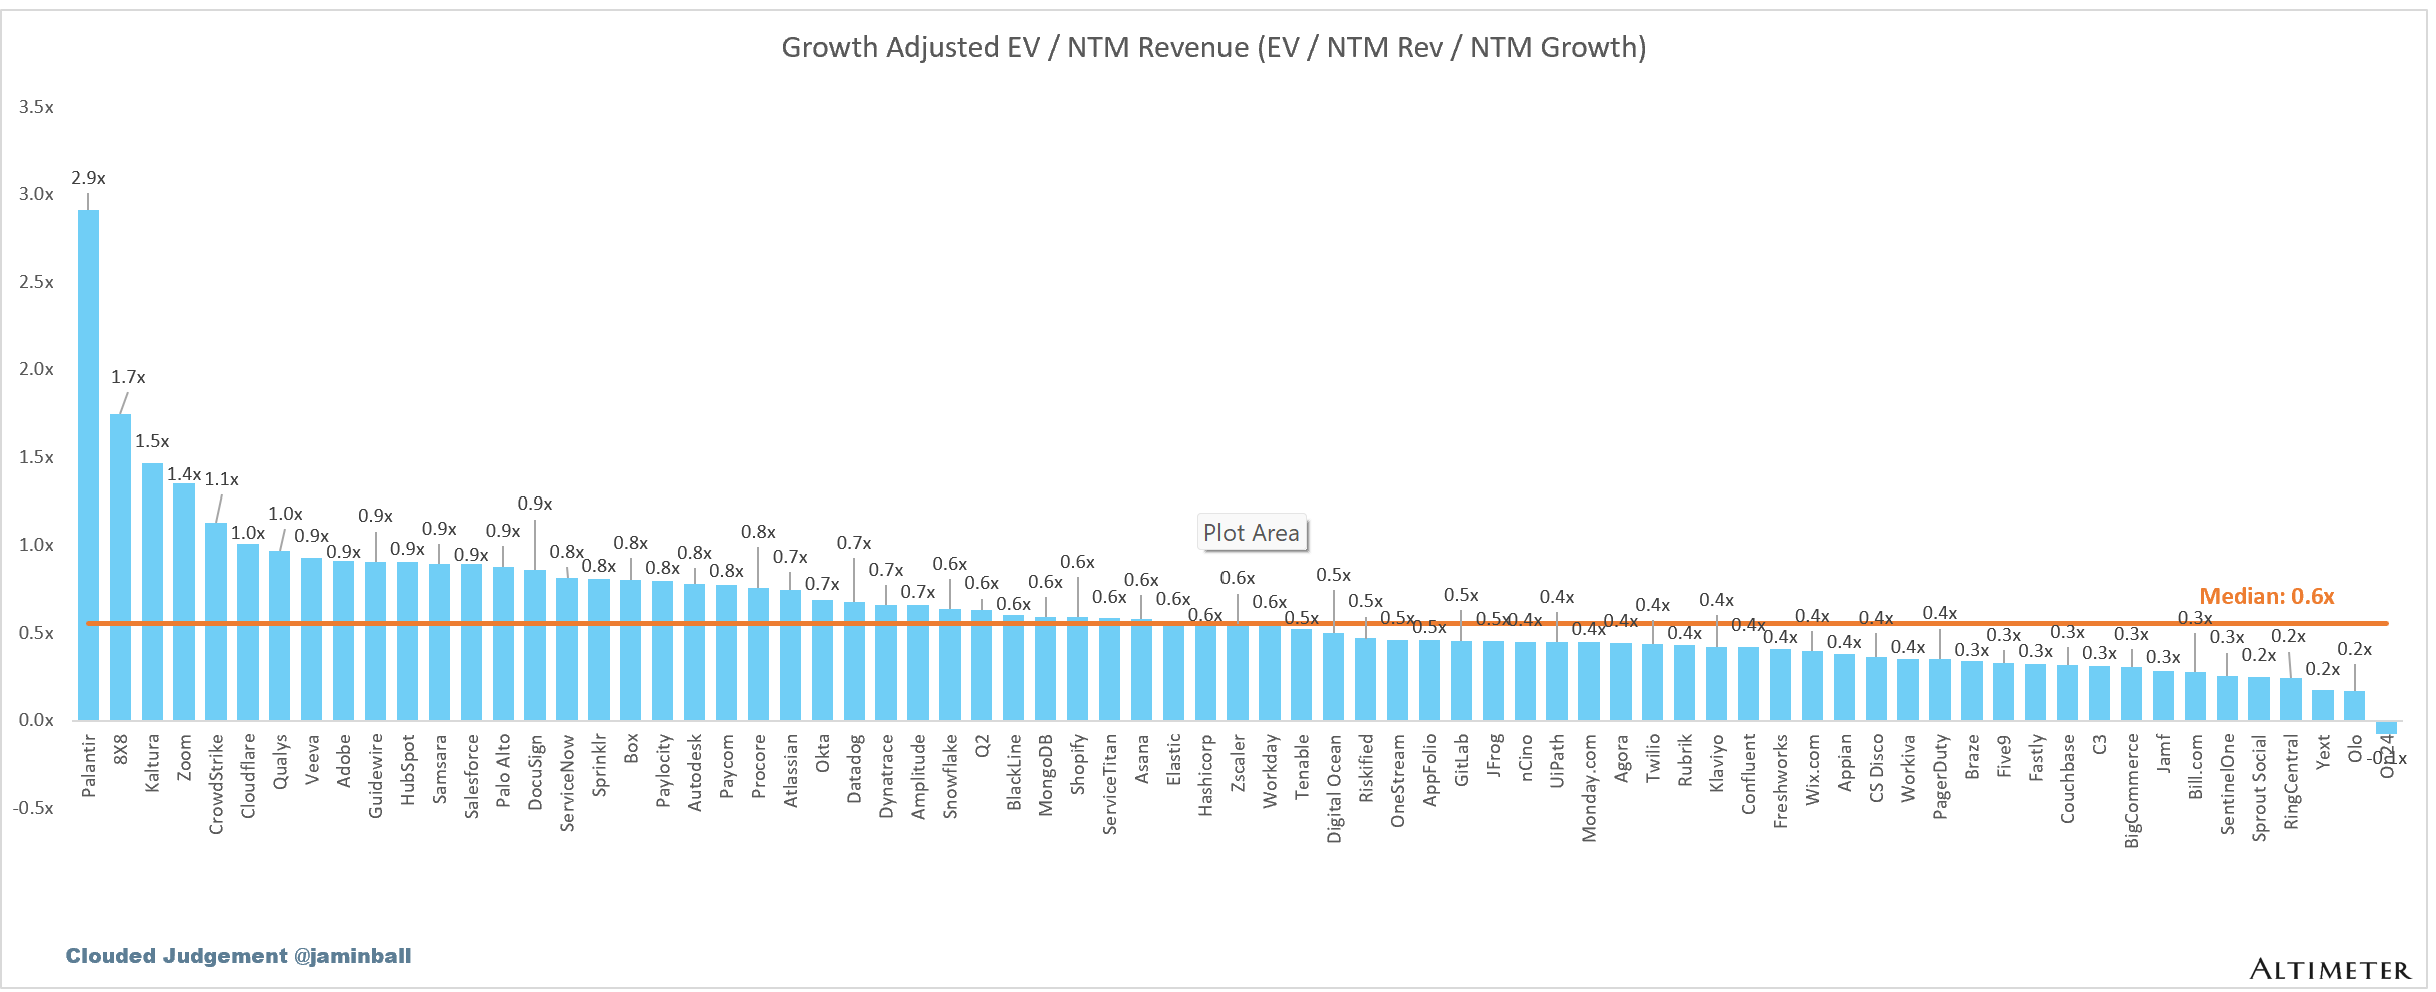
EV / NTM Rev / NTM Growth
The below chart shows the EV / NTM revenue multiple divided by NTM consensus growth expectations. So a company trading at 20x NTM revenue that is projected to grow 100% would be trading at 0.2x. The goal of this graph is to show how relatively cheap / expensive each stock is relative to their growth expectations

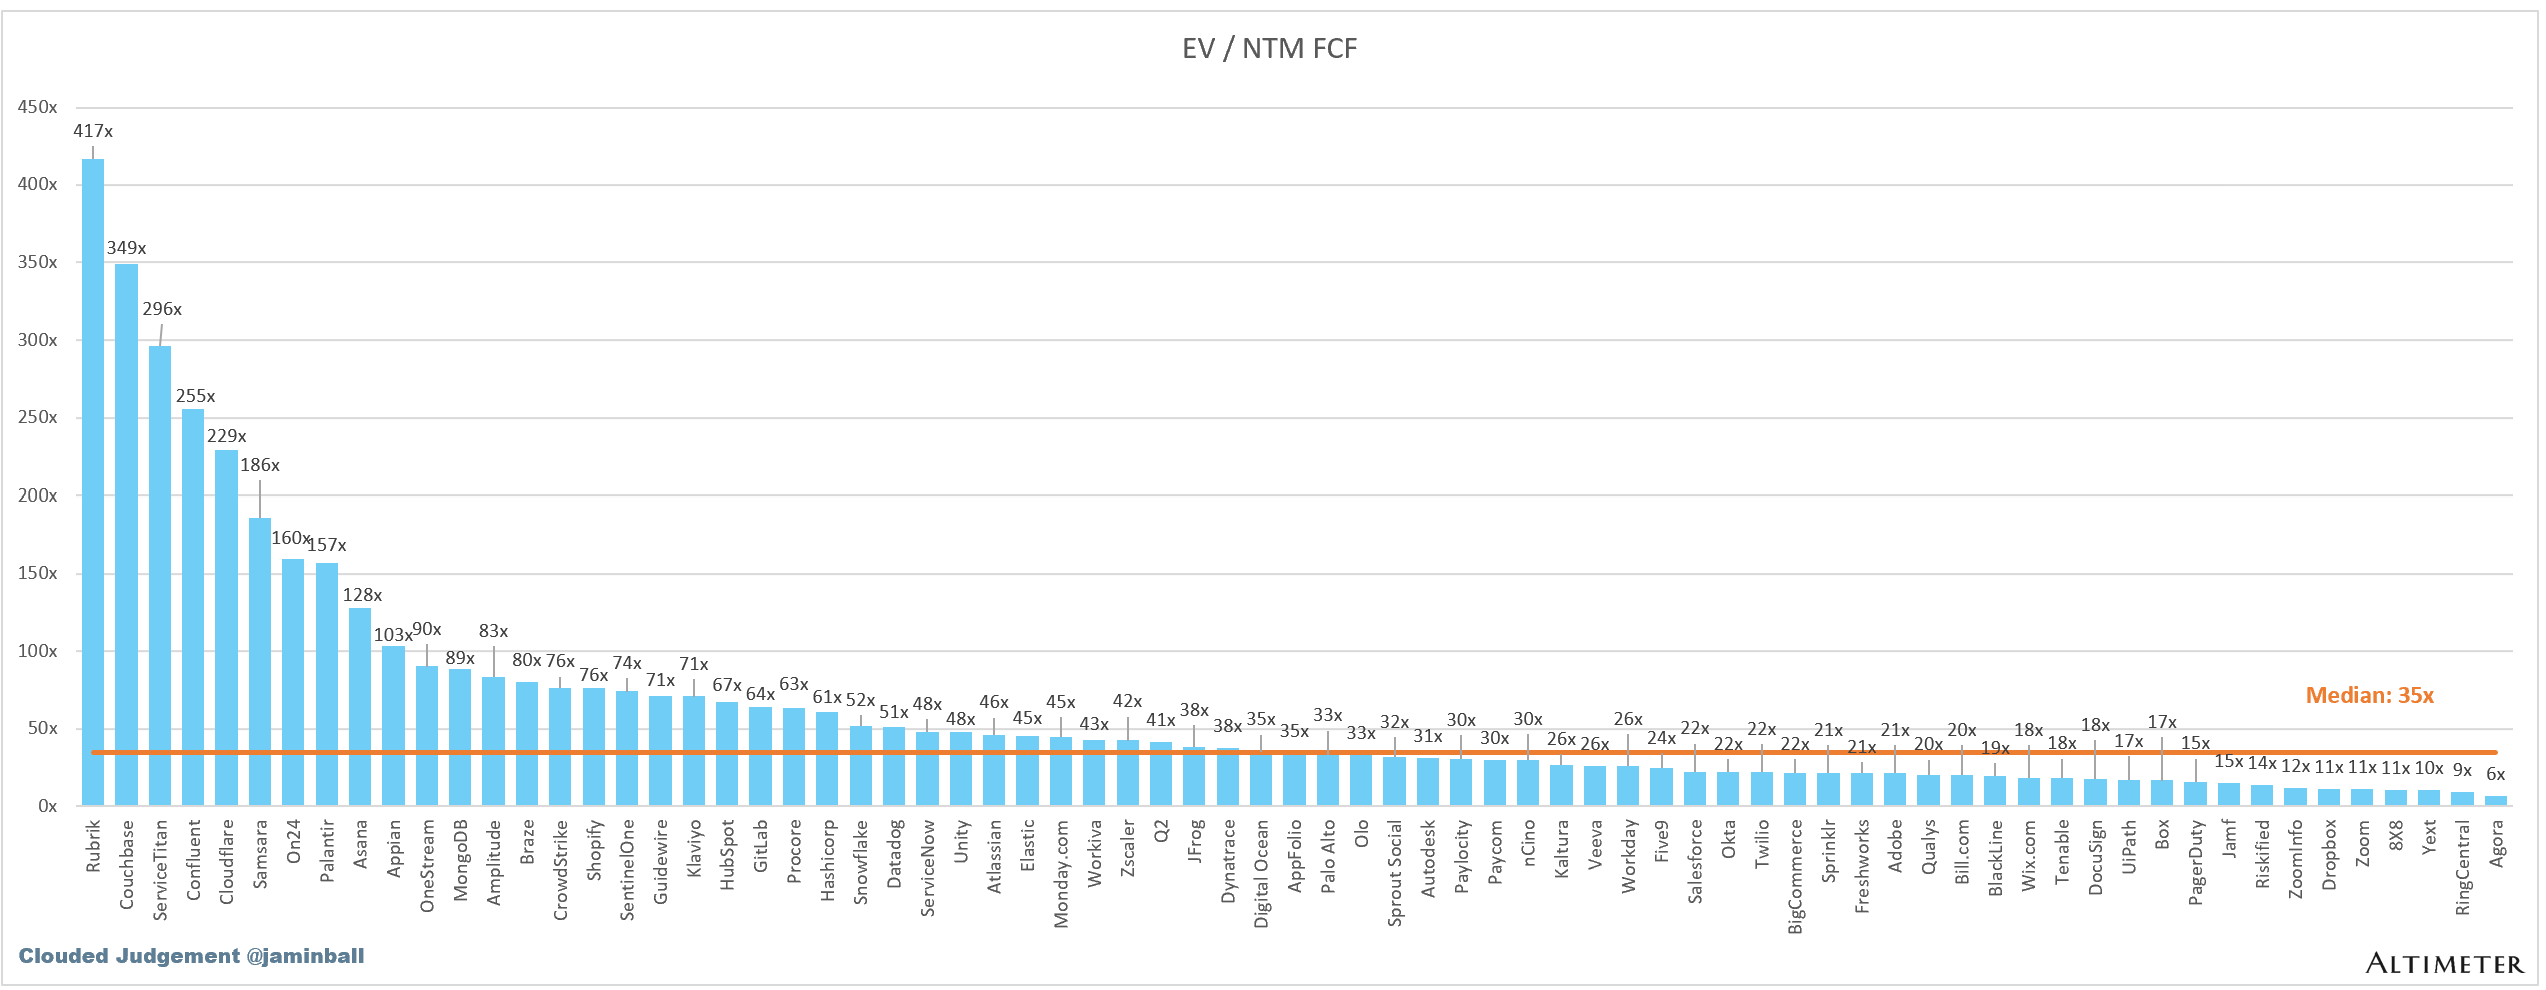
EV / NTM FCF
The line chart shows the median of all companies with a FCF multiple >0x and <100x. I created this subset to show companies where FCF is a relevant valuation metric.

Companies with negative NTM FCF are not listed on the chart
Scatter Plot of EV / NTM Rev Multiple vs NTM Rev Growth
How correlated is growth to valuation multiple?

Operating Metrics
Median NTM growth rate: 12%
Median LTM growth rate: 16%
Median Gross Margin: 76%
Median Operating Margin (6%)
Median FCF Margin: 15%
Median Net Retention: 108%
Median CAC Payback: 42 months
Median S&M % Revenue: 39%
Median R&D % Revenue: 25%
Median G&A % Revenue: 17%
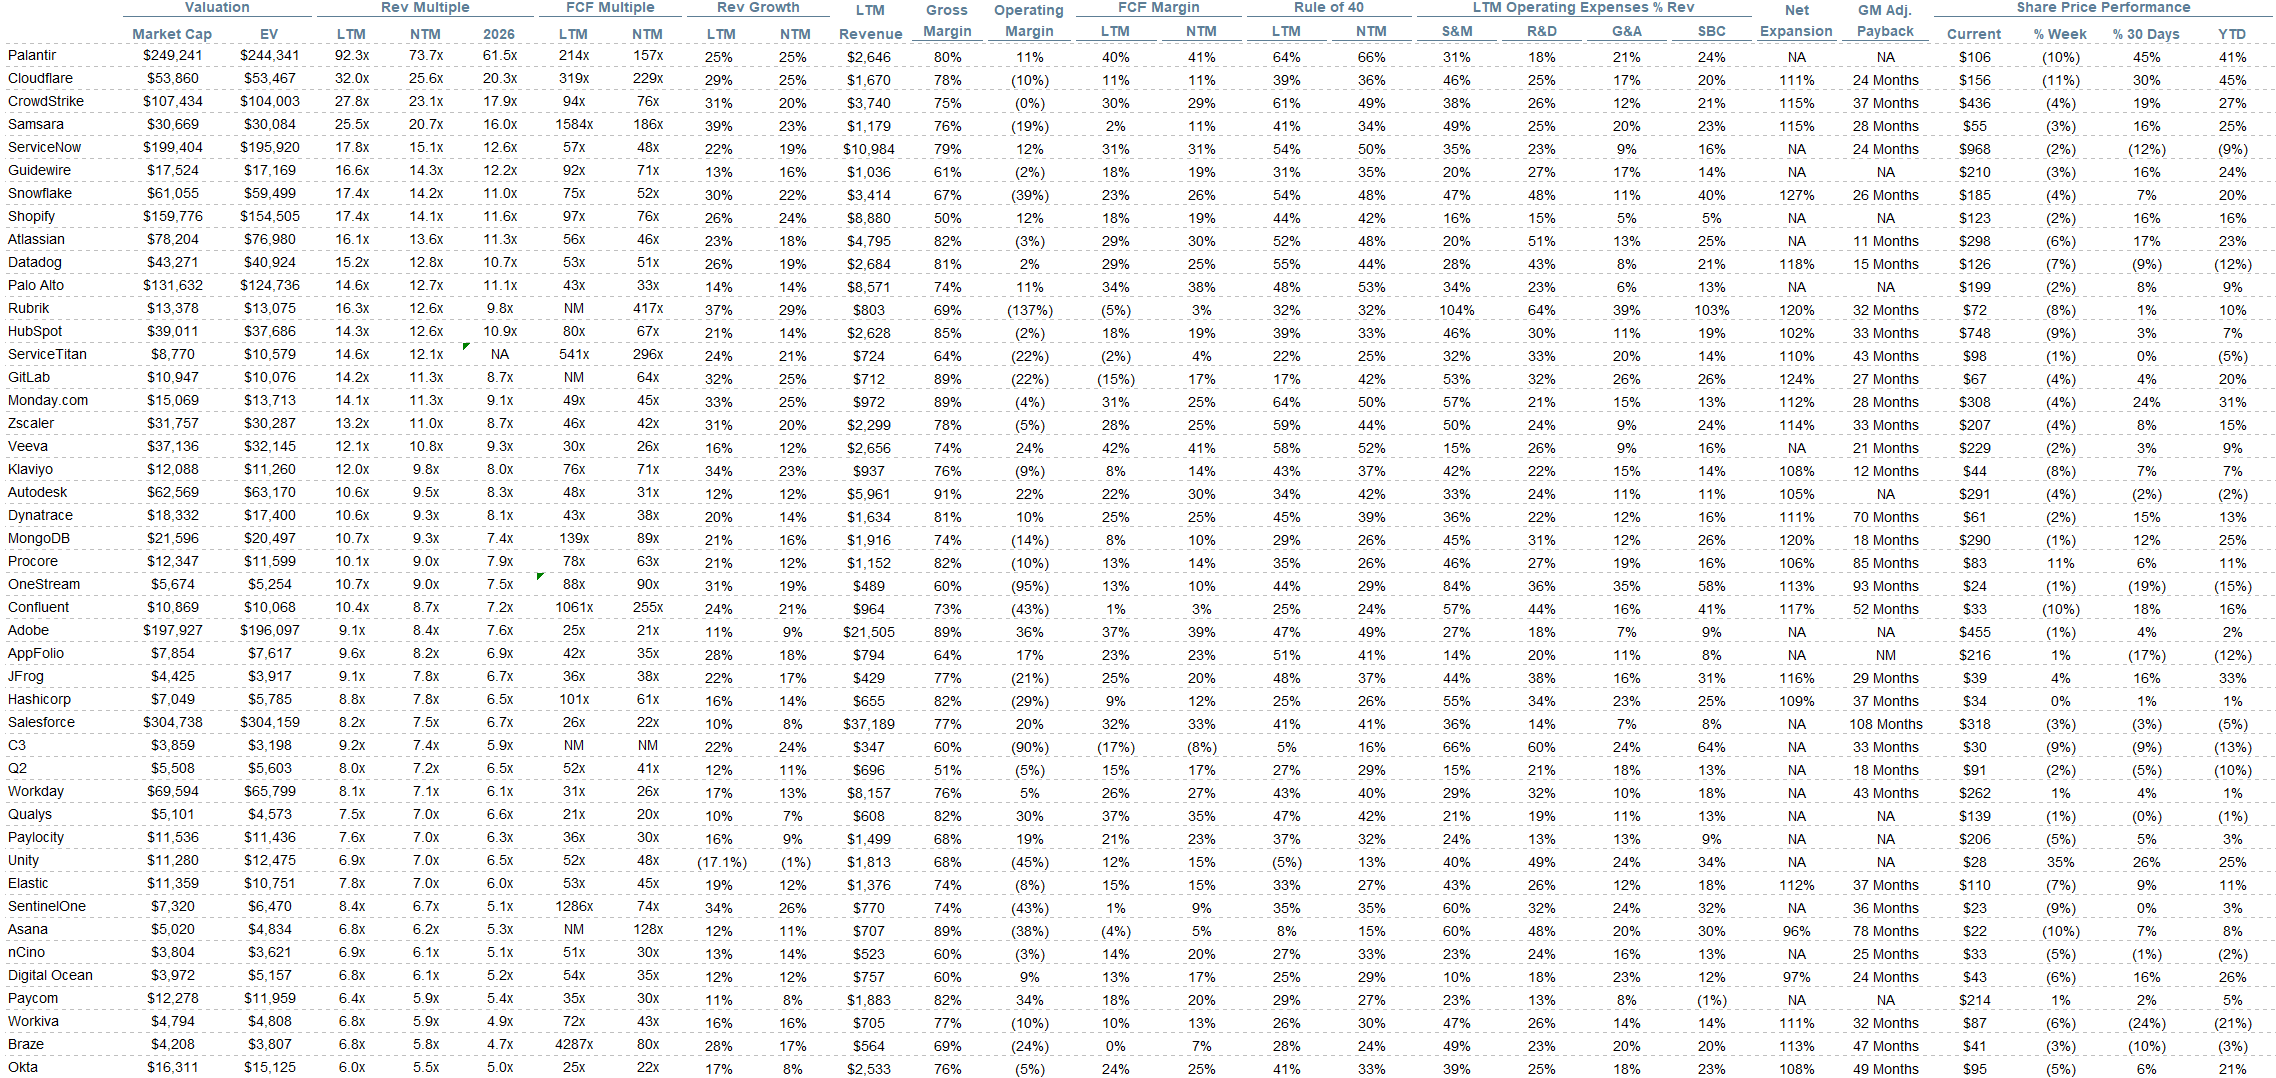
Comps Output
Rule of 40 shows rev growth + FCF margin (both LTM and NTM for growth + margins). FCF calculated as Cash Flow from Operations - Capital Expenditures
GM Adjusted Payback is calculated as: (Previous Q S&M) / (Net New ARR in Q x Gross Margin) x 12 . It shows the number of months it takes for a SaaS business to payback their fully burdened CAC on a gross profit basis. Most public companies don’t report net new ARR, so I’m taking an implied ARR metric (quarterly subscription revenue x 4). Net new ARR is simply the ARR of the current quarter, minus the ARR of the previous quarter. Companies that do not disclose subscription rev have been left out of the analysis and are listed as NA.

Sources used in this post include Bloomberg, Pitchbook and company filings
The information presented in this newsletter is the opinion of the author and does not necessarily reflect the view of any other person or entity, including Altimeter Capital Management, LP ("Altimeter"). The information provided is believed to be from reliable sources but no liability is accepted for any inaccuracies. This is for information purposes and should not be construed as an investment recommendation. Past performance is no guarantee of future performance. Altimeter is an investment adviser registered with the U.S. Securities and Exchange Commission. Registration does not imply a certain level of skill or training.
This post and the information presented are intended for informational purposes only. The views expressed herein are the author’s alone and do not constitute an offer to sell, or a recommendation to purchase, or a solicitation of an offer to buy, any security, nor a recommendation for any investment product or service. While certain information contained herein has been obtained from sources believed to be reliable, neither the author nor any of his employers or their affiliates have independently verified this information, and its accuracy and completeness cannot be guaranteed. Accordingly, no representation or warranty, express or implied, is made as to, and no reliance should be placed on, the fairness, accuracy, timeliness or completeness of this information. The author and all employers and their affiliated persons assume no liability for this information and no obligation to update the information or analysis contained herein in the future.
The Reinvention Loop analogy is spot on, history shows that true value creation happens when infrastructure and applications evolve together.
The comparison to the cloud boom in 2011 is key. People called it a bubble, yet it laid the foundation for trillion-dollar companies. AI feels like a similar inflection point, where greenfield opportunities drive exponential growth, not just incremental improvements.
Excellent write up and very thought provoking. Thanks, Jamin.