Clouded Judgement 2.24.23 - Is the Consumer Really that Strong?
Every week I’ll provide updates on the latest trends in cloud software companies. Follow along to stay up to date!
Is “The Consumer” Really Strong?
This week Walmart and Home Depot reported earnings (I know, not the usual cloud software suspects!). But they did give us some insights into the health of the consumer and labor market. One one hand - the economy added >400k jobs in January and retail sales grew 3% month-over-month, both above expectations. For Walmart specifically, its comparable sales great 8% YoY. All of this data gave those arguing for the soft-landing more ammo. One the other hand - Walmart may have given us some canary-in-the-coal mine data points as well. They guided this year below expectations at ~3% YoY growth. More discretionary items didn’t do quite as well. Their general tone was that the consumer has been acting strong, but we may be getting to a tipping point where we see real pull back. Home Depot had a similar message. Their business is obviously more tied to the housing market, which is going through it’s own challenges (but all tied back to the broader economy). Home Depot’s CEO said last year the consumer was more resilient than they expected, but towards the end of the year they noted deceleration in certain product categories which was more pronounced in the fourth quarter.
At the same time - Home Depot also said they would spend an extra $1B this year on increasing wages for front line workers. Retailers are seeing pressure from rising input costs (from suppliers like Procter and Gamble / Unilever), as well as rising wages. The choice they have is to pass those price increases back on to the consumer (who appears to be getting much weaker), or take margin hits. Either way, the situation seems less rosy than the beginning of year data suggested.
In summary - the jobs / retail sales data we got at the start of the year looked promising and added more fuel to the soft-landing camp. However, it’s looking more and more likely that the leading indicators are pointing towards a consumer on the brink.
This article was a great quick read on a few other factors Larry Summers sees which brings him to a similar conclusion that current data looks good, but leading indicators are more troubling
Update on 2023 Guides
Updating a chart I’ve shared previously (2023 guides vs consensus at the start of the year). So far, it’s more of the same. On average, companies are guiding in line with where consensus estimates were to start the year
Multiples Check In
The current median NTM revenue multiple for cloud software companies is 5.9x, and the current 10Y is 3.9%. In the 10 years leading up to 2020 the median multiple was ~7.8x, and the average 10Y was ~2.3%. So today, the median multiple is ~25% lower than where it’s longer term average (pre 2010 we don’t have much data on cloud software multiples as there weren’t many public cloud software companies). It makes sense the median multiple today is lower than the 2010-2020 average given the difference in rates. I’d expect about a 25% discount given the 3.9% vs 2.3% 10Y. However, the elephant in the room is a looming recession. As I noted above, so far companies are telling us 2023 estimates are ok. BUT - if we do fall into a deeper recession growth + multiples will definitely fall. The takeaway for me being - market seems to be optometric (at least in the short term) on what type of recession (if any) we’ll have.
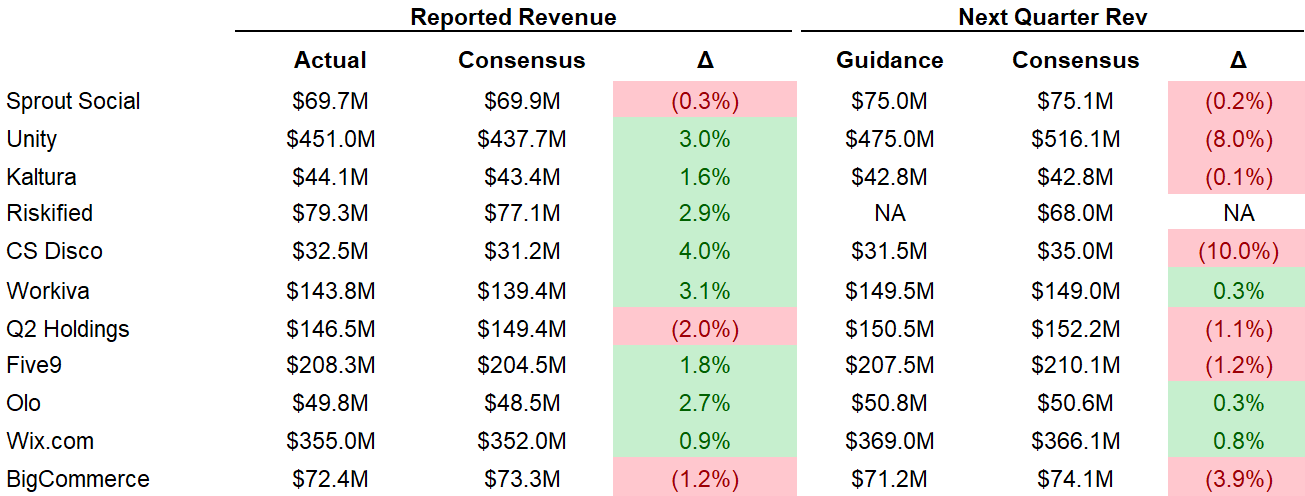
Quarterly Reports Summary
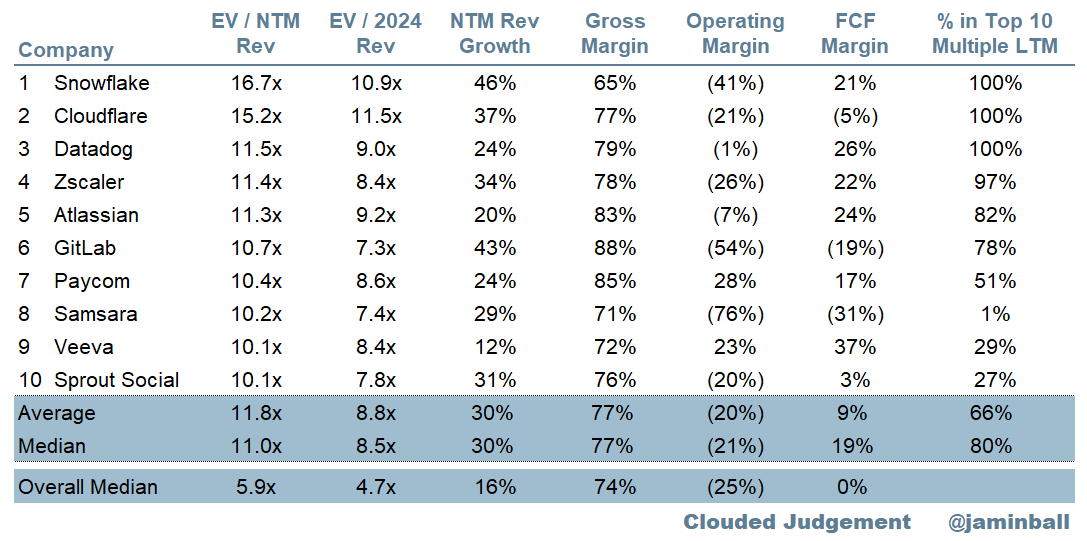
Top 10 EV / NTM Revenue Multiples
Top 10 Weekly Share Price Movement
Update on Multiples
SaaS businesses are generally valued on a multiple of their revenue - in most cases the projected revenue for the next 12 months. Revenue multiples are a shorthand valuation framework. Given most software companies are not profitable, or not generating meaningful FCF, it’s the only metric to compare the entire industry against. Even a DCF is riddled with long term assumptions. The promise of SaaS is that growth in the early years leads to profits in the mature years. Multiples shown below are calculated by taking the Enterprise Value (market cap + debt - cash) / NTM revenue.
Overall Stats:
Overall Median: 5.9x
Top 5 Median: 11.5x
10Y: 3.9%
Bucketed by Growth. In the buckets below I consider high growth >30% projected NTM growth, mid growth 15%-30% and low growth <15%
High Growth Median: 9.8x
Mid Growth Median: 6.0x
Low Growth Median: 3.5x
Scatter Plot of EV / NTM Rev Multiple vs NTM Rev Growth
How correlated is growth to valuation multiple?
Growth Adjusted EV / NTM Rev
The below chart shows the EV / NTM revenue multiple divided by NTM consensus growth expectations. The goal of this graph is to show how relatively cheap / expensive each stock is relative to their growth expectations
Operating Metrics
Median NTM growth rate: 16%
Median LTM growth rate: 27%
Median Gross Margin: 74%
Median Operating Margin (25%)
Median FCF Margin: 0%
Median Net Retention: 118%
Median CAC Payback: 30 months
Median S&M % Revenue: 47%
Median R&D % Revenue: 28%
Median G&A % Revenue: 19%
Comps Output
Rule of 40 shows LTM growth rate + LTM FCF Margin. FCF calculated as Cash Flow from Operations - Capital Expenditures
GM Adjusted Payback is calculated as: (Previous Q S&M) / (Net New ARR in Q x Gross Margin) x 12 . It shows the number of months it takes for a SaaS business to payback their fully burdened CAC on a gross profit basis. Most public companies don’t report net new ARR, so I’m taking an implied ARR metric (quarterly subscription revenue x 4). Net new ARR is simply the ARR of the current quarter, minus the ARR of the previous quarter. Companies that do not disclose subscription rev have been left out of the analysis and are listed as NA.
This post and the information presented are intended for informational purposes only. The views expressed herein are the author’s alone and do not constitute an offer to sell, or a recommendation to purchase, or a solicitation of an offer to buy, any security, nor a recommendation for any investment product or service. While certain information contained herein has been obtained from sources believed to be reliable, neither the author nor any of his employers or their affiliates have independently verified this information, and its accuracy and completeness cannot be guaranteed. Accordingly, no representation or warranty, express or implied, is made as to, and no reliance should be placed on, the fairness, accuracy, timeliness or completeness of this information. The author and all employers and their affiliated persons assume no liability for this information and no obligation to update the information or analysis contained herein in the future.


