Every week I’ll provide updates on the latest trends in cloud software companies. Follow along to stay up to date!
Digital Transformations vs Covid Pull Forward
Reflecting on digital transformations vs pull forward for cloud software over the long weekend - I think we've largely seen 3 different ways cloud software was affected by Covid:
1) Fake TAM creation
2) One time pull forward
3) Durable pull forward
I don't think any business was truly unaffected. Therefore, it's important to have a perspective on which bucket each company falls into when predicting what future growth will look like. This applies to both public and private businesses
Bucket 1: Fake Tam Creation:
This describes companies who acquired users / buyers of their software who never would have otherwise been users outside of Covid. The hard part about this bucket - post Covid churn is very high. Who might stick with new behavior vs revert? In hindsight it's easier to identify who falls into this bucket. In the moment it's always trickier. Zoom is probably the poster child for this bucket. Will the yoga studio continue broadcasting classes over the internet? Hard to say
Bucket 2: One Time Pull Forward:
I'm defining this bucket as companies that had a one-time shock of pull forward that only lasted ~1-2 years. Let's imagine a hypothetical company with 100 employees, with half using some sort of collaboration software. Maybe it was understood that over the next 1-2 years everyone in the company would become a user. But there was no urgency, and the roll out would be a slow and steady 1-2 years. With Covid, instead of taking 1-2 years to roll out to everyone, it took 6 months. The end state was the same - X users. But the time to get to X users happened much faster. Now apply this not to just 1 customer, but the collaboration software companies entire customer base. You get massive growth through Covid, and then a "slow down" as growth normalizes
Bucket 3: Durable Pull Forward
This bucket of companies are riding 5-10+ year trends. For the one time pull forward bucket I described an end state that would have taken 1-2 years to reach. For this bucket, we're taking about an end state that may take 10+ years to reach. An example would be the move to cloud data infrastructure. I'd argue these cloud migrations are inevitable, however they take way more than 1-2 years for the industry. They will be ongoing for a decade plus. So what was Covid's impact? It's almost impossible to pull forward a trend that big into 1-2 years. There simply isn't enough time for the change management / procurement to happen. While there was clearly pull forward over the last 1-2 years, the question is - how long will this continue?
My working assumption (like bucket 2) is that the pull forward will continue until we reach the natural end state. For the Durable Pull Forward bucket, this could still be for many years. Unlike bucket 2 which happened in 1-2 years, bucket 3 will take longer. How much longer is a key question. Is there another 1, 2, 3, 4 or more years of "juice" left in the pull forward? What inspired me to think about these buckets was AWS growth. Just a few quarters ago AWS was growing 28%. It's now growing 40% at >$70B run rate. If you stop and think about that, you'll realize how truly insane that acceleration is!! It shouldn't be possible!! Especially at that scale! There just had to be a real element of pull-forward to cause that shift in trajectory. But again, the key question is how long will this last? For the trend that AWS is riding, I don't see how it could only be a few years. The market is just way too large to reach closer to "end state" in a few years, regardless of the pace of the pull forward. We're 2 years in. Datadog is another example that comes to mind. They were growing 51% in Q1 '21. They just grew 84% in Q4 '21! Crazy!
There are many companies that fall into bucket 3. However, the range of duration of pull forward for all companies in that bucket is quite different. Some might last only another year. Others may last another 3-5 years. Having a perspective is important. Eventually we'll get back to "equilibrium." And at that point growth will follow more normal deceleration curves. And when that happens, multiples will fall. You want to get ahead of that! Look at Zoom's multiple mid pandemic vs now. When pull forward ends, growth / multiple fall. In the same way it seemed inevitable that we'd leave a ZIRP environment and rates would rise pulling growth multiples down...but how many got in front of that shift, even though it felt inevitable? Now more than ever it feels imperative to have a point of view on whether companies fall into bucket 2 or 3. I think it's already clear who's in bucket 1 (Fake TAM Creation). Harder to discern between bucket 2 and 3. Without doing this, it's hard to handicap how much past growth is an indicator for future growth.
This is very hard for me on the private side as well. Looking at companies around Series C, I have to have a POV on this. Let's take a hypothetical company that tripled ARR to $20M. Was that growth real? Or one-time pull forward? Are they riding a trend that will keep growth strong for the next 3-5 years, or peter out? With the massive valuations in private markets we have now you can't be wrong. There's never been a more interesting time to be investing in public and private cloud software businesses. In general I'd bucket application software into bucket 2, and cloud infra software into bucket 3. But it's never that easy / straightforward. There are always exceptions. Correctly identifying if businesses fall into bucket 2 (one time pull forward) vs bucket 3 (durable pull forward) will be the driving function between who does and doesn't generate returns. And it's hard! Rising tide of easy money from loose fiscal policy is over :)
Quarterly Reports Summary
Top 10 EV / NTM Revenue Multiples
Top 10 Weekly Share Price Movement
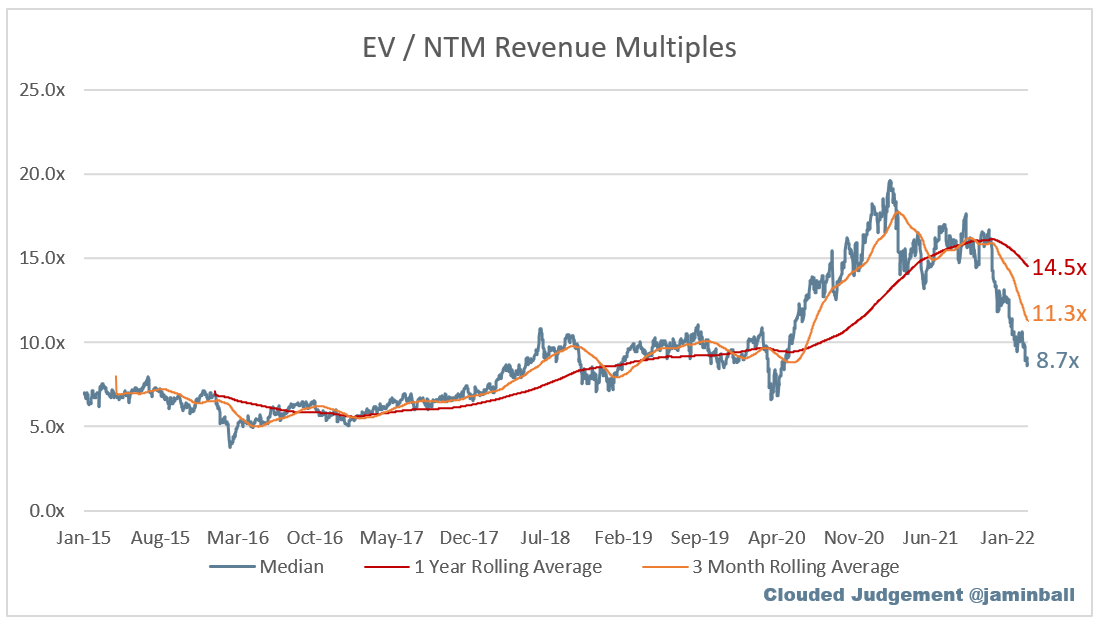
Update on Multiples
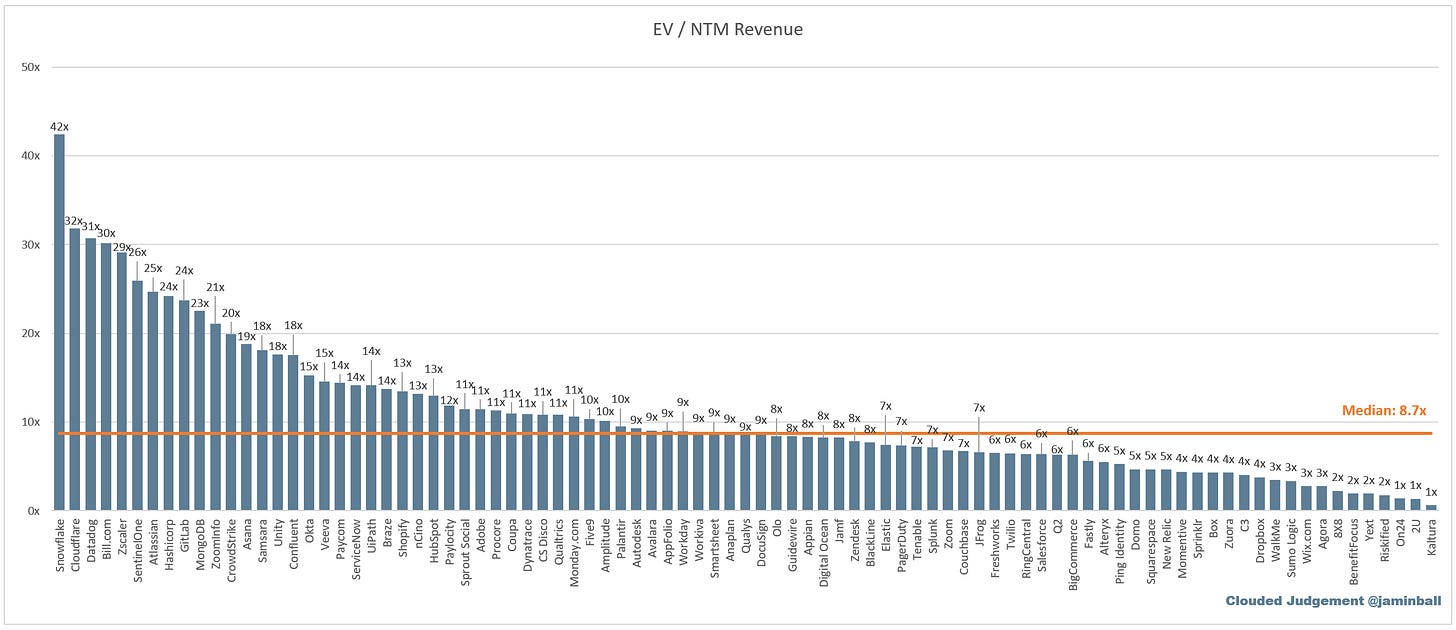
SaaS businesses are valued on a multiple of their revenue - in most cases the projected revenue for the next 12 months. Multiples shown below are calculated by taking the Enterprise Value (market cap + debt - cash) / NTM revenue.
Overall Stats:
Overall Median: 8.7x
Top 5 Median: 31.3x
3 Month Trailing Average: 11.3x
1 Year Trailing Average: 14.5x
Bucketed by Growth. In the buckets below I consider high growth >30% projected NTM growth, mid growth 15%-30% and low growth <15%
High Growth Median: 14.0x
Mid Growth Median: 8.4x
Low Growth Median: 3.3x
Scatter Plot of EV / NTM Rev Multiple vs NTM Rev Growth
How correlated is growth to valuation multiple?
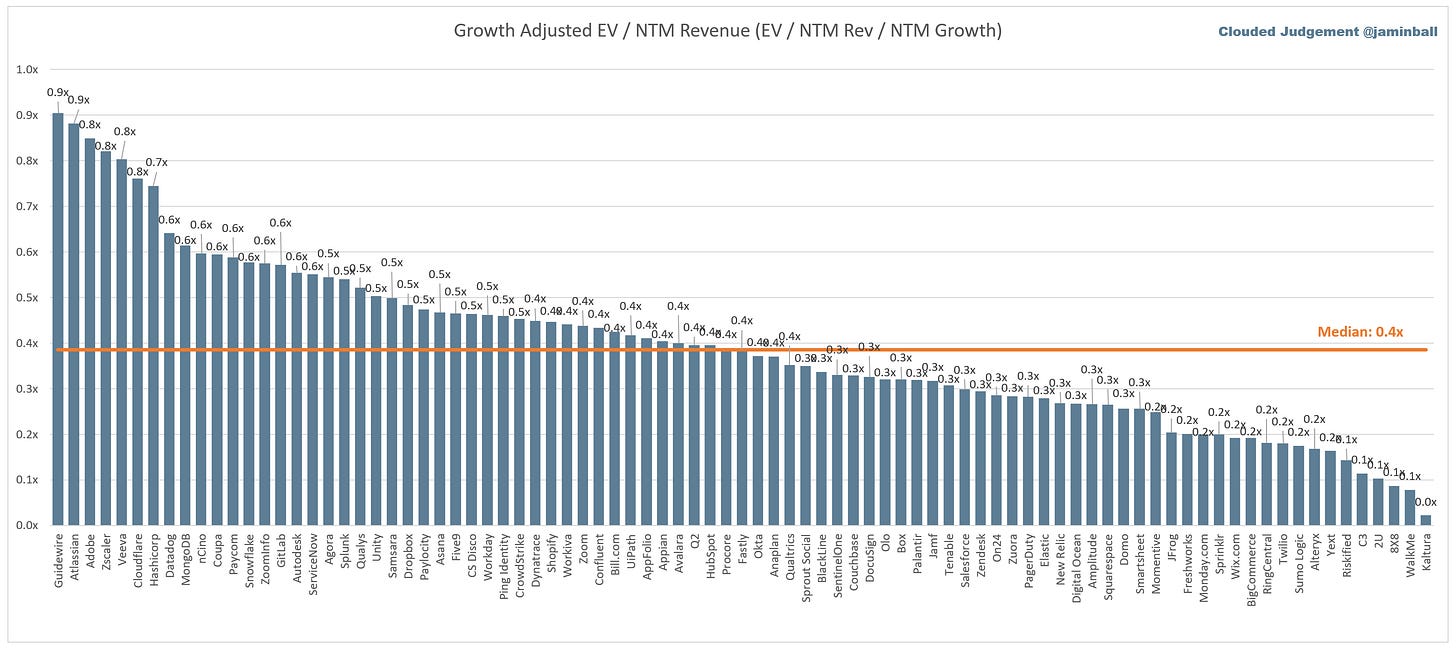
Growth Adjusted EV / NTM Rev
The below chart shows the EV / NTM revenue multiple divided by NTM consensus growth expectations. The goal of this graph is to show how relatively cheap / expensive each stock is relative to their growth expectations
Operating Metrics
Median NTM growth rate: 26%
Median LTM growth rate: 33%
Median Gross Margin: 75%
Median Operating Margin (22%)
Median FCF Margin: 3%
Median Net Retention: 120%
Median CAC Payback: 24 months
Median S&M % Revenue: 45%
Median R&D % Revenue: 26%
Median G&A % Revenue: 19%
Comps Output
Rule of 40 shows LTM growth rate + LTM FCF Margin. FCF calculated as Cash Flow from Operations - Capital Expenditures
GM Adjusted Payback is calculated as: (Previous Q S&M) / (Net New ARR in Q x Gross Margin) x 12 . It shows the number of months it takes for a SaaS business to payback their fully burdened CAC on a gross profit basis. Most public companies don’t report net new ARR, so I’m taking an implied ARR metric (quarterly subscription revenue x 4). Net new ARR is simply the ARR of the current quarter, minus the ARR of the previous quarter. Companies that do not disclose subscription rev have been left out of the analysis and are listed as NA.
This post and the information presented are intended for informational purposes only. The views expressed herein are the author’s alone and do not constitute an offer to sell, or a recommendation to purchase, or a solicitation of an offer to buy, any security, nor a recommendation for any investment product or service. While certain information contained herein has been obtained from sources believed to be reliable, neither the author nor any of his employers or their affiliates have independently verified this information, and its accuracy and completeness cannot be guaranteed. Accordingly, no representation or warranty, express or implied, is made as to, and no reliance should be placed on, the fairness, accuracy, timeliness or completeness of this information. The author and all employers and their affiliated persons assume no liability for this information and no obligation to update the information or analysis contained herein in the future.


Such an interesting point about the split between those three categories. Could not agree more.
CaC payback calculation: Can you please explain why are you multiplying the ratio by 12? isn't it on quarterly basis and there you will need to divide this figure by 4? (assuming I have ARR figures and not a proxy)