
Clouded Judgement 2.28.25 - Max Uncertainty

Every week I’ll provide updates on the latest trends in cloud software companies. Follow along to stay up to date!
Max Uncertainty
We seem to be entering a “risk off” market. There are a number of factors adding to the uncertainty, but the three biggest in my opinion (that also happen to be related) are:
Political: What is Trump going to do with tariffs & what are the impacts of DOGE and pulling out that much government spend in the time frame they’re discussing
Economic: What is happening to economic growth
Technology: What is happening with AI and what impacts will it have
Trump has been talking a big game with respect to tariffs - Canada, Mexico, EU, China, Chips, etc etc. And there seems to be two camps - those who believe him (ie believe he really wants to make tariffs a material source of revenue for the country), and those who don’t believe him (ie think he’s just talking a big game - creating a controversy so he can create a solution). I happen to find myself believing he’s quite serious and plans to make these tangible and real. The question then becomes - what happens next? Are those tariffs passed along to the end buyer (ie United States consumers) of goods being imported into the US meaning prices & inflation rise? Do these goods become unaffordable? Do exporters (ie those selling goods to the US) who are faced with these tariffs increase their own prices to help offset, and if so do US sellers of these goods then have to eat that higher cost? The answer to all of these questions go deeper into economic research. But what’s clear is there’s a debate.
Then there’s DOGE and economic growth. Government spend is not immaterial. Cutting out hundreds of billions of government spend will have trickle down effects. What could those be? Proponents of DOGE love fixing the bloated spend, and driving the country back to budget neutral. Those who oppose it often argue the short term shock of this kind of rapid spend cutting is dangerous. At the end of the day it’s hard to cut that much spend and not have it impact short term economic growth.
And the we have technology risk. What kind of creative destruction will happen from AI? OR - what kind of air pocket are we getting to and when will we see ROI! There are two sides to this debate as well…
Regardless of your views on any of these topics one thing is clear - they are strong debates with strong opinions on either side. the 10Y has fallen from >4.6% to <4.3% in just two weeks in the face of all of this. The Nasdaq has dropped >5% in just over a week. There’s max uncertainty! And when there’s uncertainty on so many dimensions, it’s easier to take a “wait and see” approach when it comes to the equity markets.
The 10Y move is interesting though - in this case it appears rates are falling due to concerns over economic growth. If growth really starts to slow, lower rates could be needed to stimulate the economy. OR, lower growth would lead to lower inflation and removes the need for more restrictive (ie higher) rates. And then there’s the worst case of economic growth slowing and inflation remaining sticky! The whispers of stagflation are creeping back up.
What I tried to highlight in this post is the breadth and depth of the uncertainty that exists in the markets today. A lot of eyes were on the Nvidia quarter they reported on Wednesday. Seemed like a solid quarter but the stock fell off ~9% on Thursday. Lots of risk being taken off the table. Quarters are being sold.
Related aside: I enjoyed this chart that Brad shared a couple weeks ago on the birth of the “external revenue service.”

Quarterly Reports Summary

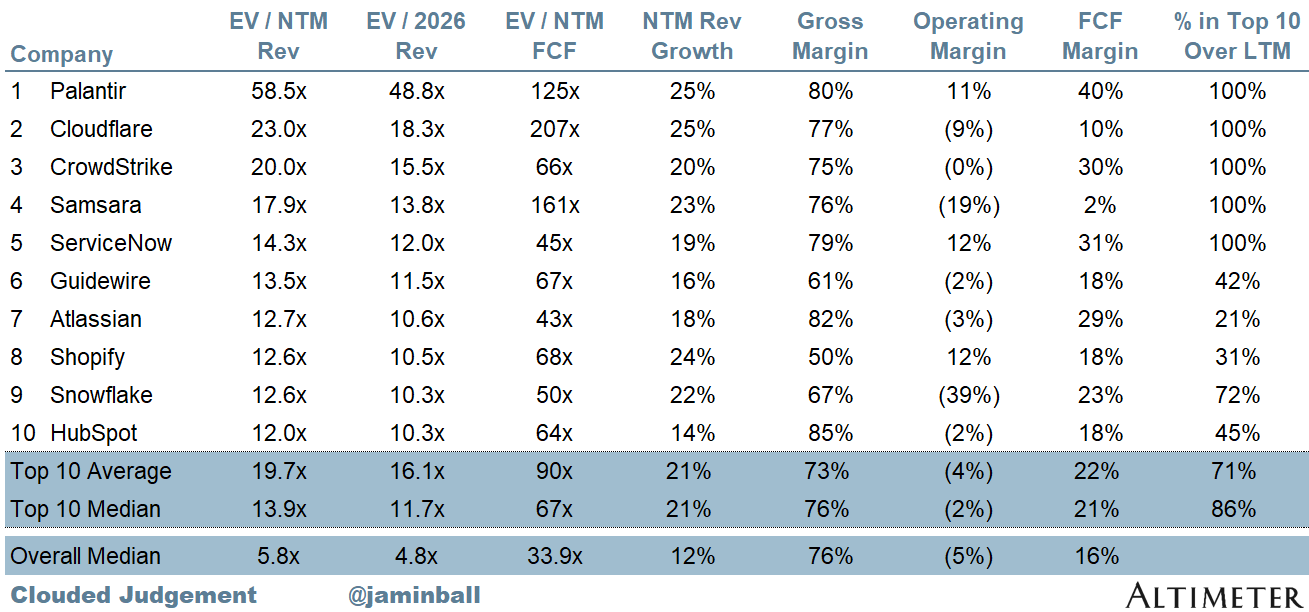
Top 10 EV / NTM Revenue Multiples
Top 10 Weekly Share Price Movement

Update on Multiples
SaaS businesses are generally valued on a multiple of their revenue - in most cases the projected revenue for the next 12 months. Revenue multiples are a shorthand valuation framework. Given most software companies are not profitable, or not generating meaningful FCF, it’s the only metric to compare the entire industry against. Even a DCF is riddled with long term assumptions. The promise of SaaS is that growth in the early years leads to profits in the mature years. Multiples shown below are calculated by taking the Enterprise Value (market cap + debt - cash) / NTM revenue.
Overall Stats:
Overall Median: 5.8x
Top 5 Median: 20.0x
10Y: 4.3%


Bucketed by Growth. In the buckets below I consider high growth >27% projected NTM growth (I had to update this, as there’s only 1 company projected to grow >30% after this quarter’s earnings), mid growth 15%-27% and low growth <15%
High Growth Median: 11.2x
Mid Growth Median: 10.0x
Low Growth Median: 4.4x


EV / NTM Rev / NTM Growth
The below chart shows the EV / NTM revenue multiple divided by NTM consensus growth expectations. So a company trading at 20x NTM revenue that is projected to grow 100% would be trading at 0.2x. The goal of this graph is to show how relatively cheap / expensive each stock is relative to their growth expectations


EV / NTM FCF
The line chart shows the median of all companies with a FCF multiple >0x and <100x.

Companies with negative NTM FCF are not listed on the chart

Scatter Plot of EV / NTM Rev Multiple vs NTM Rev Growth
How correlated is growth to valuation multiple?

Operating Metrics
Median NTM growth rate: 12%
Median LTM growth rate: 15%
Median Gross Margin: 76%
Median Operating Margin (7%)
Median FCF Margin: 16%
Median Net Retention: 108%
Median CAC Payback: 40 months
Median S&M % Revenue: 38%
Median R&D % Revenue: 25%
Median G&A % Revenue: 16%
Comps Output
Rule of 40 shows rev growth + FCF margin (both LTM and NTM for growth + margins). FCF calculated as Cash Flow from Operations - Capital Expenditures
GM Adjusted Payback is calculated as: (Previous Q S&M) / (Net New ARR in Q x Gross Margin) x 12 . It shows the number of months it takes for a SaaS business to payback their fully burdened CAC on a gross profit basis. Most public companies don’t report net new ARR, so I’m taking an implied ARR metric (quarterly subscription revenue x 4). Net new ARR is simply the ARR of the current quarter, minus the ARR of the previous quarter. Companies that do not disclose subscription rev have been left out of the analysis and are listed as NA.


Sources used in this post include Bloomberg, Pitchbook and company filings
The information presented in this newsletter is the opinion of the author and does not necessarily reflect the view of any other person or entity, including Altimeter Capital Management, LP ("Altimeter"). The information provided is believed to be from reliable sources but no liability is accepted for any inaccuracies. This is for information purposes and should not be construed as an investment recommendation. Past performance is no guarantee of future performance. Altimeter is an investment adviser registered with the U.S. Securities and Exchange Commission. Registration does not imply a certain level of skill or training.
This post and the information presented are intended for informational purposes only. The views expressed herein are the author’s alone and do not constitute an offer to sell, or a recommendation to purchase, or a solicitation of an offer to buy, any security, nor a recommendation for any investment product or service. While certain information contained herein has been obtained from sources believed to be reliable, neither the author nor any of his employers or their affiliates have independently verified this information, and its accuracy and completeness cannot be guaranteed. Accordingly, no representation or warranty, express or implied, is made as to, and no reliance should be placed on, the fairness, accuracy, timeliness or completeness of this information. The author and all employers and their affiliated persons assume no liability for this information and no obligation to update the information or analysis contained herein in the future.