


Clouded Judgement 2.7.25 - "Group + Triage" AI Systems

Every week I’ll provide updates on the latest trends in cloud software companies. Follow along to stay up to date!
“Grouping + AI” for Triage
One area I’m quite excited to see AI revolutionize is “grouping + triage” workflows. There are so many of these workflows out there today, and many of them are quite manual. These seem like perfect fits for LLM based applicatiosn. Here are a couple examples:
Grouping security alerts (by the same root cause) and triaging / prioritizing so the SOC analysts know where to focus first
Support tickets: Group and then triage customer support tickets so agents are responding to the most critical and impactful tickets first
Product feature requests: Group and prioritize features requests. Signal can come from many places (sales team notes, customer support tickets, etc)
IT Incident Management: Similar to the security alert example. Group related incidents or tickets by severity to help prioritize.
Fraud detection: Group suspicious activity, transactions, etc based on behavioral patterns and prioritize the most probably fraud cases to review / action
Recruiting: Group similar applicants, rank them based on job fit, and highlight most promising candidates
Supply chain logistics: Group similar disruption reports (port congestions, delivery delays, etc), predict cascading impact, and prioritize which to focus on
Sales lead qualification: triage inbound leads based on a number of intent signals, prioritize those most likely to convert, and route to right AE
Content moderation: cluster flagged content by violation type, triage by severity, and prioritize the review by a human (or an AI)
eCommerce return & refund triage: group returns by common patters, flag potential fraud, and prioritize high-value customers for white glove services
Legal document review: group similar legal documents based on case relevance, and flag high-priority issues (ex compliance risks, breaches, urgent disputes, etc)
Insurance: too many examples to list around claims processing and management!
The list goes on. There are so many others. What do all of these have in common? Generally you need to aggregate data from a number of places to “group.” Then you need some sort of insights to triage / prioritize. Perfect for a LLM! Many of the examples I listed above have had solutions for a long time. Many of them AI based. However, there is still a TON of manual work / “tribal knowledge” that is relied upon / passed down from employee to employee to manage. I do think LLMs will really help turbo charge these markets though, and finally make the solutions actually useful.
And here’s what gets me really excited - grouping + triage is just step 1. Basically any workflow that starts with “group + triage” then leads to “action.” You group a IT incident, triage it - then take action to help resolve / remediate. You group support tickets, prioritize and then take action to respond. Etc. The solutions today that start with a “group + triage” workflow are PERFECT fits to add agent capabilities next. Group the alerts, triage them, then launch an agent to go fix it! The unlock here of “group + triage + agent” will be the backbone for the next wave of software.
If you’re building companies in these spaces, I’d love to chat to learn more!
Cloud Giants Report Q4 ‘24
We now have the quarterly reports from Amazon, Microsoft and Google. They each have some of the largest cloud businesses in the world in AWS, Azure and Google Cloud respectively. Overall, there was weakness across the board. Not the best start to cloud software earnings season! Here’s a quick summary of their results:
AWS (Amazon): $115B run rate growing 19% YoY (last Q grew 19%)
Azure (Microsoft): ~$74B run rate (estimate) growing 31% YoY (last Q grew 34% cc)
Google Cloud (includes GSuite): $48B run rate growing 30% YoY (last Q grew 35%, neither are cc)
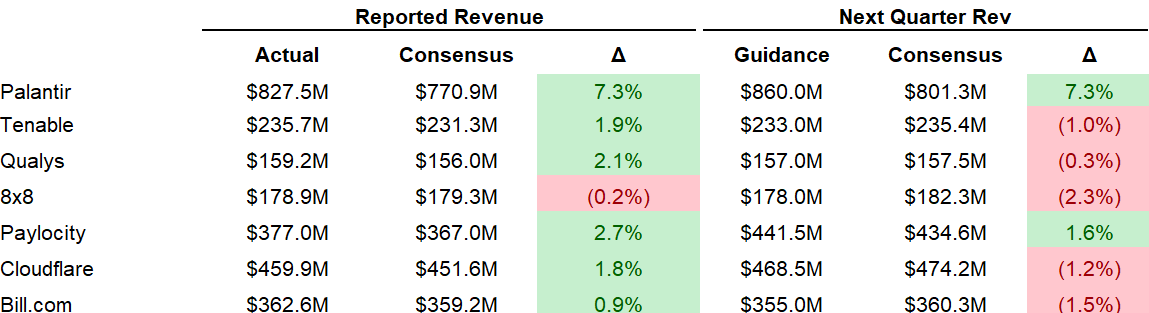
Quarterly Reports Summary
Top 10 EV / NTM Revenue Multiples

Top 10 Weekly Share Price Movement

Update on Multiples
SaaS businesses are generally valued on a multiple of their revenue - in most cases the projected revenue for the next 12 months. Revenue multiples are a shorthand valuation framework. Given most software companies are not profitable, or not generating meaningful FCF, it’s the only metric to compare the entire industry against. Even a DCF is riddled with long term assumptions. The promise of SaaS is that growth in the early years leads to profits in the mature years. Multiples shown below are calculated by taking the Enterprise Value (market cap + debt - cash) / NTM revenue.
Overall Stats:
Overall Median: 6.3x
Top 5 Median: 22.2x
10Y: 4.4%


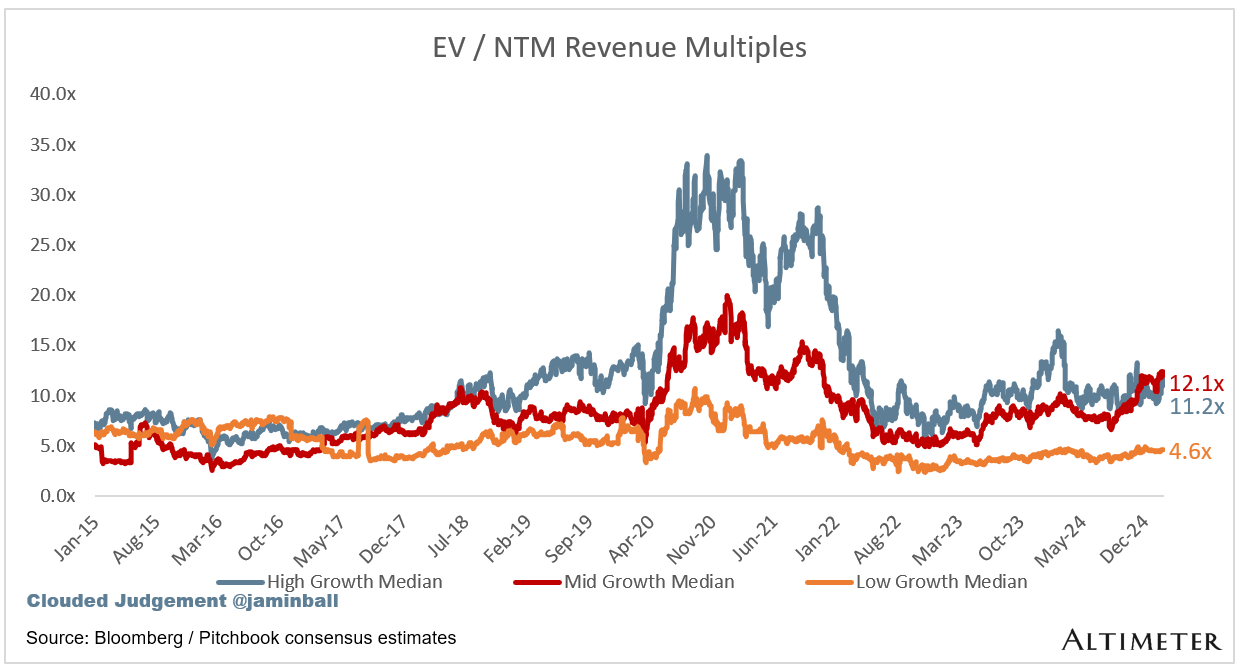
Bucketed by Growth. In the buckets below I consider high growth >27% projected NTM growth (I had to update this, as there’s only 1 company projected to grow >30% after this quarter’s earnings), mid growth 15%-27% and low growth <15%
High Growth Median: 11.2x
Mid Growth Median: 12.1x
Low Growth Median: 4.6x

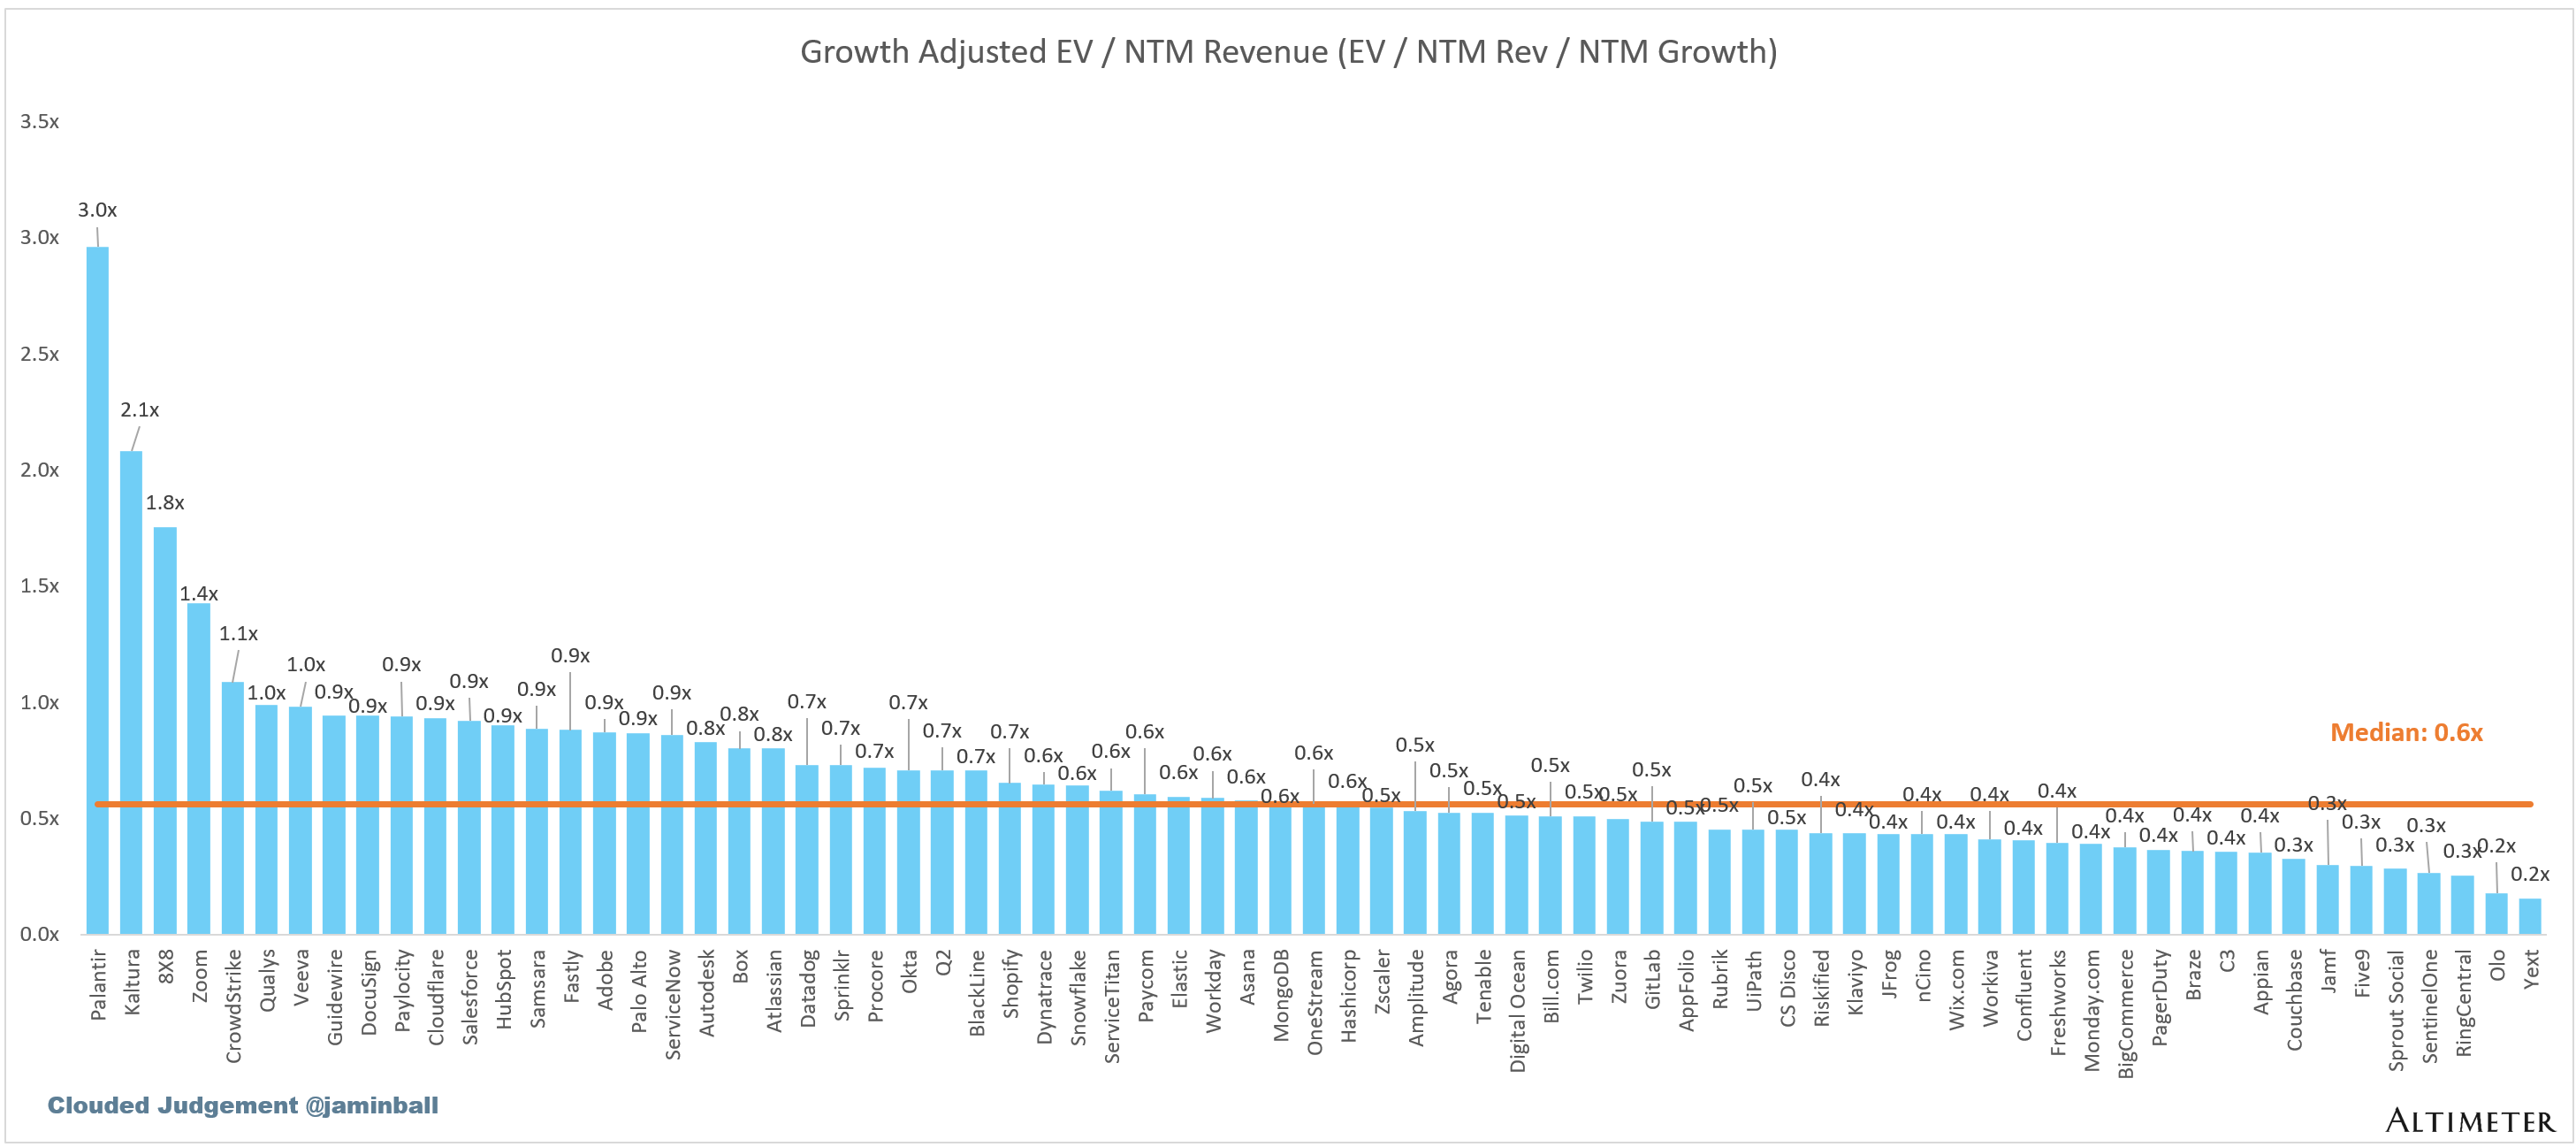
EV / NTM Rev / NTM Growth
The below chart shows the EV / NTM revenue multiple divided by NTM consensus growth expectations. So a company trading at 20x NTM revenue that is projected to grow 100% would be trading at 0.2x. The goal of this graph is to show how relatively cheap / expensive each stock is relative to their growth expectations

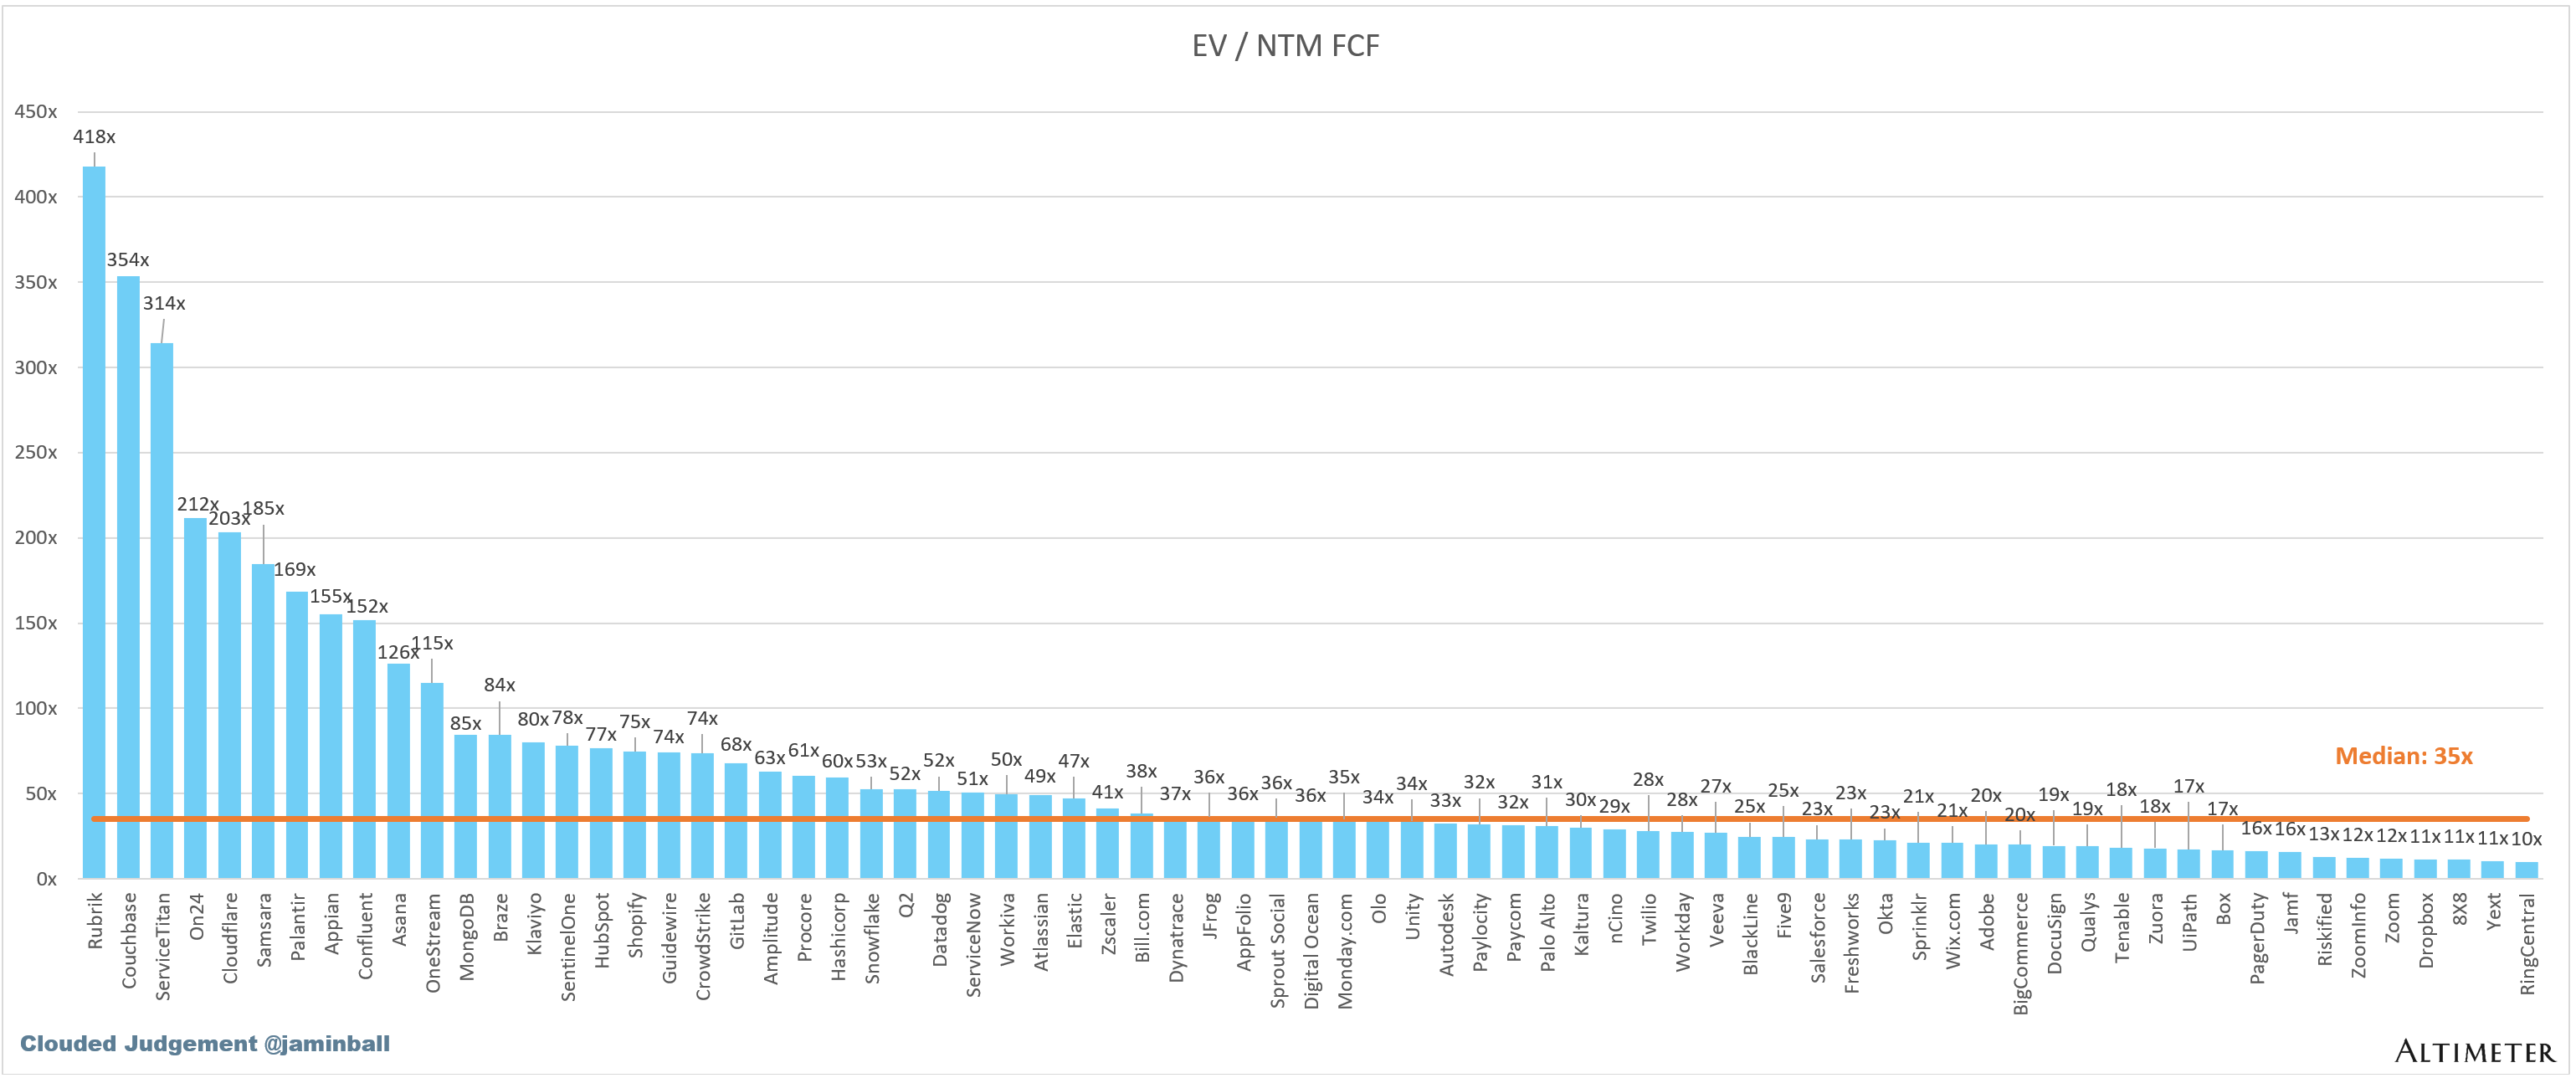
EV / NTM FCF
The line chart shows the median of all companies with a FCF multiple >0x and <100x. I created this subset to show companies where FCF is a relevant valuation metric.

Companies with negative NTM FCF are not listed on the chart
Scatter Plot of EV / NTM Rev Multiple vs NTM Rev Growth
How correlated is growth to valuation multiple?

Operating Metrics
Median NTM growth rate: 12%
Median LTM growth rate: 15%
Median Gross Margin: 76%
Median Operating Margin (7%)
Median FCF Margin: 16%
Median Net Retention: 109%
Median CAC Payback: 40 months
Median S&M % Revenue: 39%
Median R&D % Revenue: 25%
Median G&A % Revenue: 17%
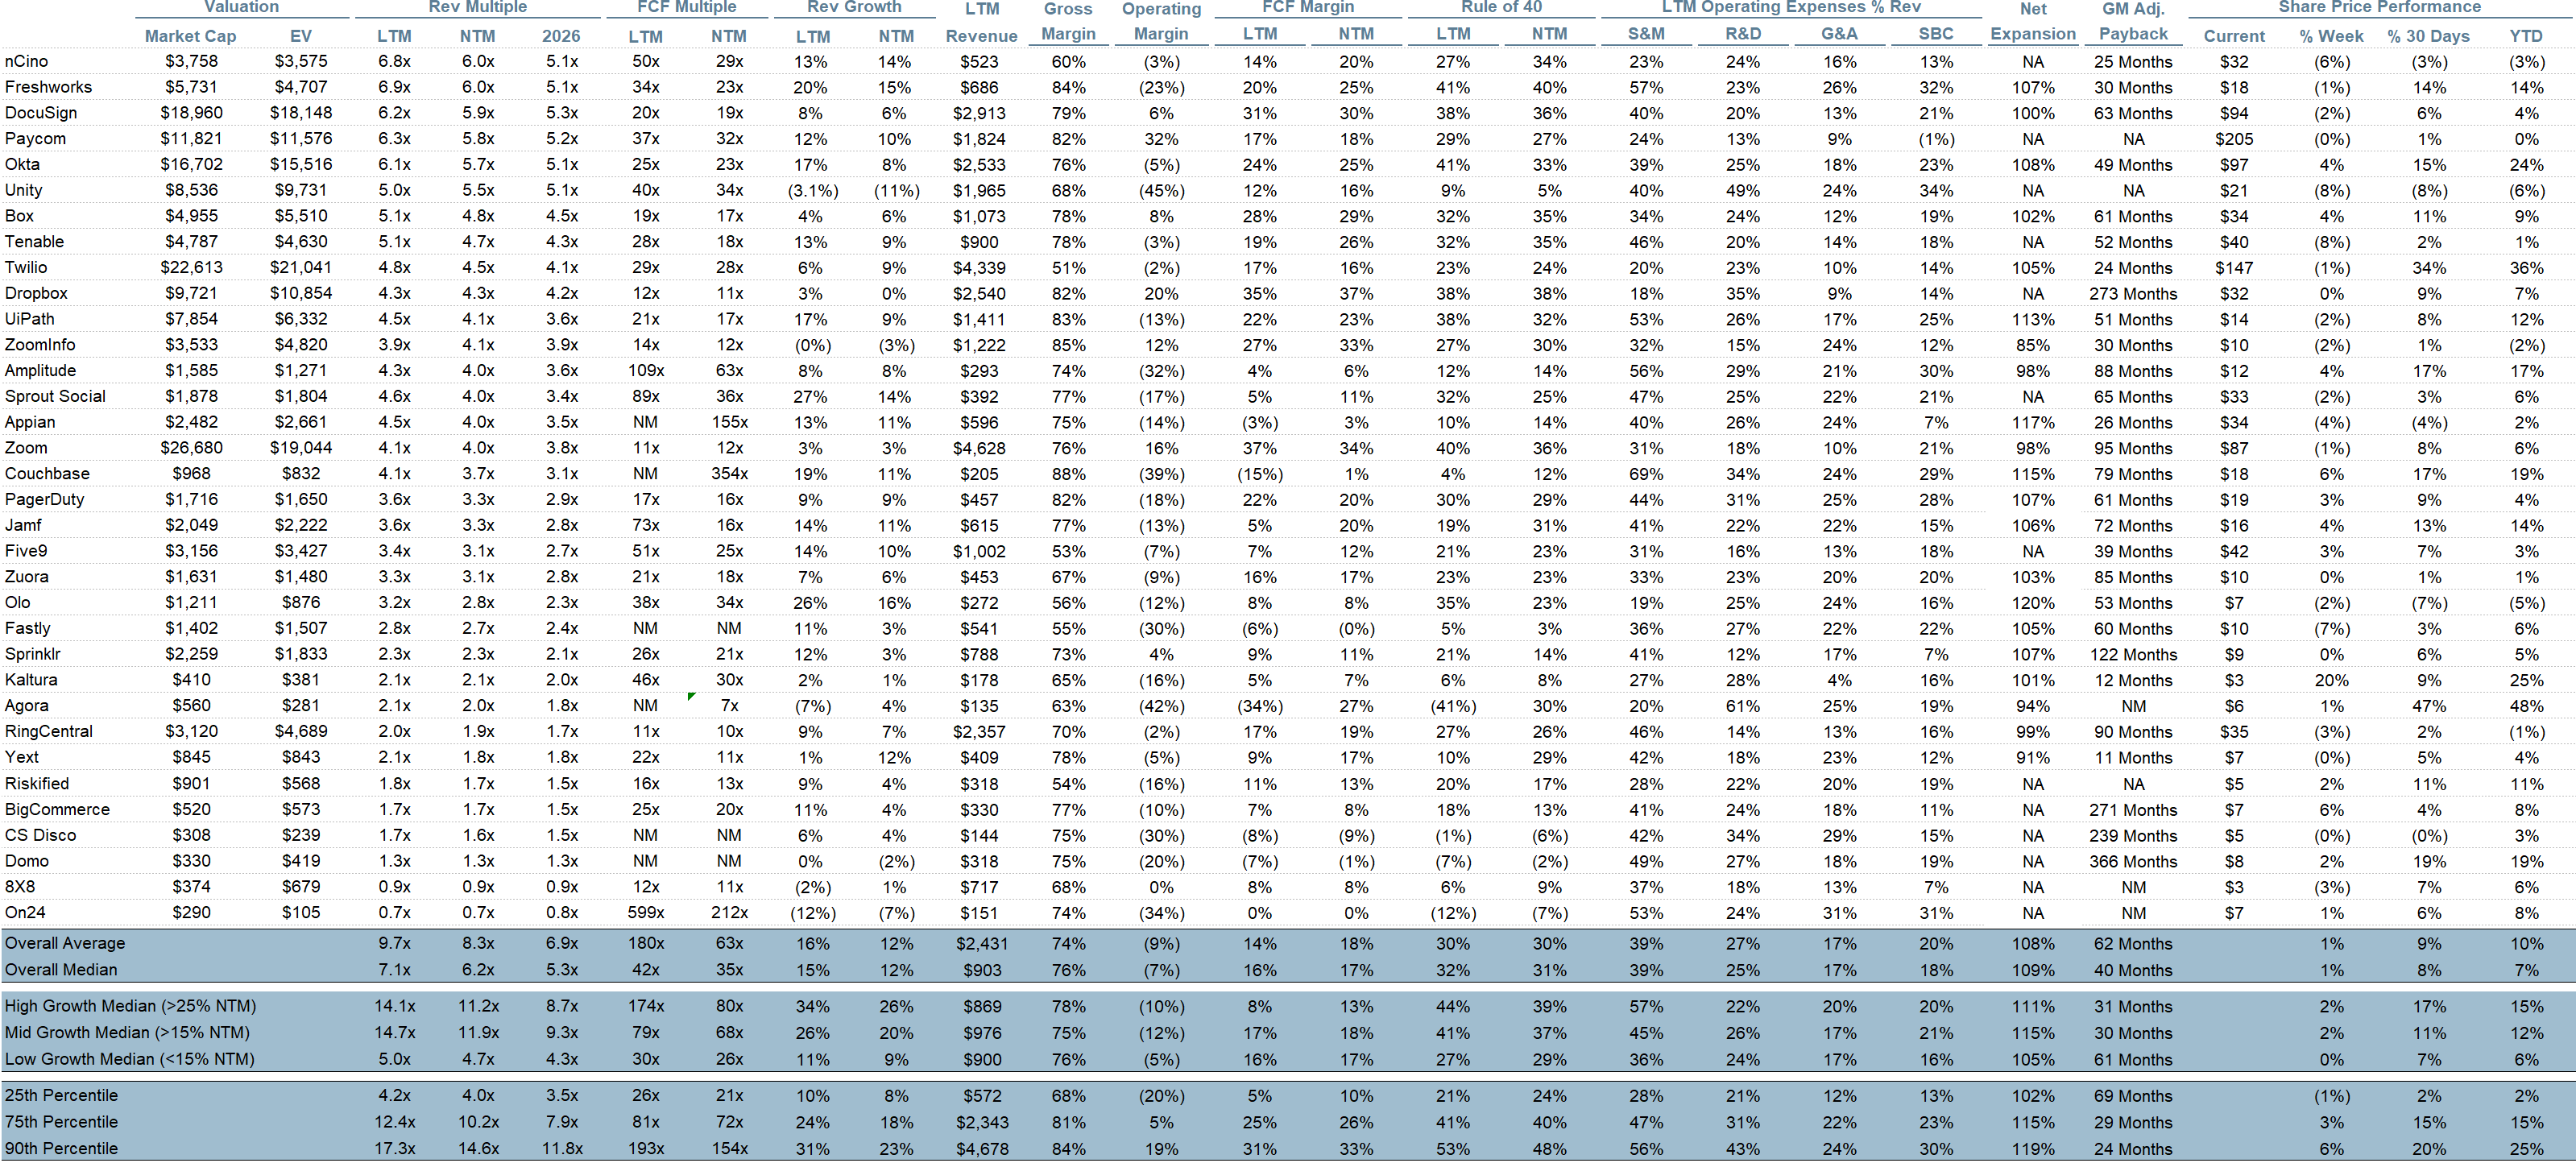
Comps Output
Rule of 40 shows rev growth + FCF margin (both LTM and NTM for growth + margins). FCF calculated as Cash Flow from Operations - Capital Expenditures
GM Adjusted Payback is calculated as: (Previous Q S&M) / (Net New ARR in Q x Gross Margin) x 12 . It shows the number of months it takes for a SaaS business to payback their fully burdened CAC on a gross profit basis. Most public companies don’t report net new ARR, so I’m taking an implied ARR metric (quarterly subscription revenue x 4). Net new ARR is simply the ARR of the current quarter, minus the ARR of the previous quarter. Companies that do not disclose subscription rev have been left out of the analysis and are listed as NA.

Sources used in this post include Bloomberg, Pitchbook and company filings
The information presented in this newsletter is the opinion of the author and does not necessarily reflect the view of any other person or entity, including Altimeter Capital Management, LP ("Altimeter"). The information provided is believed to be from reliable sources but no liability is accepted for any inaccuracies. This is for information purposes and should not be construed as an investment recommendation. Past performance is no guarantee of future performance. Altimeter is an investment adviser registered with the U.S. Securities and Exchange Commission. Registration does not imply a certain level of skill or training.
This post and the information presented are intended for informational purposes only. The views expressed herein are the author’s alone and do not constitute an offer to sell, or a recommendation to purchase, or a solicitation of an offer to buy, any security, nor a recommendation for any investment product or service. While certain information contained herein has been obtained from sources believed to be reliable, neither the author nor any of his employers or their affiliates have independently verified this information, and its accuracy and completeness cannot be guaranteed. Accordingly, no representation or warranty, express or implied, is made as to, and no reliance should be placed on, the fairness, accuracy, timeliness or completeness of this information. The author and all employers and their affiliated persons assume no liability for this information and no obligation to update the information or analysis contained herein in the future.
Outstanding as always, thank you!
Would be interesting with some NRR analysis (as it's one of your favourite metrics!).
For example, correlation between NRR and valuation. And % of growth contributed to NRR
Check out Jeff Towson for his take on AI commercial applications in China. They seem to be way ahead of "the west". He's American but has worked in digital tech in SE Asia for many years.