


Clouded Judgement 3.21.25 - M&A Roars Back

Every week I’ll provide updates on the latest trends in cloud software companies. Follow along to stay up to date!
M&A is Back!
We’ve seen a ton of M&A in the first quarter of the year. Will the floodgates open? Probably depends on whether the deals make it through regulatory approval. If they do, I expect a lot more M&A activity to follow. Some highlights:
Wiz acquired by Google for $32B
Ampere Computing acquired by SoftBank for $6.5B
Moveworks acquired by ServiceNow for $2.9B
NextInsurance acquired by Munich Re for $2.6B
Weights and Biases acquired by Coreweave for $1.7B
NinjaTrader acquired by Kraken for $1.5B
Gretel acquired by Nvidia. Price undisclosed but sounds like >$300m
DataStax acquired by IBM. Price undisclosed but sounds like >$1B
M&A has followed an interesting arc over the last ~20 years. A while back companies companies built platforms through M&A. They build organically, but also acquired their way into new products and markets. Salesforce is a great example. They built out their core CRM capabilities, but expanded into analytics when they acquired Tableau, expanded into integration when they acquired Mulesoft, and expanded into communication when they acquired Slack. With more recent cloud software companies, there was a lot of organic expansion - ie expanding into new markets and capabilities through internal product development. Datadog is a great example of this. They started with infrastructure monitoring, and then organically built out application performance monitoring (APM), logging, cloud security solutions, ITSM offerings, etc. I do wonder if the pendulum will start to swing back to inorganic expansion as the cloud platform companies who were founded 10-15 years ago start to see growth slow and look at inorganic opportunities to continue their expansion. OR - if earlier stage companies (not startups, but companies in the $5-$20b valuation range) look to inorganic expansion earlier than they would have otherwise in a more M&A friendly environment. There are also a lot of “zombie” point solutions stuck in the ~$100-$300m ARR range who probably don’t have much of an independent future, but would be quite valuable as part of a broader platform. For private companies in this bucket - this may be your window. Better to be on the front end of it, otherwise you risk missing the wave.
Either way - there was lots of questions about whether this new administration would result in more M&A. So far, the answer seems to be a clear yes. We’ll see what happens over the coming years, but I expect to see more M&A than IPOs in terms of an exit environment in the short term.
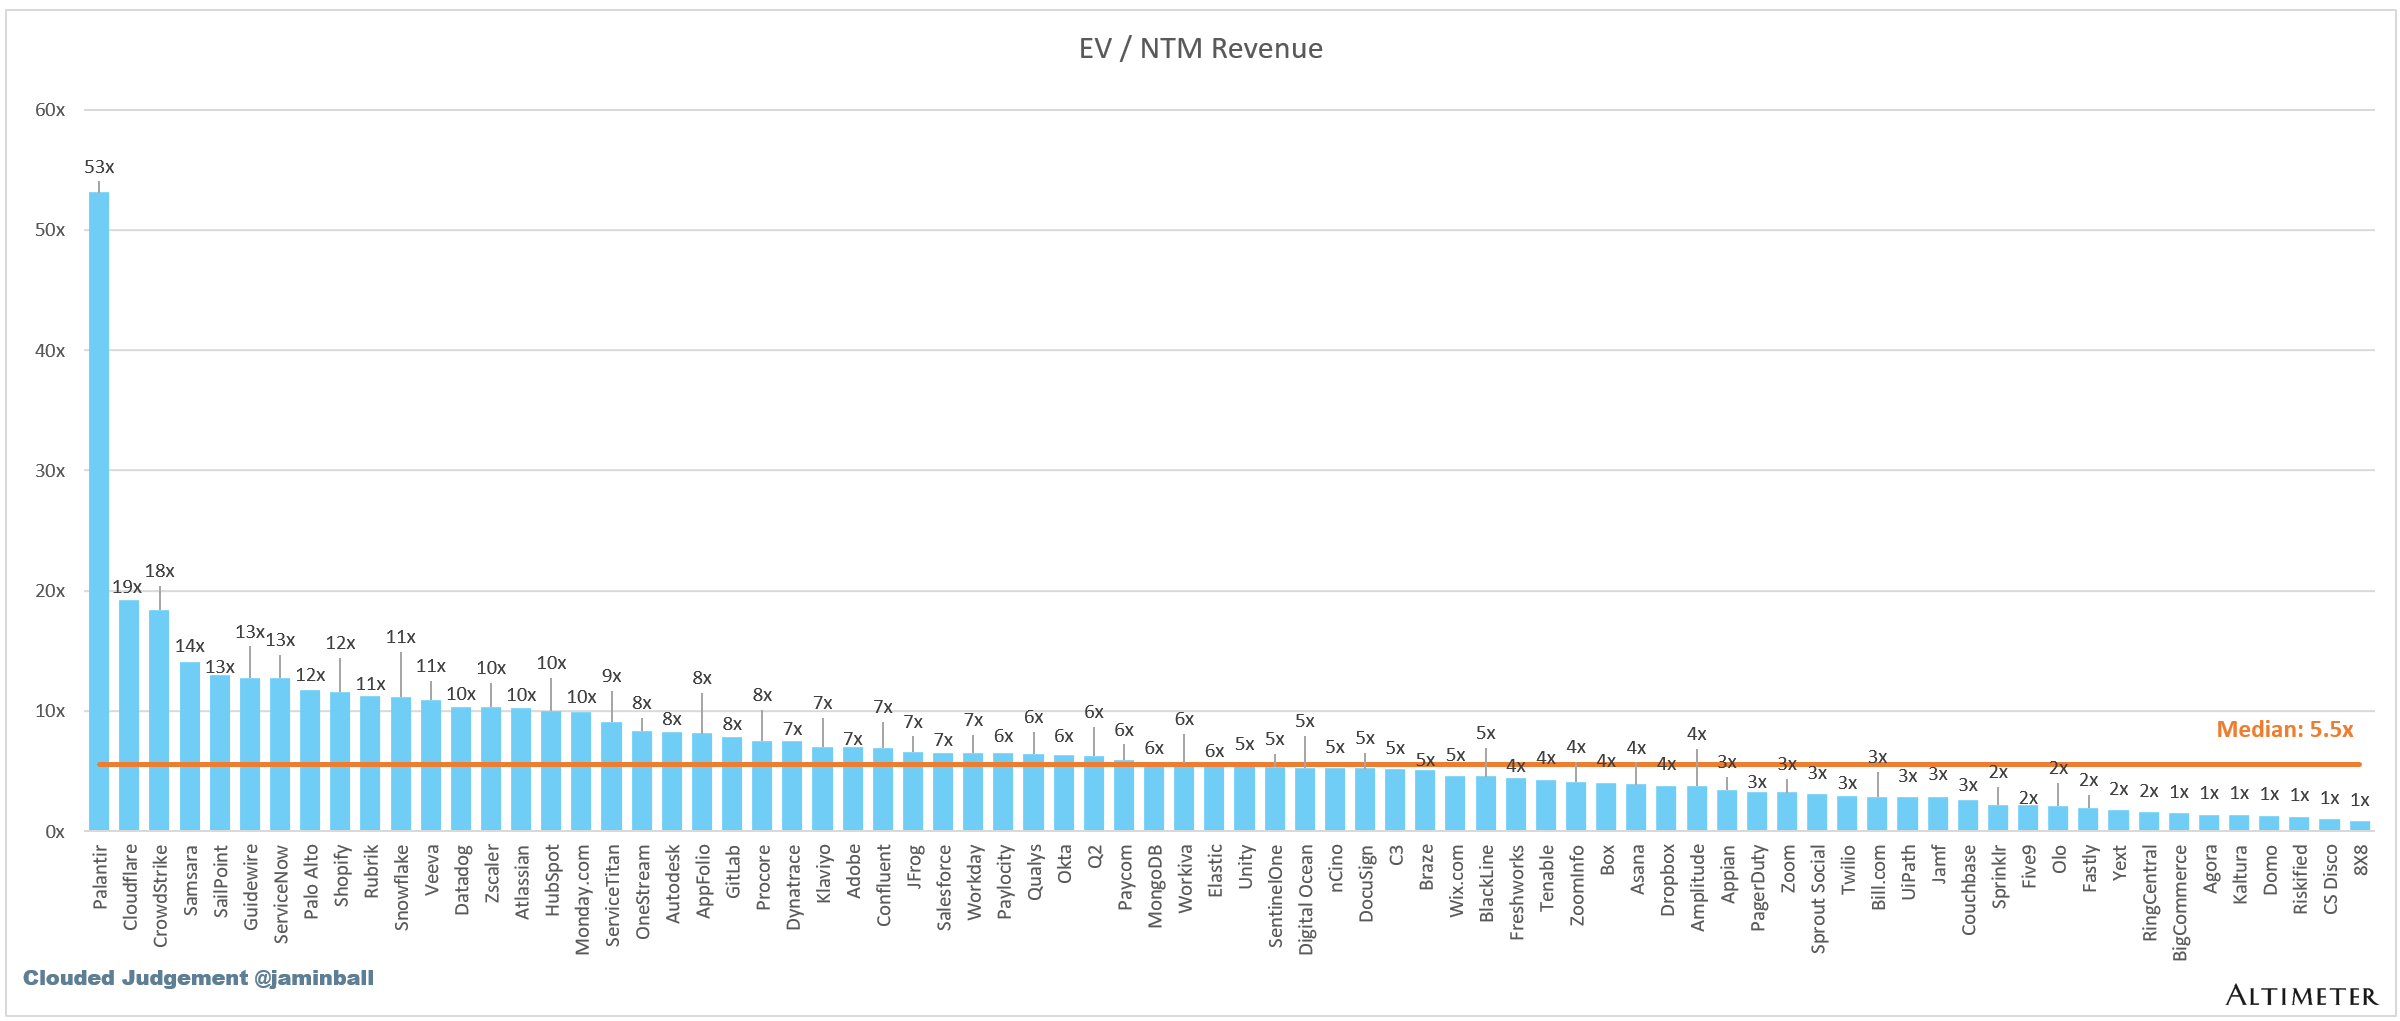
Top 10 EV / NTM Revenue Multiples

Top 10 Weekly Share Price Movement

Update on Multiples
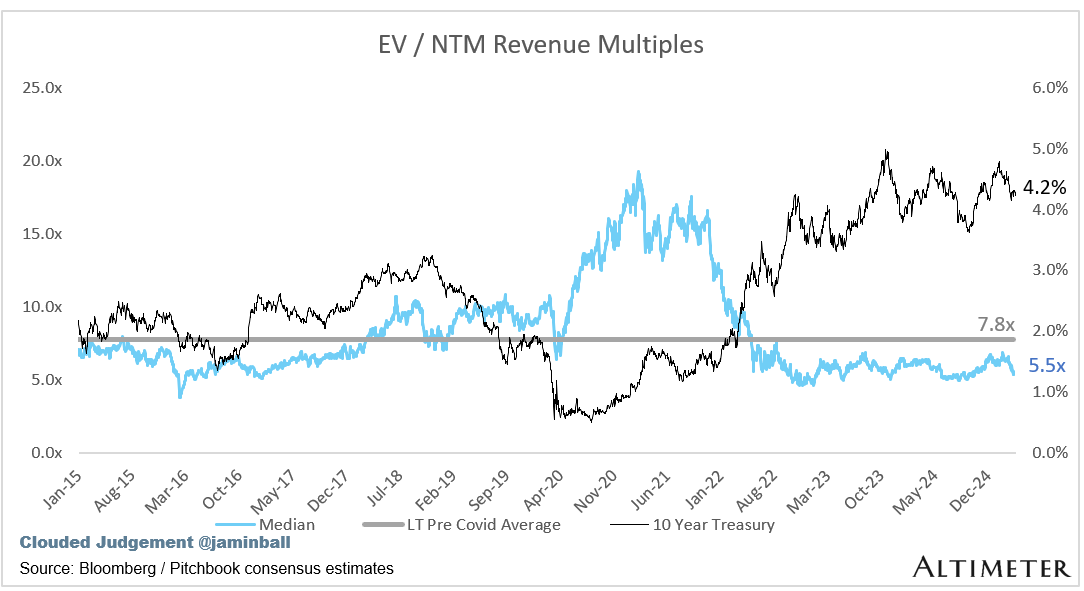
SaaS businesses are generally valued on a multiple of their revenue - in most cases the projected revenue for the next 12 months. Revenue multiples are a shorthand valuation framework. Given most software companies are not profitable, or not generating meaningful FCF, it’s the only metric to compare the entire industry against. Even a DCF is riddled with long term assumptions. The promise of SaaS is that growth in the early years leads to profits in the mature years. Multiples shown below are calculated by taking the Enterprise Value (market cap + debt - cash) / NTM revenue.
Overall Stats:
Overall Median: 5.5x
Top 5 Median: 18.4x
10Y: 4.2%

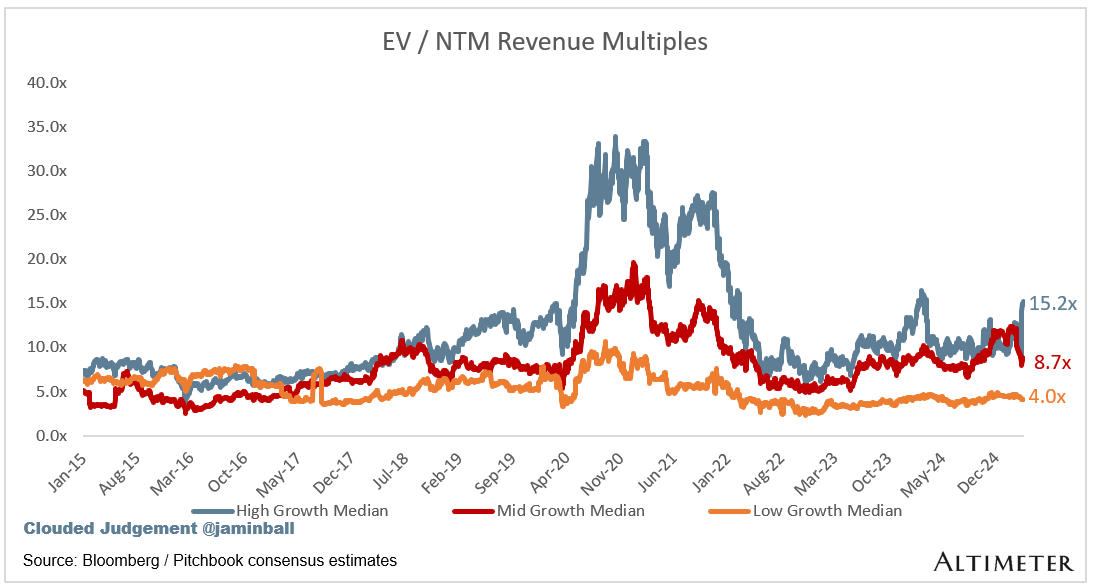
Bucketed by Growth. In the buckets below I consider high growth >27% projected NTM growth (I had to update this, as there’s only 1 company projected to grow >30% after this quarter’s earnings), mid growth 15%-27% and low growth <15%
High Growth Median: 15.2x
Mid Growth Median: 8.7x
Low Growth Median: 4.0x
EV / NTM Rev / NTM Growth
The below chart shows the EV / NTM revenue multiple divided by NTM consensus growth expectations. So a company trading at 20x NTM revenue that is projected to grow 100% would be trading at 0.2x. The goal of this graph is to show how relatively cheap / expensive each stock is relative to their growth expectations


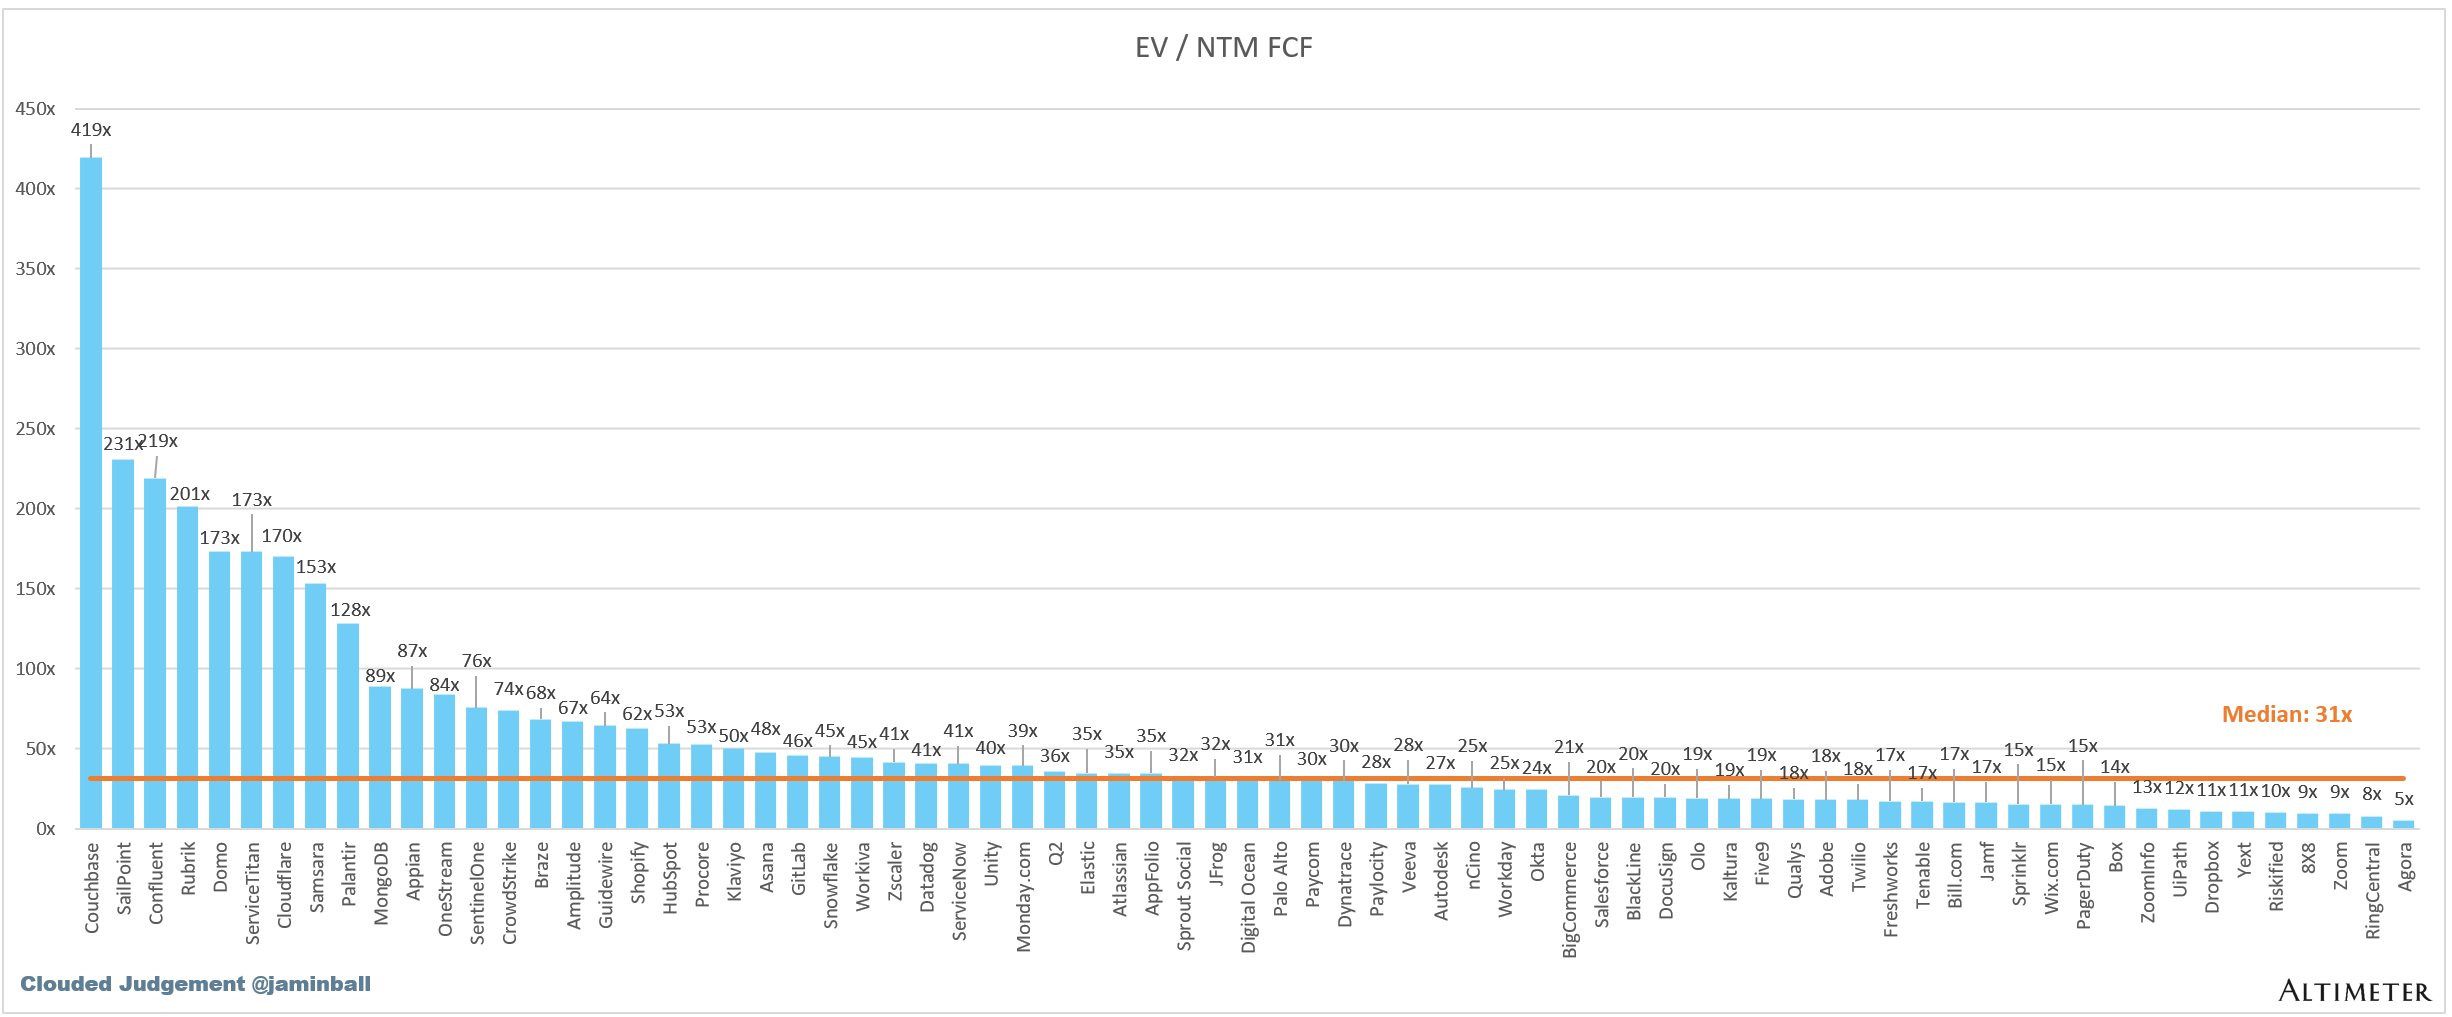
EV / NTM FCF
The line chart shows the median of all companies with a FCF multiple >0x and <100x. I created this subset to show companies where FCF is a relevant valuation metric.

Companies with negative NTM FCF are not listed on the chart
Scatter Plot of EV / NTM Rev Multiple vs NTM Rev Growth
How correlated is growth to valuation multiple?

Operating Metrics
Median NTM growth rate: 12%
Median LTM growth rate: 15%
Median Gross Margin: 76%
Median Operating Margin (6%)
Median FCF Margin: 16%
Median Net Retention: 108%
Median CAC Payback: 45 months
Median S&M % Revenue: 39%
Median R&D % Revenue: 25%
Median G&A % Revenue: 16%
Comps Output
Rule of 40 shows rev growth + FCF margin (both LTM and NTM for growth + margins). FCF calculated as Cash Flow from Operations - Capital Expenditures
GM Adjusted Payback is calculated as: (Previous Q S&M) / (Net New ARR in Q x Gross Margin) x 12 . It shows the number of months it takes for a SaaS business to payback their fully burdened CAC on a gross profit basis. Most public companies don’t report net new ARR, so I’m taking an implied ARR metric (quarterly subscription revenue x 4). Net new ARR is simply the ARR of the current quarter, minus the ARR of the previous quarter. Companies that do not disclose subscription rev have been left out of the analysis and are listed as NA.


Sources used in this post include Bloomberg, Pitchbook and company filings
The information presented in this newsletter is the opinion of the author and does not necessarily reflect the view of any other person or entity, including Altimeter Capital Management, LP ("Altimeter"). The information provided is believed to be from reliable sources but no liability is accepted for any inaccuracies. This is for information purposes and should not be construed as an investment recommendation. Past performance is no guarantee of future performance. Altimeter is an investment adviser registered with the U.S. Securities and Exchange Commission. Registration does not imply a certain level of skill or training.
This post and the information presented are intended for informational purposes only. The views expressed herein are the author’s alone and do not constitute an offer to sell, or a recommendation to purchase, or a solicitation of an offer to buy, any security, nor a recommendation for any investment product or service. While certain information contained herein has been obtained from sources believed to be reliable, neither the author nor any of his employers or their affiliates have independently verified this information, and its accuracy and completeness cannot be guaranteed. Accordingly, no representation or warranty, express or implied, is made as to, and no reliance should be placed on, the fairness, accuracy, timeliness or completeness of this information. The author and all employers and their affiliated persons assume no liability for this information and no obligation to update the information or analysis contained herein in the future.
Any personal guesses or bets on which companies will be acquired next? During its last ASM, Thoma Bravo made it very clear that they're actively looking to acquire high-quality software companies with a market cap of $1 billion or more. What do you reckon? Can large PE firms outcompete the very large, usual suspects?
same here, " Slack is a great example.". I guess you wanted to write Salesforce, but Slack sneaked in first :-) Lmk when you update it and I'll delete both comments