


Clouded Judgement - 3.28.25 - The New AI Risk Curve

Every week I’ll provide updates on the latest trends in cloud software companies. Follow along to stay up to date!
The New AI Risk Curve: Why AI Startups Grow Faster—and Fade Faster
One thing I’ve been thinking a lot about recently (and having conversations with other investors about frequently) is the juxtaposition of:
AI companies growing faster than companies from prior cycles
AI companies will have more “false starts” than companies from prior cycles
When I say “false starts” I mean companies that grow to a scale where they appear to have escape velocity, only to studder, slow, and then even start to see declining revenue. Data from Stripe (below) shows the speed at which AI native companies are growing compared to SaaS companies.

Let’s rewind the clock back to the pre-cloud days. Starting and scaling a software company was really hard. If you wanted to scale users and growth, you needed to scale a physical data infrastructure footprint. This required a lot of planning, time, resources and costs. It wasn’t very elastic. If we look at the NetSuite S-1 (filed in 2007) they said this:
“We use a single data center to deliver our services. Any disruption of service at this facility could harm our business….We currently intend to add a second data center facility in 2008, the primary purpose of which is to add capacity. This additional facility may be costly and may not be operational in a timely manner in the event our primary data center facility is not operating properly or is no longer available to us.”
This used to be how companies scaled! So what was the implication? If you, as a software company, got to a certain scale and brand awareness, it was really hard for others to catch you. It simply took too much time to start a competitor, build a product, build a brand, and compete. So once you hit escape velocity, it was hard for that momentum to slow down. The inertia was significant. To make this concrete - if a company got to say ~$25-50m in revenue (I’m making this number up, it’s just illustrative), someone else who is considering competing might be persuaded against it. By the time they got their competitor up and off the ground, that first mover may already be at $100m+ in revenue and at escape velocity. So why try and compete now? This dynamic enabled companies to hit escape velocity sooner in their lifecycle.
Fast forward to the launch of AWS and the public cloud. All of a sudden, it got a lot easier to launch and scale a company. You didn’t have to commit to a large physical infrastructure buildout. Your compute and storage resources scaled elastically with your demand, and even more important the fixed costs of starting up plummeted. Now, you still had to go out and hire engineers to build the product, build out the GTM team to build brand and distribution, etc. There’s was lots of work. The barriers to starting a company dropped exponentially. The bar to hitting escape velocity went up (in SaaS companies vs their on prem counterparts). The bar went up, because now if a company hits ~$25m in revenue, you know as a new competitor you could still catch them before they hit escape velocity. But there still was (generally) an escape velocity point - it may have just been later on. If it was $25m in revenue for on prem companies maybe it’s $100m for SaaS companies (again, just making that number up, but using the relative difference to make the point). If you hit some threshold of revenue, odds are you were going to keep compounding.
Now let’s talk about the AI wave. There was an exponential drop off in costs / complexity to start a company going from on prem to cloud. And now there’s another exponential drop off in complexity to start a company going from the cloud world to the AI native world. Compute / Storage constraints were greatly reduced with the cloud. And now, engineering and distribution (go-to-market) constraints are greatly reduced with AI. Solutions like Cursor, Codeium, GitHub copilot, etc greatly democratized engineering. The explosion of AI GTM solutions is dizzying. Whether it’s automated content generation (ie marketing content), AI SDRs and AEs, data enrichment funnels, etc it’s now possible for companies to scale their brand / distribution incredibly quickly.
What does this mean? It means it’s even harder to hit escape velocity for AI companies (where you pass the point of anyone reasonably being able to catch you). Someone can always catch you. Someone could build a better solution in a short period of time and commoditize the market. The incentives to start a competing business to an on prem software company that hit $25m in revenue were low. By the time you had scaled up an offering the other company already hit escape velocity. In the AI world, you’re never too late. And this is where it gets tricky as an investor. A lot of the AI world is greenfield. Companies aren’t just a “marginally better SaaS offering than 10 other companies” but something that is enabling a greenfield use case. The buying cycles in greenfield use cases are insanely fast. You’re not offboarding a vendor, not thinking about switching costs, and your boss asked you for this functionality yesterday.
So you can’t apply the same pattern match to AI company scaling that existed in SaaS company scaling. AI companies are scaling much faster. But they are also failing much faster. Failing may be too harsh of a term - but an AI company that scaled to $50m of ARR in 3 years may see their revenue decline in year 4. That was unheard of in the SaaS world. And revenue could decline for multiple reasons. That piece of technology was commoditized by an AI lab. Or that piece of infrastructure is no longer needed and there’s a different architectural approach everyone takes. The technology sands are shifting so quickly. “Spreadsheet investors” will be crushed in this environment.
Anyway, just some observations I wanted to pass along. It’s never felt harder to spot durable growth and moats. But I’ve never seen companies scaling as fast as AI companies are today. The opportunity set seems as attractive as it’s ever been, but the risk also seems higher. That juxtaposition is what makes investing in venture markets these days so fun!
Quarterly Reports Summary

Top 10 EV / NTM Revenue Multiples

Top 10 Weekly Share Price Movement

Update on Multiples
SaaS businesses are generally valued on a multiple of their revenue - in most cases the projected revenue for the next 12 months. Revenue multiples are a shorthand valuation framework. Given most software companies are not profitable, or not generating meaningful FCF, it’s the only metric to compare the entire industry against. Even a DCF is riddled with long term assumptions. The promise of SaaS is that growth in the early years leads to profits in the mature years. Multiples shown below are calculated by taking the Enterprise Value (market cap + debt - cash) / NTM revenue.
Overall Stats:
Overall Median: 5.6x
Top 5 Median: 18.3x
10Y: 4.4%


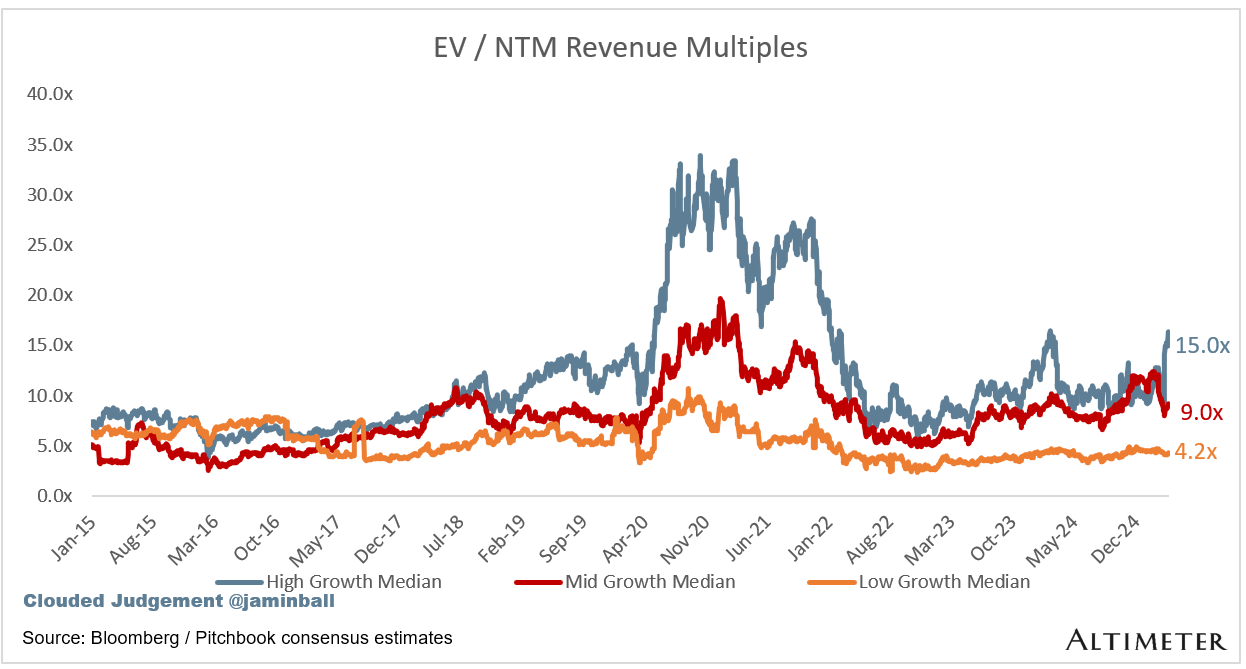
Bucketed by Growth. In the buckets below I consider high growth >27% projected NTM growth (I had to update this, as there’s only 1 company projected to grow >30% after this quarter’s earnings), mid growth 15%-27% and low growth <15%
High Growth Median: 15.0x
Mid Growth Median: 9.0x
Low Growth Median: 4.2x

EV / NTM Rev / NTM Growth
The below chart shows the EV / NTM revenue multiple divided by NTM consensus growth expectations. So a company trading at 20x NTM revenue that is projected to grow 100% would be trading at 0.2x. The goal of this graph is to show how relatively cheap / expensive each stock is relative to their growth expectations


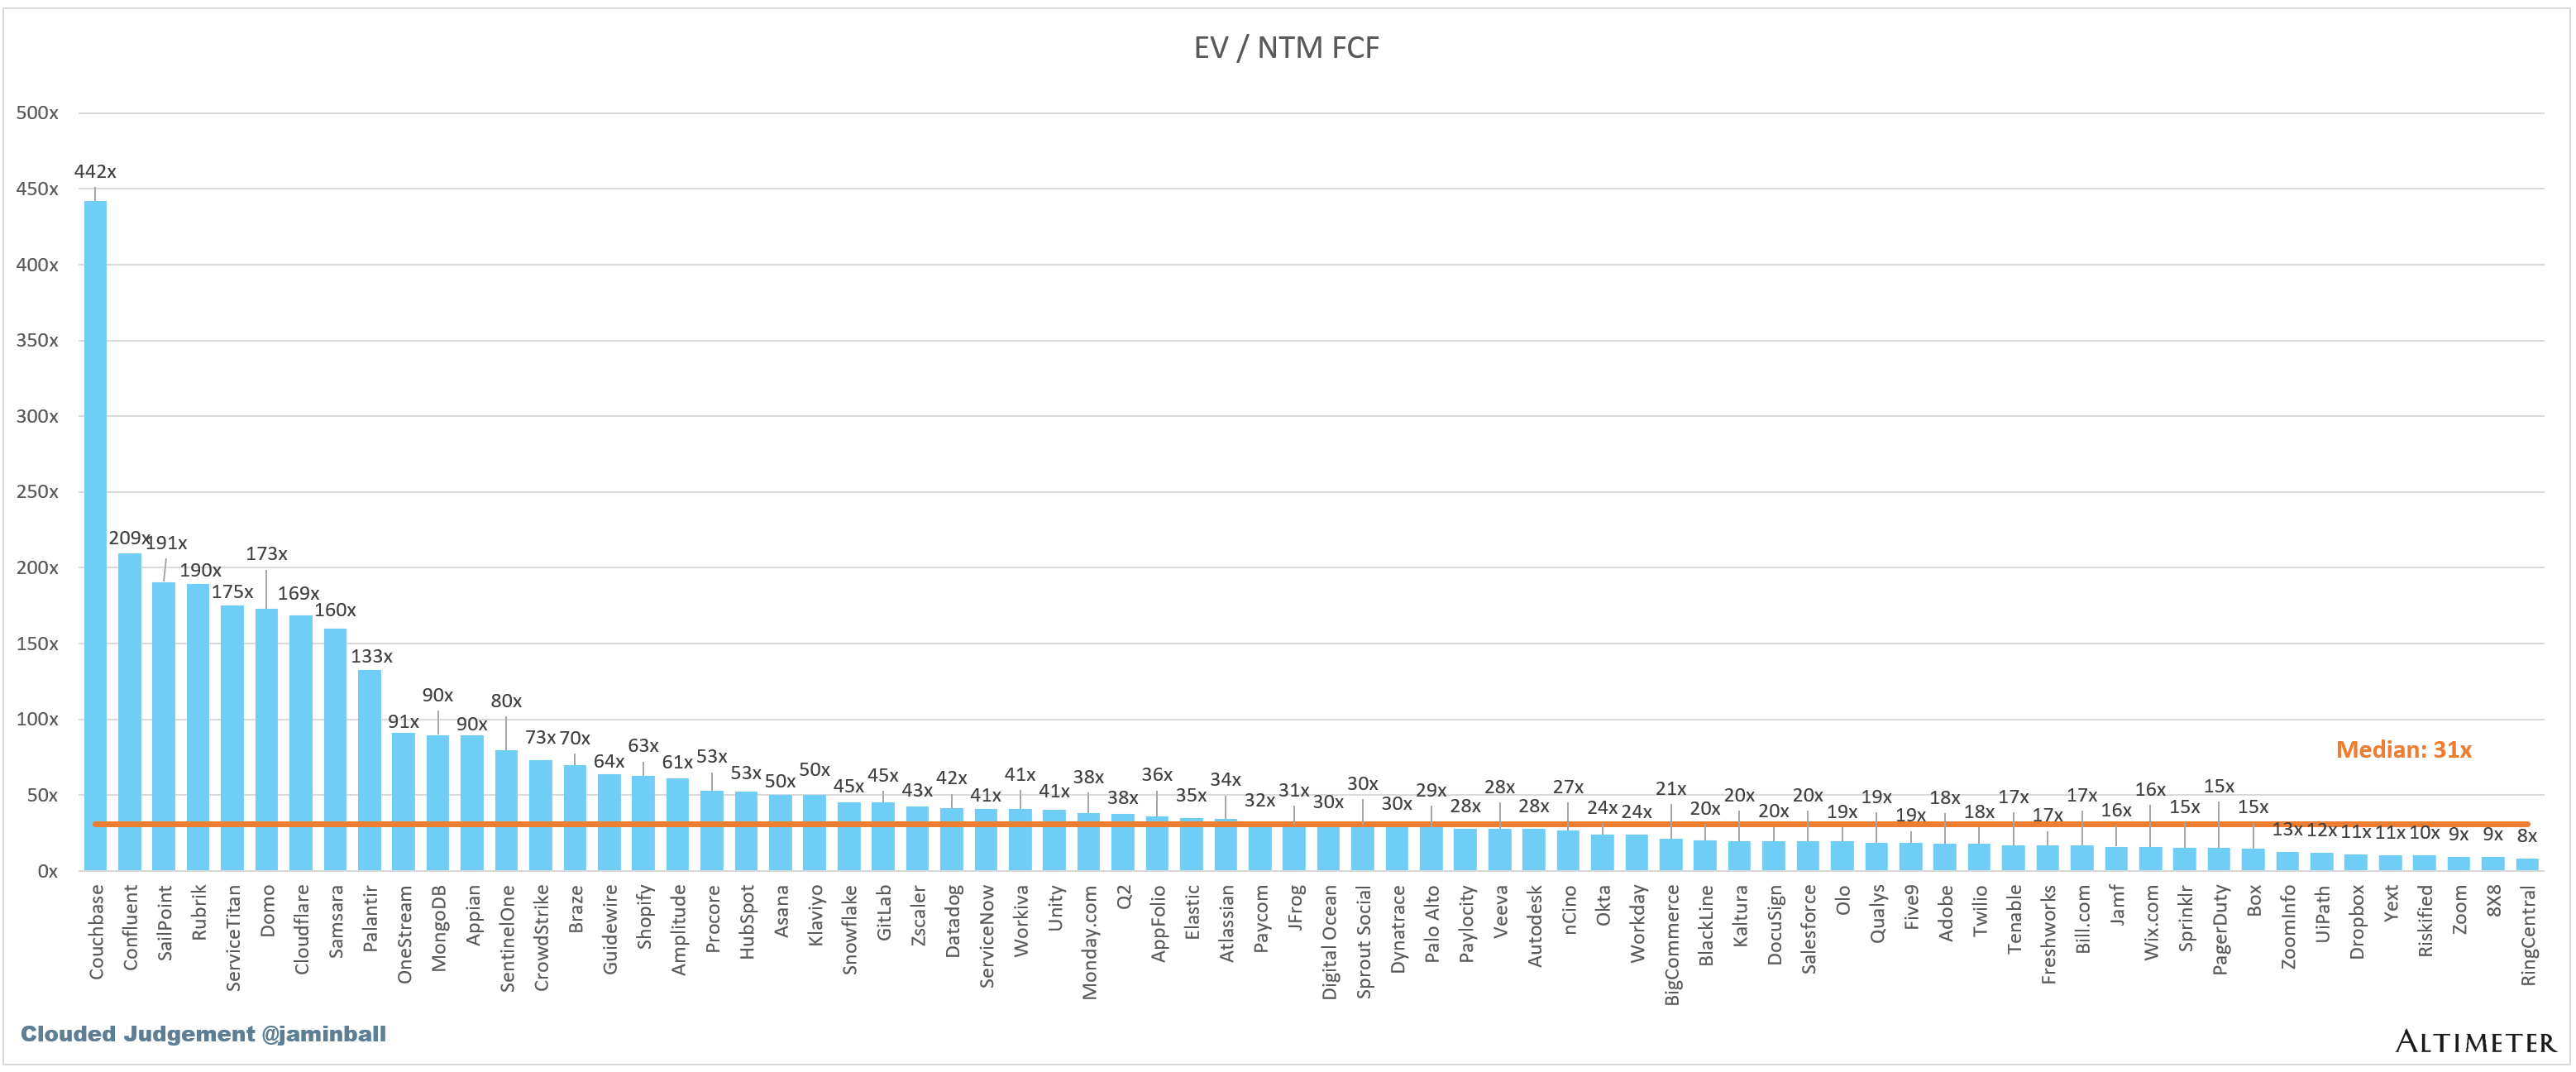
EV / NTM FCF
The line chart shows the median of all companies with a FCF multiple >0x and <100x. I created this subset to show companies where FCF is a relevant valuation metric.

Companies with negative NTM FCF are not listed on the chart
Scatter Plot of EV / NTM Rev Multiple vs NTM Rev Growth
How correlated is growth to valuation multiple?
Operating Metrics
Median NTM growth rate: 12%
Median LTM growth rate: 15%
Median Gross Margin: 76%
Median Operating Margin (6%)
Median FCF Margin: 16%
Median Net Retention: 108%
Median CAC Payback: 43 months
Median S&M % Revenue: 39%
Median R&D % Revenue: 24%
Median G&A % Revenue: 16%
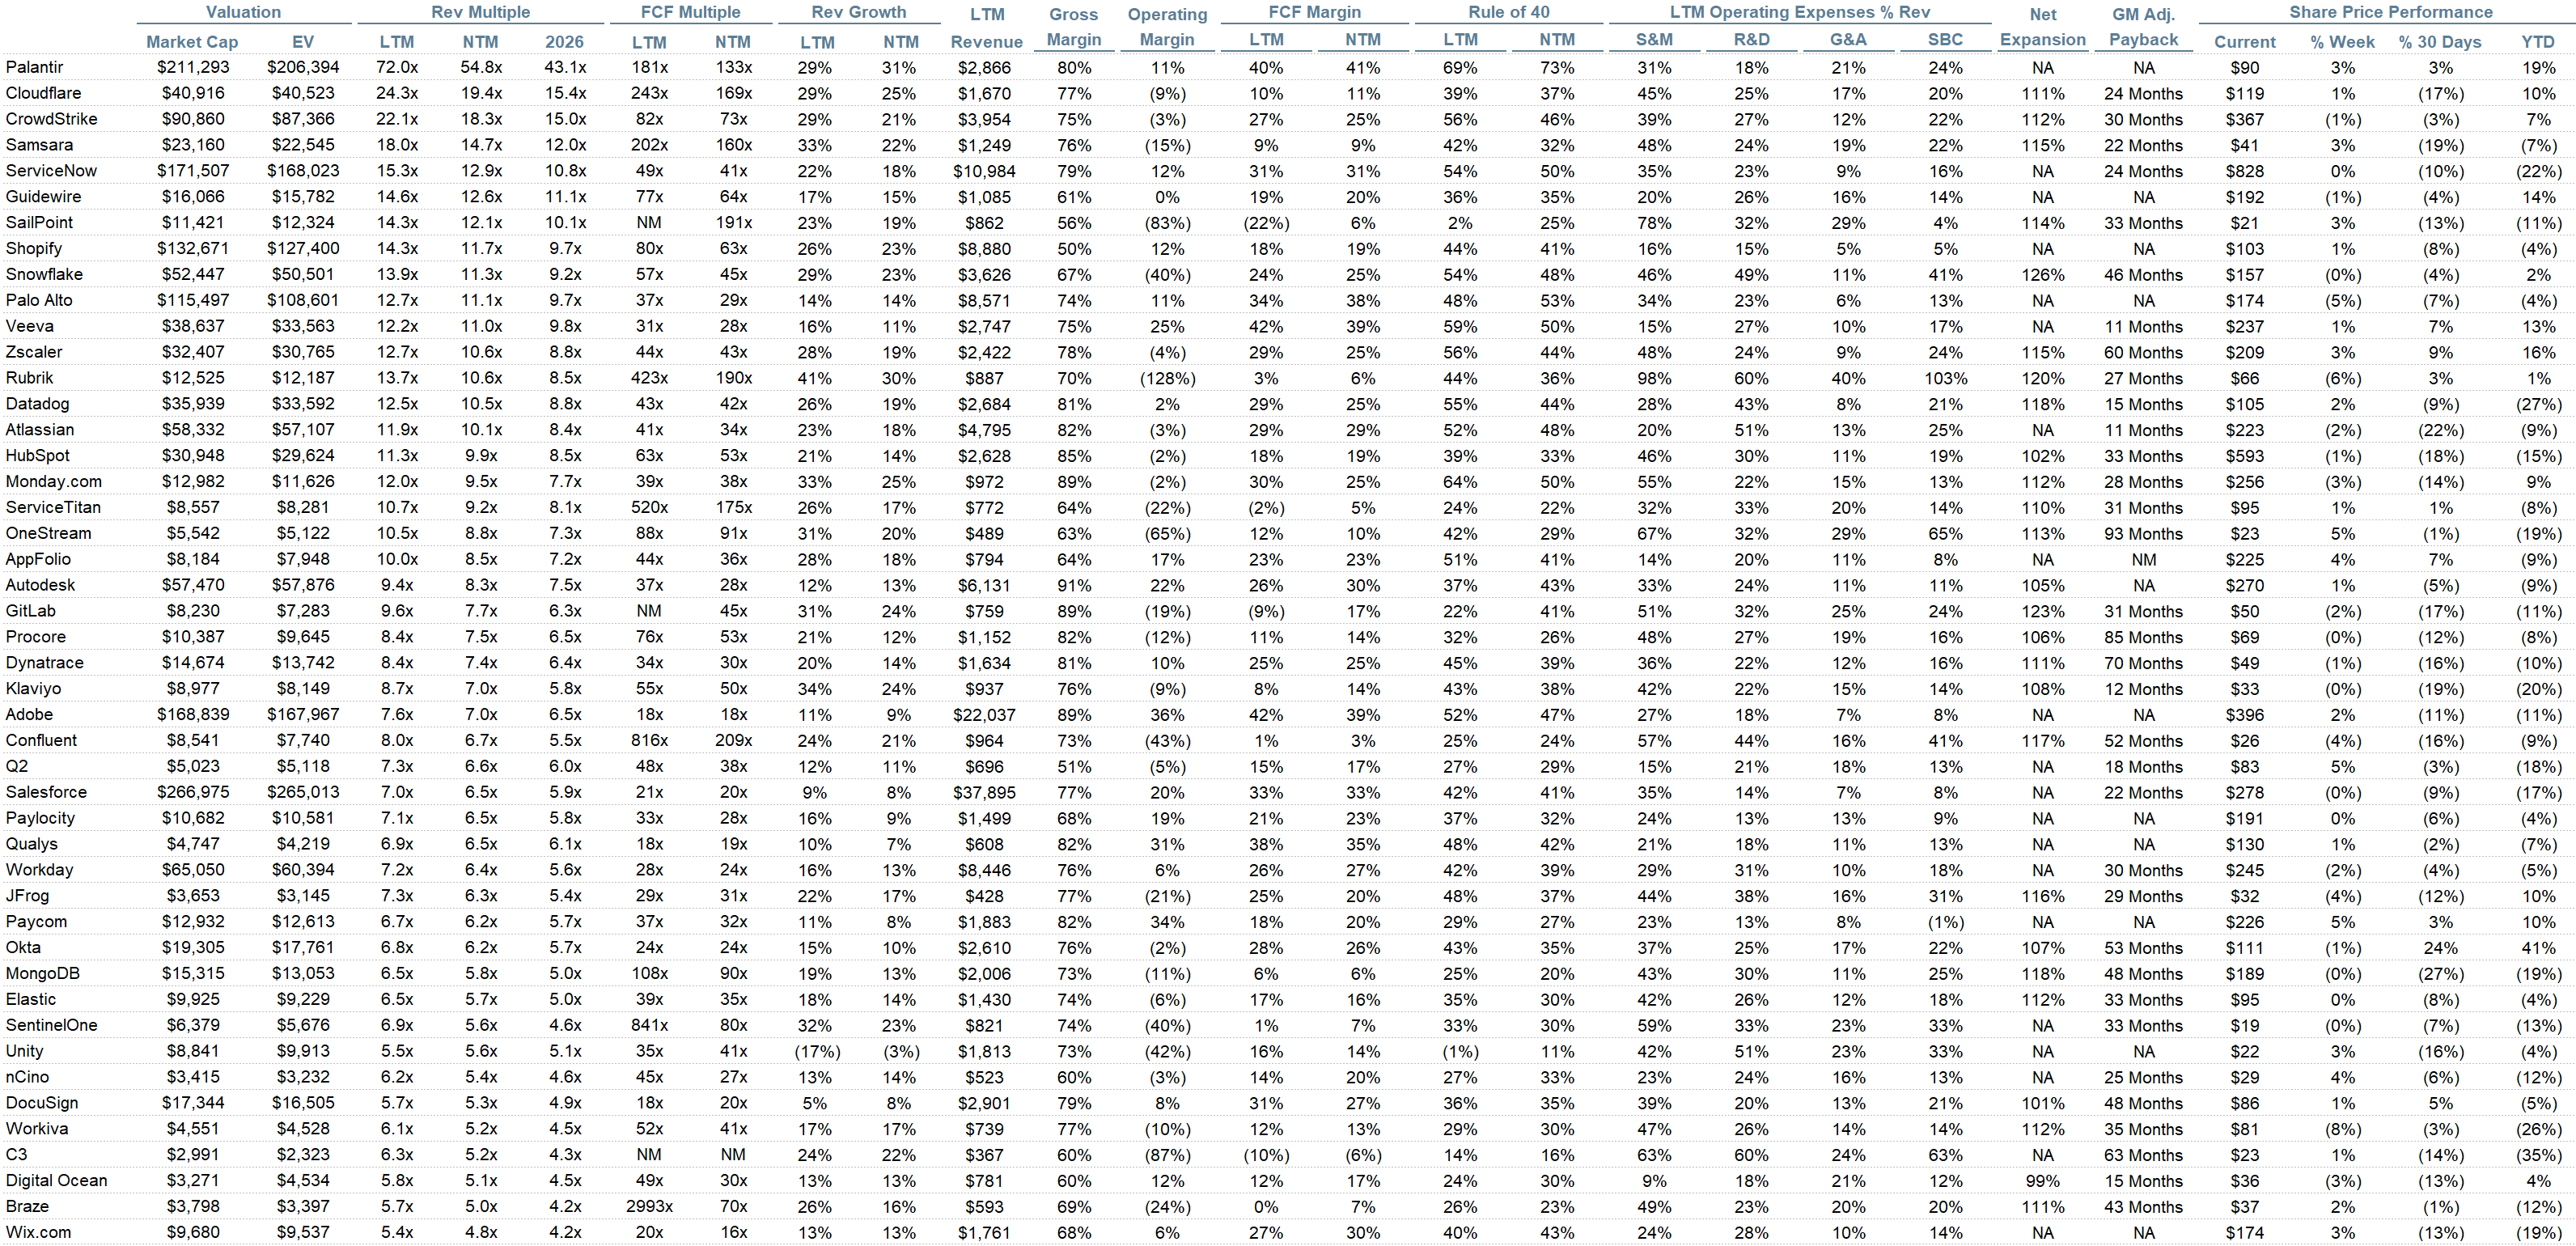
Comps Output
Rule of 40 shows rev growth + FCF margin (both LTM and NTM for growth + margins). FCF calculated as Cash Flow from Operations - Capital Expenditures
GM Adjusted Payback is calculated as: (Previous Q S&M) / (Net New ARR in Q x Gross Margin) x 12 . It shows the number of months it takes for a SaaS business to payback their fully burdened CAC on a gross profit basis. Most public companies don’t report net new ARR, so I’m taking an implied ARR metric (quarterly subscription revenue x 4). Net new ARR is simply the ARR of the current quarter, minus the ARR of the previous quarter. Companies that do not disclose subscription rev have been left out of the analysis and are listed as NA.

Sources used in this post include Bloomberg, Pitchbook and company filings
The information presented in this newsletter is the opinion of the author and does not necessarily reflect the view of any other person or entity, including Altimeter Capital Management, LP ("Altimeter"). The information provided is believed to be from reliable sources but no liability is accepted for any inaccuracies. This is for information purposes and should not be construed as an investment recommendation. Past performance is no guarantee of future performance. Altimeter is an investment adviser registered with the U.S. Securities and Exchange Commission. Registration does not imply a certain level of skill or training.
This post and the information presented are intended for informational purposes only. The views expressed herein are the author’s alone and do not constitute an offer to sell, or a recommendation to purchase, or a solicitation of an offer to buy, any security, nor a recommendation for any investment product or service. While certain information contained herein has been obtained from sources believed to be reliable, neither the author nor any of his employers or their affiliates have independently verified this information, and its accuracy and completeness cannot be guaranteed. Accordingly, no representation or warranty, express or implied, is made as to, and no reliance should be placed on, the fairness, accuracy, timeliness or completeness of this information. The author and all employers and their affiliated persons assume no liability for this information and no obligation to update the information or analysis contained herein in the future.
Thank you for writing this - I was having this exact discussion just yesterday - multiple layered problems here adding on to your list - moving to value/outcome pricing gives a different nuance to the "recurring" revenue story - is it recurring or reoccurring - not just in the contract but in the mind of the customer. Predicting churn and growth both need to new models. Lots of phantom (h/t Jake Saper) or temporal product market fit in the mix. Essentially all the elements of our ability to predict growth and health of a business are vulnerable at the same time. This is not a moment for rookies - or maybe it is precisely a moment for rookies. Lots of unlearning required to sort out what the true patterns are.