
Clouded Judgement 3.3.23 - Thoughts on Consumption Software

Every week I’ll provide updates on the latest trends in cloud software companies. Follow along to stay up to date!
Consumption Thoughts
We’re really learning a lot about consumption models, and how they fare in a down market. Coming into this cycle I had two hypotheses on how consumption models would fare relative to their seat based counterparts (speaking in very generalized terms):

Hypothesis A: Consumption takes a hit first, with the hit to seat based coming on a lag. But ultimately both hitting a similar low before re-accelerating
Hypothesis B: Seat models also decelerate on a lag, but relative to consumption models don’t decelerate as much. Coming out of the down market they reaccelerate, but not as much as consumption models
Coming into the year, I was a lot more in Hypothesis A camp. So far, the data is looking more like Hypothesis B. Snowflake reported this week with interesting results. 3 months ago they guided to 47% growth for 2023. This week, they cut that figure to 40%. A pretty big drop in expectations in just one quarter. The big question people asked at the start of this market cycle (and are asking again) - should consumption models get dinged on their trading multiple given the increased volatility that comes with them? Snowflake / Datadog have decelerated quickly. And the dangerous part is it’s unclear when we hit a local minimum.
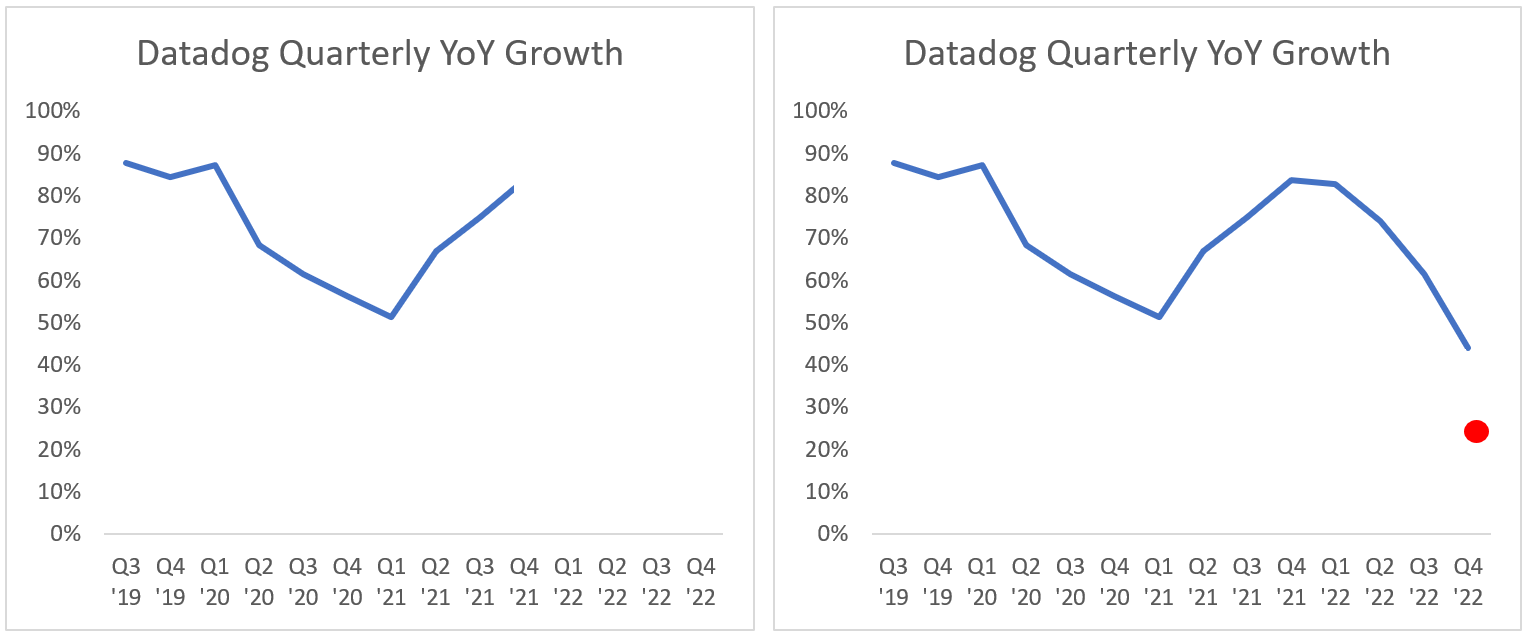
The chart below shows Datadog's quarterly YoY growth. The far left shows the effect going into and coming out of the covid slowdown. As you can see, there was a sharp rebound. The far right chart shows what’s happened since… As you can see they’ve had another sharp deceleration. The red dot is what they’re guided to for the full year 2023 growth (which means the quarterly YoY growth in Q4 ‘23 would be lower than the red dot which is at 24% ). The biggest question is where does the deceleration bottom. I’ve talked about how that could be back half of this year, but that is far from a foregone conclusion. There’s risk that the rebound is pushed further out in the future which makes it tricky to forecast / know when things get better.
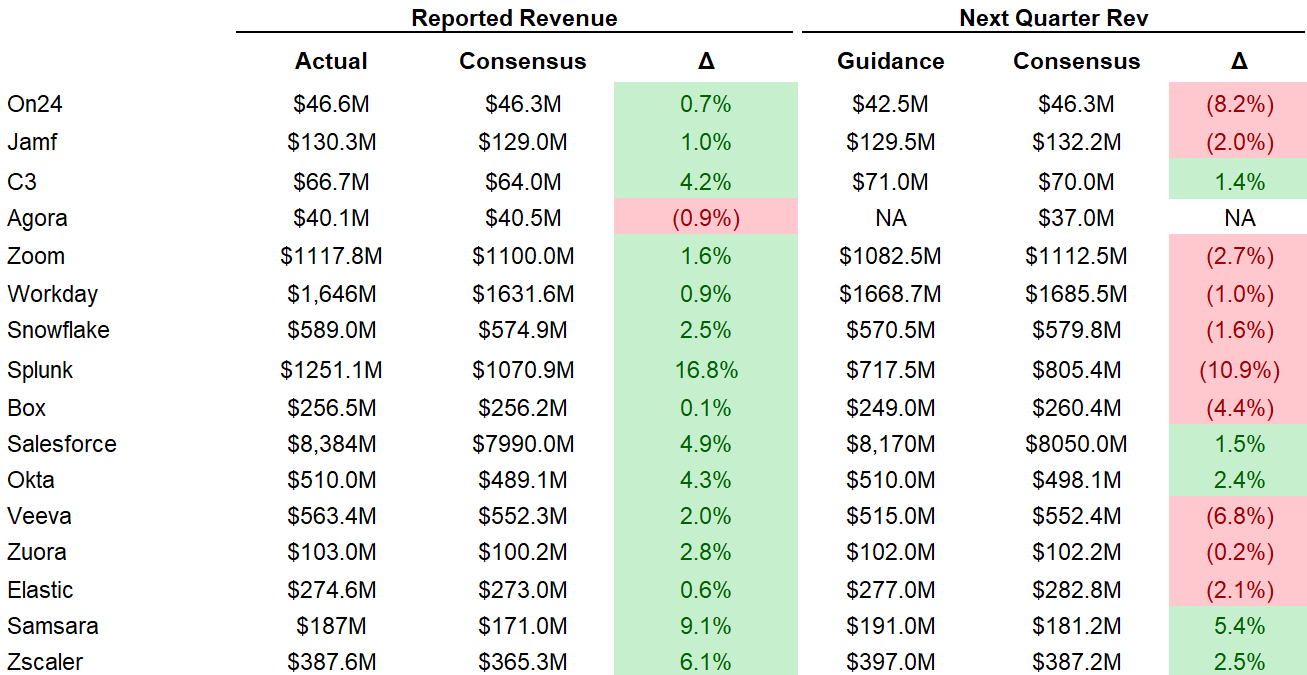
Quarterly Reports Summary
Top 10 EV / NTM Revenue Multiples

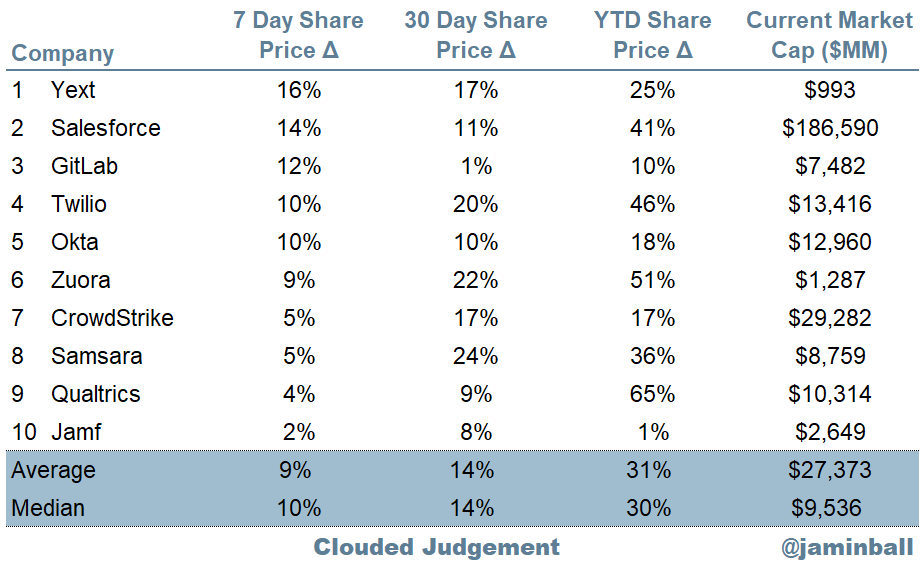
Top 10 Weekly Share Price Movement
Update on Multiples
SaaS businesses are generally valued on a multiple of their revenue - in most cases the projected revenue for the next 12 months. Revenue multiples are a shorthand valuation framework. Given most software companies are not profitable, or not generating meaningful FCF, it’s the only metric to compare the entire industry against. Even a DCF is riddled with long term assumptions. The promise of SaaS is that growth in the early years leads to profits in the mature years. Multiples shown below are calculated by taking the Enterprise Value (market cap + debt - cash) / NTM revenue.
Overall Stats:
Overall Median: 5.8x
Top 5 Median: 12.2x
10Y: 4.1%


Bucketed by Growth. In the buckets below I consider high growth >30% projected NTM growth, mid growth 15%-30% and low growth <15%
High Growth Median: 10.0x
Mid Growth Median: 6.1x
Low Growth Median: 3.4x


Scatter Plot of EV / NTM Rev Multiple vs NTM Rev Growth
How correlated is growth to valuation multiple?

Growth Adjusted EV / NTM Rev
The below chart shows the EV / NTM revenue multiple divided by NTM consensus growth expectations. The goal of this graph is to show how relatively cheap / expensive each stock is relative to their growth expectations
Operating Metrics
Median NTM growth rate: 16%
Median LTM growth rate: 27%
Median Gross Margin: 74%
Median Operating Margin (25%)
Median FCF Margin: 0%
Median Net Retention: 118%
Median CAC Payback: 30 months
Median S&M % Revenue: 47%
Median R&D % Revenue: 28%
Median G&A % Revenue: 19%
Comps Output
Rule of 40 shows LTM growth rate + LTM FCF Margin. FCF calculated as Cash Flow from Operations - Capital Expenditures
GM Adjusted Payback is calculated as: (Previous Q S&M) / (Net New ARR in Q x Gross Margin) x 12 . It shows the number of months it takes for a SaaS business to payback their fully burdened CAC on a gross profit basis. Most public companies don’t report net new ARR, so I’m taking an implied ARR metric (quarterly subscription revenue x 4). Net new ARR is simply the ARR of the current quarter, minus the ARR of the previous quarter. Companies that do not disclose subscription rev have been left out of the analysis and are listed as NA.


This post and the information presented are intended for informational purposes only. The views expressed herein are the author’s alone and do not constitute an offer to sell, or a recommendation to purchase, or a solicitation of an offer to buy, any security, nor a recommendation for any investment product or service. While certain information contained herein has been obtained from sources believed to be reliable, neither the author nor any of his employers or their affiliates have independently verified this information, and its accuracy and completeness cannot be guaranteed. Accordingly, no representation or warranty, express or implied, is made as to, and no reliance should be placed on, the fairness, accuracy, timeliness or completeness of this information. The author and all employers and their affiliated persons assume no liability for this information and no obligation to update the information or analysis contained herein in the future.
I like the datadog chart, thanks. I think it bottoms between 20 and 30% for, probably, 3 quarters, before accelerating to >30% near 40% again.
Cool visuals on the Consumption vs. Seat models. A picture is worth 1000 words!