Every week I’ll provide updates on the latest trends in cloud software companies. Follow along to stay up to date!
More Volatility
This week came with more volatility - especially in high growth software. Everyone had their eye on Snowflake’s earnings, as they’ve had the highest software multiple since they went public. While the quarter appeared strong, their guidance disappointed and the stock dropped 15%. One interesting aspect of their guide - they cited a $100M full year revenue headwind due to process improvements . Said another way - they enhanced their platform to make it more efficient, so that it costs their customers less to use (oversimplified). The good news is that these process improvements will make Snowflake more price attractive to new customers. The bad news is that it will make the product “cheaper” to existing customers. Over time this will be a net positive.
What Could Go Wrong?
As many know, I’m a huge cloud software bull. However, I think it’s very healthy to regularly ask myself “what could go wrong.” The best time to ask this question is when things are going well. Obviously, things aren’t going well currently. However, I’d argue that businesses are still preforming very well, but multiples have contracted significantly. So I’m asking myself now - “what could go wrong with software business performance.” The last few years we’ve seen massive growth - capital was cheap, and companies of all scale were prioritizing growth over efficiency. In many cases this meant tons of hiring, and higher cash burn. However, this attitude may start to shift. There’s a lot of uncertainty in the world, and companies may take a different approach than “growth at all costs.” Maybe this means companies tighten up their cost structure and look to “trim the fat” around the edges of their spend. Or maybe they hire less aggressively. If this happens, it probably means spend on software goes down (especially for seat based pricing solutions). I’m not saying this will happen, but I am saying it doesn’t seem that crazy, and planning accordingly is important. This phenomenon will only become more pronounced if we do go into a recession (which very well could happen if rates rise too quickly).
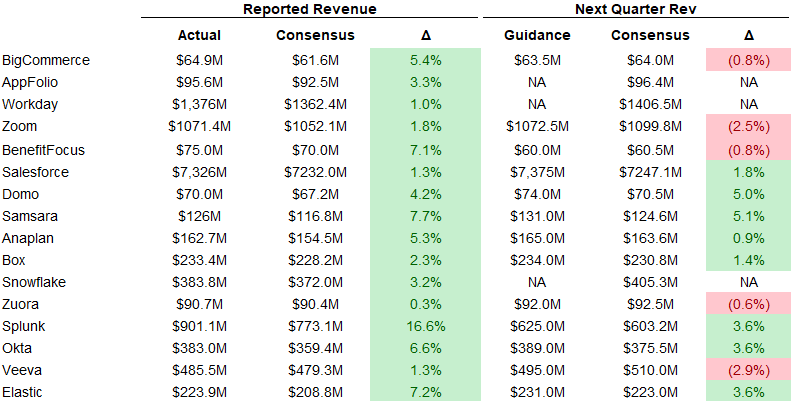
Quarterly Reports Summary
Top 10 EV / NTM Revenue Multiples
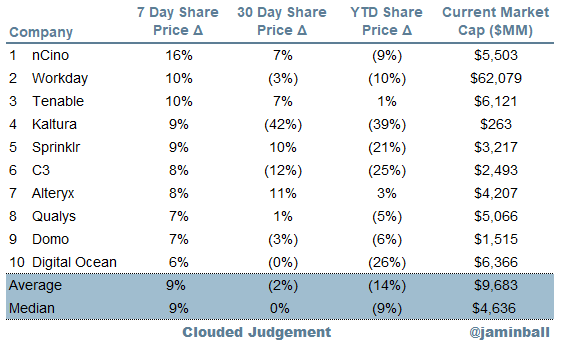
Top 10 Weekly Share Price Movement
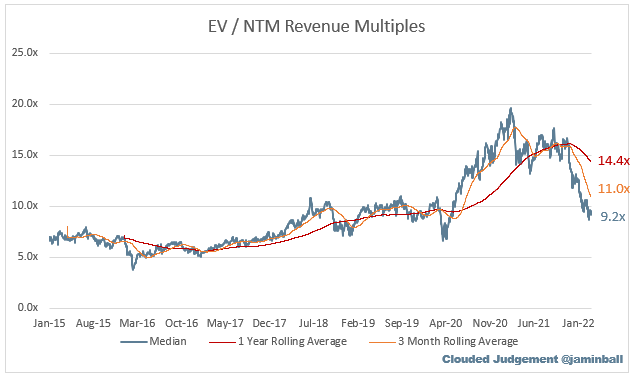
Update on Multiples
SaaS businesses are valued on a multiple of their revenue - in most cases the projected revenue for the next 12 months. Multiples shown below are calculated by taking the Enterprise Value (market cap + debt - cash) / NTM revenue.
Overall Stats:
Overall Median: 9.2x
Top 5 Median: 30.9x
3 Month Trailing Average: 11.0x
1 Year Trailing Average: 14.4x
Bucketed by Growth. In the buckets below I consider high growth >30% projected NTM growth, mid growth 15%-30% and low growth <15%
High Growth Median: 13.5x
Mid Growth Median: 9.0x
Low Growth Median: 4.3x
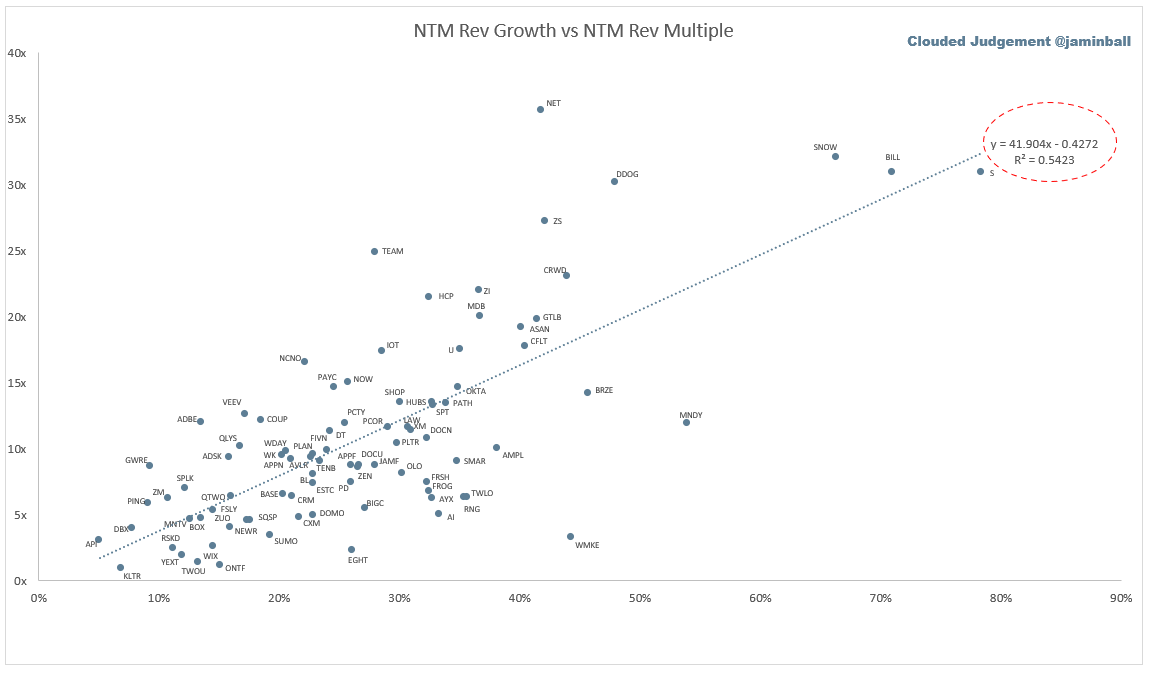
Scatter Plot of EV / NTM Rev Multiple vs NTM Rev Growth
How correlated is growth to valuation multiple?
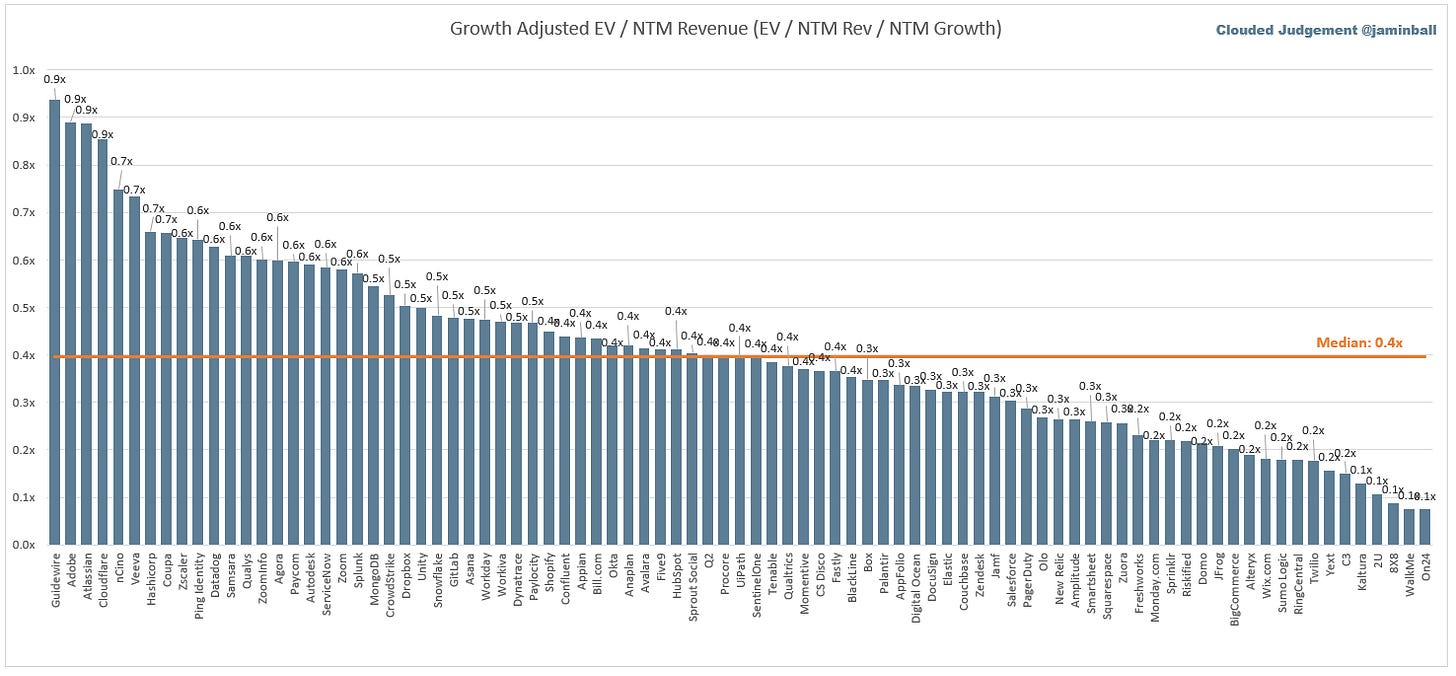
Growth Adjusted EV / NTM Rev
The below chart shows the EV / NTM revenue multiple divided by NTM consensus growth expectations. The goal of this graph is to show how relatively cheap / expensive each stock is relative to their growth expectations
Operating Metrics
Median NTM growth rate: 26%
Median LTM growth rate: 33%
Median Gross Margin: 74%
Median Operating Margin (22%)
Median FCF Margin: 4%
Median Net Retention: 120%
Median CAC Payback: 24 months
Median S&M % Revenue: 45%
Median R&D % Revenue: 26%
Median G&A % Revenue: 19%
Comps Output
Rule of 40 shows LTM growth rate + LTM FCF Margin. FCF calculated as Cash Flow from Operations - Capital Expenditures
GM Adjusted Payback is calculated as: (Previous Q S&M) / (Net New ARR in Q x Gross Margin) x 12 . It shows the number of months it takes for a SaaS business to payback their fully burdened CAC on a gross profit basis. Most public companies don’t report net new ARR, so I’m taking an implied ARR metric (quarterly subscription revenue x 4). Net new ARR is simply the ARR of the current quarter, minus the ARR of the previous quarter. Companies that do not disclose subscription rev have been left out of the analysis and are listed as NA.
This post and the information presented are intended for informational purposes only. The views expressed herein are the author’s alone and do not constitute an offer to sell, or a recommendation to purchase, or a solicitation of an offer to buy, any security, nor a recommendation for any investment product or service. While certain information contained herein has been obtained from sources believed to be reliable, neither the author nor any of his employers or their affiliates have independently verified this information, and its accuracy and completeness cannot be guaranteed. Accordingly, no representation or warranty, express or implied, is made as to, and no reliance should be placed on, the fairness, accuracy, timeliness or completeness of this information. The author and all employers and their affiliated persons assume no liability for this information and no obligation to update the information or analysis contained herein in the future.







Hey Jamin - Quick question. I noticed that the FDSO in the press release for $SNOW was ~360M but CapIQ it still is ~306M.. Are you noticing this with other companies or can you provide a bit more color / context from your/altimeter's perspective? Love your stuff.