Clouded Judgement 4.15.22
Every week I’ll provide updates on the latest trends in cloud software companies. Follow along to stay up to date!
Macro Thoughts
This week I’m excited to introduce everyone to Clark Tang, one of my colleagues. He has spent a lot of time recently thinking about the macro environment (inflation, rates, etc). For this week’s post, Clark has offered to write the intro and share some of his thoughts coming out of the Fed meeting. Give him a follow on Twitter for additional macro commentary!
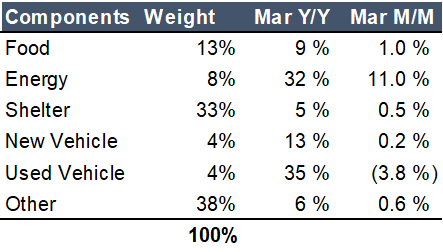
The March CPI report came in on Tuesday, with CPI growing 8.5% year-over-year and 1.2% month-over-month, led by energy inflation. Core CPI (which excludes food and energy which are often volatile) came in at 6.5% Y/Y and 0.3% M/M. Our view is that we’ve likely seen the mathematical peak of inflation, and that comps get easier from this point on (Jamin covered this topic in his March 25th newsletter).
Inflation increased from 7.9% Y/Y in February to 8.5% Y/Y in March. As we expected, food and energy accelerated M/M due to the Ukraine/Russia conflict (this topic is well covered on the All-In Podcast). But looking past to Core CPI at +0.3% M/M – this was the lowest month-over-month increase since Sep 2021. The bond market took this as a bullish sign and bond traders covered some of their 2-Yr Treasury shorts brought interest rates down 20bps.
This is not to say that inflation isn’t high (we haven’t seen Core CPI Y/Y inflation this high since 1982). But now that we’re here, what does the event path look like for the next year? Will figures be higher or lower from here?
We took a bottoms-up approach by looking at the principal components of CPI. Our conclusion was that you don’t actually need prices to fall to get to mid-single-digit inflation. Even as some pockets accelerate (services), others will decelerate (durable goods), and on a blended basis, (and off of a base that grew 6% already), it becomes increasingly difficult for inflation to continue climbing from here.
We made a few assumptions on a few core categories of CPI and encourage you all to do the same. Here’s the work we did on used cars:
It’s no secret that used car prices spiked during 2H of 2020, driven by a supply shortage in newly-built cars. Because of COVID, auto manufacturers decommitted to chip orders with semi fabs and the global auto market is still reeling in the aftermath. Things got so bad that it was more expensive (!) to buy a used car than a new car. All of that is not sustainable and has started to reverse. With new auto supply coming online and the price of oil +80% from 2019 levels, the demand for supply-constrained used cars is decreasing. Used car prices were down 3.8% M/M in March.
The St. Louis Fed makes all this data easily available on their FRED website. You can download the above data set and graph it as well: https://fred.stlouisfed.org/series/CUSR0000SETA02. Historically this index has remained relatively flat around 140-150 (see red & purple lines) but even if prices remained flat from here, by December, used cars would be contributing negative Y/Y growth to CPI.
After we ran this same exercise for various pockets of CPI, we came to our own bottoms-up view on Core CPI which we shared on Tuesday.


Are we all in the clear then? No! 4% core inflation is still much higher than the Fed’s stated target of 2% inflation. Make no mistake, we are not in the clear – there is still risk! But if you take a step back, what this opens up is an event path ahead where you can imagine headlines getting better (no more “HIGHEST INFLATION LEVEL SINCE 1989”), alongside consumer demand trailing off and employment levels normalizing… in a world where the Fed feels like they have accomplished their goals.
Macro is an incredibly complex discipline and we don’t claim to be experts in it! But when everyone is running to the other side of the boat, it can be helpful to stop in the middle and reassess the situation.
The market is pricing in 8 interest rate hikes by the end of this year with many analysts calling for 3-3.5% terminal rates. The latest Fed Dot Plot shared in March 2022 for YE2023 had the median at 2.8%. So the market believes that the Fed will only get more bearish than what they’ve signaled. And per Morgan Stanley, March 2022 was the most aggressive month of Tech-sector selling since 2010. Some food for thought.
Broader Takeaways
So what does that mean for software? Software faced a lot of pain in the Q1 tech sell down… but all of that makes sense. The farther out your cash flows are, the more your valuation should be affected by interest rate moves. But don’t forget – all companies are affected by interest rate moves! Not just software businesses!
From first principles, software appears quite attractive during periods of elevated inflation and uncertain consumer demand. B2B companies with near-zero variable costs selling deflationary products (efficiency / productivity gains) will grow through any dynamic. Remember, a lot of these software companies are spending cash to acquire customers who churn at <5% per year, and who naturally grow at over +40% per year! Of course, not all software is created equal and there will undoubtedly be examples of companies that buck this trend. But from the lens of a public market investor… the quality of public software companies has never been as high!
Gavin Baker recently did a great interview on where we are on the state of markets (https://themarket.ch/interview/there-is-no-playbook-ld.6422) which I thought was very clear.
One good point Gavin made:
“Thoma Bravo, a private equity firm, just took out a software company at 12x forward sales. Today, you can buy a lot of software companies at roughly half that multiple, and they are growing faster with better fundamentals than the asset acquired by Thoma Bravo.”
Gavin was referring to Thoma’s deal for Anaplan announced in March, but just this Monday, Thoma announced another deal – SailPoint, which competes in the Identity & Access Management space alongside Okta. The NTM acquisition multiple was done at a 20% premium to Okta’s trading multiple, despite Okta growing ~20% faster YoY. That means that as a public market investor today, you can go out and buy a business with stronger fundamentals, at a cheaper price, than one of the most respected private equity software investors.
And Okta isn’t the only interesting opportunity in software today. Fascinating times!
Top 10 EV / NTM Revenue Multiples
Top 10 Weekly Share Price Movement
Update on Multiples
SaaS businesses are valued on a multiple of their revenue - in most cases the projected revenue for the next 12 months. Multiples shown below are calculated by taking the Enterprise Value (market cap + debt - cash) / NTM revenue.
Overall Stats:
Overall Median: 8.8x
Top 5 Median: 27.5x
3 Month Trailing Average: 9.5x
1 Year Trailing Average: 13.6x
Bucketed by Growth. In the buckets below I consider high growth >30% projected NTM growth, mid growth 15%-30% and low growth <15%
High Growth Median: 11.5x
Mid Growth Median: 8.6x
Low Growth Median: 4.0x
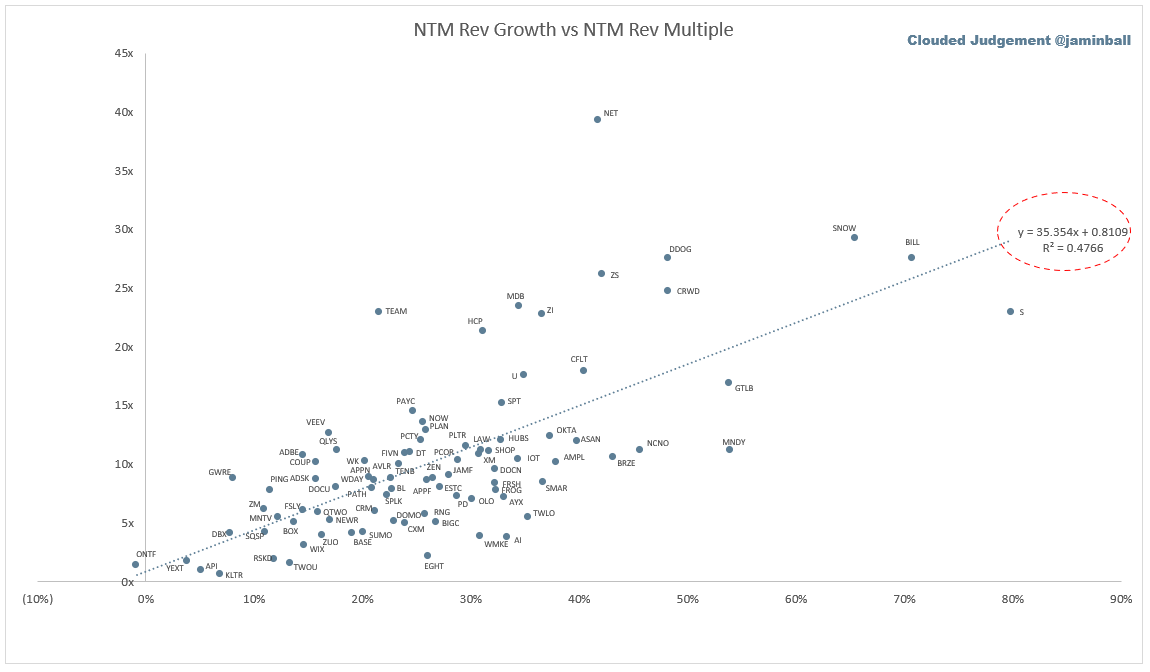
Scatter Plot of EV / NTM Rev Multiple vs NTM Rev Growth
How correlated is growth to valuation multiple?
Growth Adjusted EV / NTM Rev
The below chart shows the EV / NTM revenue multiple divided by NTM consensus growth expectations. The goal of this graph is to show how relatively cheap / expensive each stock is relative to their growth expectations
Operating Metrics
Median NTM growth rate: 26%
Median LTM growth rate: 34%
Median Gross Margin: 74%
Median Operating Margin (23%)
Median FCF Margin: 3%
Median Net Retention: 120%
Median CAC Payback: 23 months
Median S&M % Revenue: 45%
Median R&D % Revenue: 26%
Median G&A % Revenue: 20%
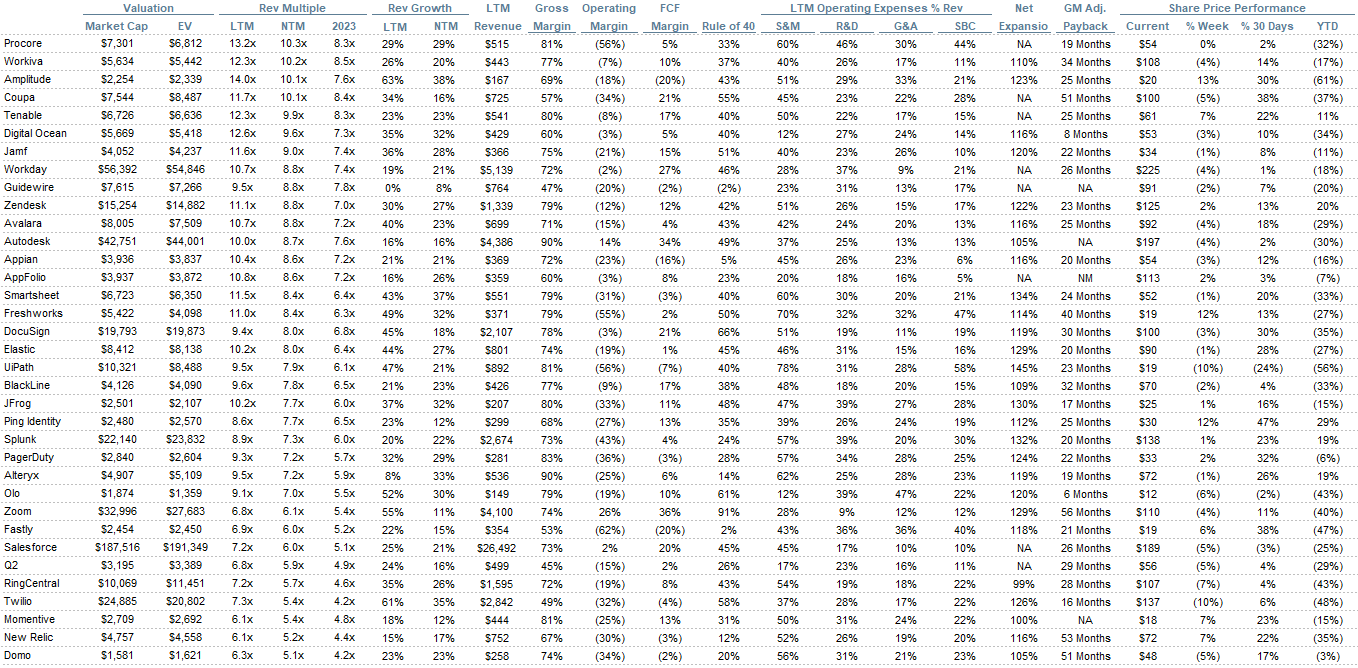
Comps Output
Rule of 40 shows LTM growth rate + LTM FCF Margin. FCF calculated as Cash Flow from Operations - Capital Expenditures
GM Adjusted Payback is calculated as: (Previous Q S&M) / (Net New ARR in Q x Gross Margin) x 12 . It shows the number of months it takes for a SaaS business to payback their fully burdened CAC on a gross profit basis. Most public companies don’t report net new ARR, so I’m taking an implied ARR metric (quarterly subscription revenue x 4). Net new ARR is simply the ARR of the current quarter, minus the ARR of the previous quarter. Companies that do not disclose subscription rev have been left out of the analysis and are listed as NA.
This post and the information presented are intended for informational purposes only. The views expressed herein are the author’s alone and do not constitute an offer to sell, or a recommendation to purchase, or a solicitation of an offer to buy, any security, nor a recommendation for any investment product or service. While certain information contained herein has been obtained from sources believed to be reliable, neither the author nor any of his employers or their affiliates have independently verified this information, and its accuracy and completeness cannot be guaranteed. Accordingly, no representation or warranty, express or implied, is made as to, and no reliance should be placed on, the fairness, accuracy, timeliness or completeness of this information. The author and all employers and their affiliated persons assume no liability for this information and no obligation to update the information or analysis contained herein in the future.


