Clouded Judgement 4.21.23 - Hypserscaler Preview for Q1
Every week I’ll provide updates on the latest trends in cloud software companies. Follow along to stay up to date!
Q1 Earnings Season
We’re on the eve of Q1 earning season. Next week we get all 3 hyperscalers reporting (AWS from Amazon, Azure from Microsoft, and GCP from Google). If we look at the trends in their most recent quarters YoY growth rates (below) you’ll see the deceleration has been meaningful.
Let’s double click on Azure. The Q4 ‘22 growth rate was 38% YoY. However, they called out a growth rate of mid 30’s in December, and guided to 30-31% YoY growth in Q1. That would be a meaningful drop from Q4 to Q1. On AWS, in their Q4 earnings call they said AWS was growing “mid teens” in January (down from 20% in Q4).
Unfortunately, it’s not clear things have gotten much better since their earnings call 3 months ago. Morgan Stanley released a report yesterday suggesting “cloud optimizations [were] an intensifying headwind in Q1.” One other interesting comment they made: “More recent data from our partner conversations suggest that cloud infrastructure ecosystem weakened as the quarter progressed as cloud transformation projects took a pause and optimization initiatives stepped into a higher gear.” They anticipate Q1 will be the peak pressure on cloud spend, and we may see a re-acceleration heading into 2024.
The big question I have - everyone knows the market is tough right now. The big question is when do we start to see reacceleration. Recent CIO surveys suggest budgets aren’t shrinking, but they’re also not expected to re-accelerate yet. This may be a data point to suggest we’re hitting the trough (or close to it). The tricky part - if there was consensus that re-acceleration was going to hit in H2 ‘23, then investors may be willing to look through weak Q1 reports (and I’m anticipating Q1 will be gnarly for cloud software). However, without that consensus (and I don’t think that’s consensus), investors will only be willing to look so far into the future. The timeline for the re-acceleration keeps getting pushed out, which reduces any perceived clarity. All of this is pure speculation, so I guess we’ll have to wait a week to see how the market reacts to the big cloud providers reports next week! Should be an exciting earnings season.
What I’ll be watching closely is who re-affirms their guide from 3 months ago, vs who lowers (or raises) the full year guide.
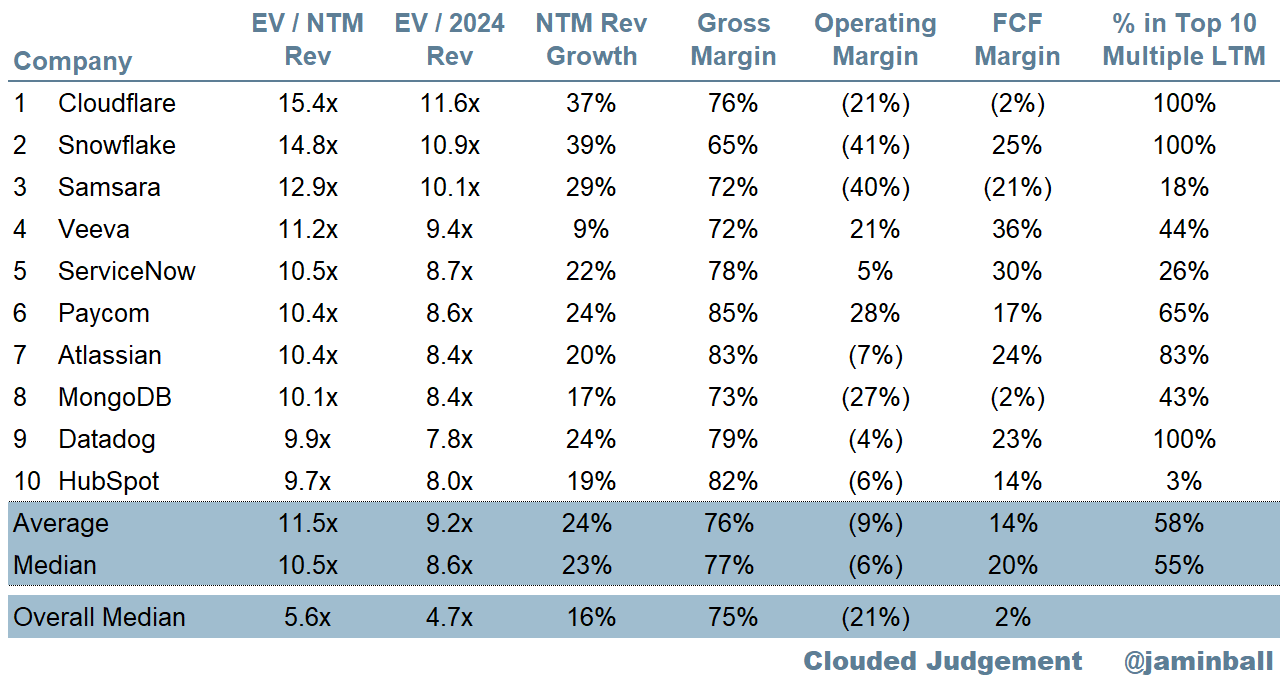
Top 10 EV / NTM Revenue Multiples
Top 10 Weekly Share Price Movement
Update on Multiples
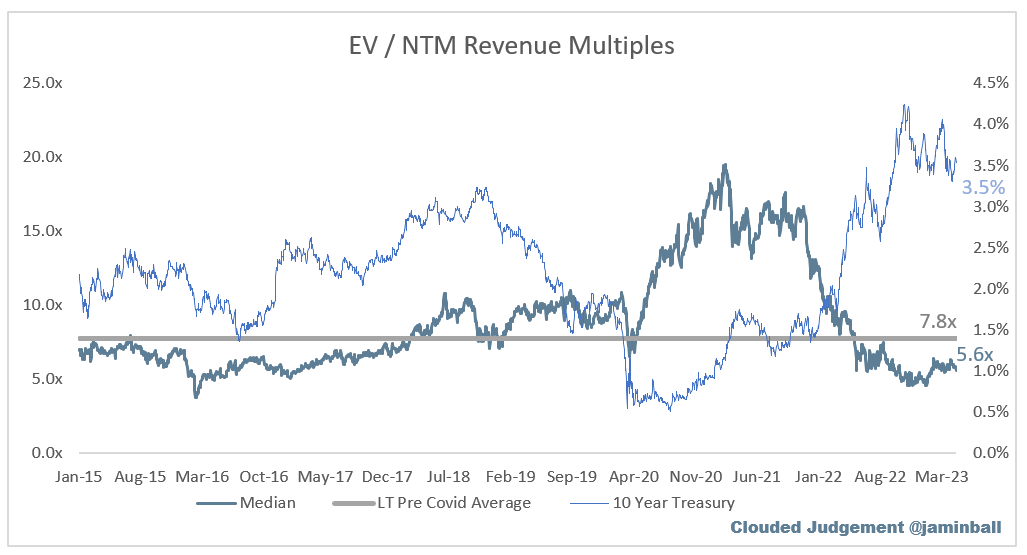
SaaS businesses are generally valued on a multiple of their revenue - in most cases the projected revenue for the next 12 months. Revenue multiples are a shorthand valuation framework. Given most software companies are not profitable, or not generating meaningful FCF, it’s the only metric to compare the entire industry against. Even a DCF is riddled with long term assumptions. The promise of SaaS is that growth in the early years leads to profits in the mature years. Multiples shown below are calculated by taking the Enterprise Value (market cap + debt - cash) / NTM revenue.
Overall Stats:
Overall Median: 5.6x
Top 5 Median: 12.9x
10Y: 3.5%
Bucketed by Growth. In the buckets below I consider high growth >30% projected NTM growth, mid growth 15%-30% and low growth <15%
High Growth Median: 8.1x
Mid Growth Median: 6.4x
Low Growth Median: 3.3x
Scatter Plot of EV / NTM Rev Multiple vs NTM Rev Growth
How correlated is growth to valuation multiple?
Growth Adjusted EV / NTM Rev
The below chart shows the EV / NTM revenue multiple divided by NTM consensus growth expectations. The goal of this graph is to show how relatively cheap / expensive each stock is relative to their growth expectations
Operating Metrics
Median NTM growth rate: 16%
Median LTM growth rate: 26%
Median Gross Margin: 75%
Median Operating Margin (21%)
Median FCF Margin: 2%
Median Net Retention: 116%
Median CAC Payback: 30 months
Median S&M % Revenue: 47%
Median R&D % Revenue: 28%
Median G&A % Revenue: 18%
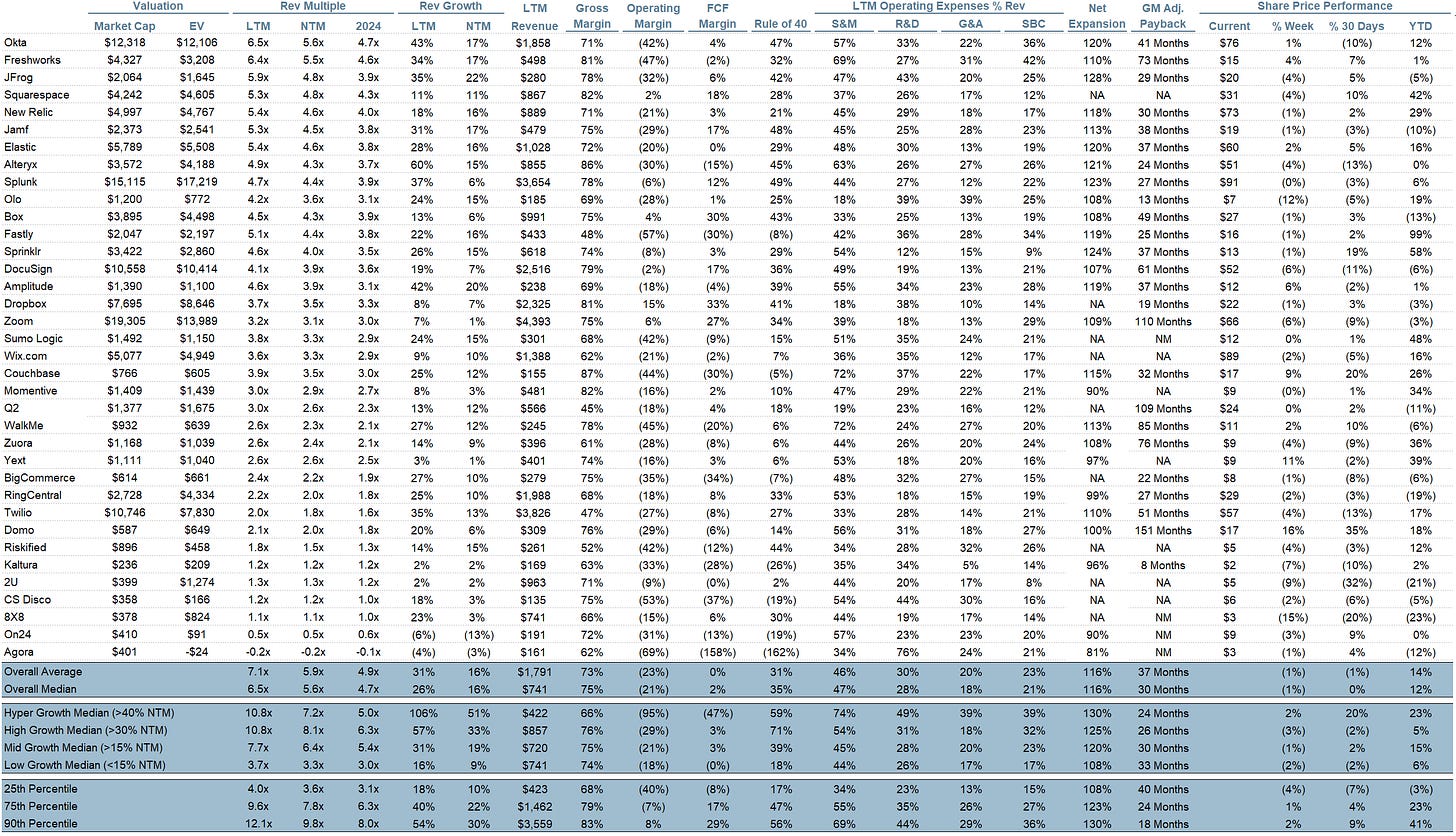
Comps Output
Rule of 40 shows LTM growth rate + LTM FCF Margin. FCF calculated as Cash Flow from Operations - Capital Expenditures
GM Adjusted Payback is calculated as: (Previous Q S&M) / (Net New ARR in Q x Gross Margin) x 12 . It shows the number of months it takes for a SaaS business to payback their fully burdened CAC on a gross profit basis. Most public companies don’t report net new ARR, so I’m taking an implied ARR metric (quarterly subscription revenue x 4). Net new ARR is simply the ARR of the current quarter, minus the ARR of the previous quarter. Companies that do not disclose subscription rev have been left out of the analysis and are listed as NA.
This post and the information presented are intended for informational purposes only. The views expressed herein are the author’s alone and do not constitute an offer to sell, or a recommendation to purchase, or a solicitation of an offer to buy, any security, nor a recommendation for any investment product or service. While certain information contained herein has been obtained from sources believed to be reliable, neither the author nor any of his employers or their affiliates have independently verified this information, and its accuracy and completeness cannot be guaranteed. Accordingly, no representation or warranty, express or implied, is made as to, and no reliance should be placed on, the fairness, accuracy, timeliness or completeness of this information. The author and all employers and their affiliated persons assume no liability for this information and no obligation to update the information or analysis contained herein in the future.


I agree, Jamin, that this is key for Q1 earnings. "What I’ll be watching closely is who re-affirms their guide from 3 months ago, vs who lowers (or raises) the full year guide."
That said, even if a company reaffirms their 2023 guidance, it is still up for debate because we do not know when we will have a recessionary slowdown, how deep or shallow it will be, how long or short it will be.
Cloud companies sell to businesses in all industries - retail, manufacturing, healthcare, financial etc. Many of these are recession prone verticals that are themselves trying to better forecast their business trajectory over the next 12-18 months. When the customers themselves are unsure of the future path, then the software vendors will be kept guessing and making their own best predictions.
Always enjoy your writings. Cheers!
Hi Jamin, thanks for your great work. Could you please deduct stock-based compensation to the FCF? Otherwise it can be really misleading and it will show real profitability