


Clouded Judgement 4.25.25 - Q1 '25 Earnings Season Kicks Off

Every week I’ll provide updates on the latest trends in cloud software companies. Follow along to stay up to date!
Earnings Season Begins!
Earnings season has officially kicked off! We’re still early, not many companies have reported yet, but we can still look for a couple trends.
In software, we’ve had ServiceNow, AppFolio and Google (Google Cloud) report. ServiceNow was certainly a lot better than feared. There were plenty of concerns about the impact of DODE, but at the end of the day they slightly beat Q1 and raised full year guidance by $5m. A solid result! Given all the macro backdrops, any company that at least holds the full year guide constant feels like a win. However, their net new ARR added in Q1 was down from Q1 ‘24 ($556m added Q1 ‘25 vs $632m added in Q1 ‘24). AppFolio missed Q1 estimates, but held their full year guide constant. Google Cloud added less net new ARR in Q1 ‘25 than they did in Q1 ‘24 (but some of that is FX related). Overall, the few datapoints from software so far aren’t great, but they’re definitely a lot better than feared. Now, the first batch of software companies that report will all have quarters that ended in March (before “Liberation Day”). But, guidance should factor in all the choppiness.
Here’s how I’d summarize the ServiceNow earnings call: Despite a choppy macro, software spend hasn’t halted, its just mutated. Boards want deflation, automation, and fewer line-items on the invoice. ServiceNow’s pitch is basically ‘we are your deflationary AI platform.’ And the numbers, 4× more Pro Plus deals, 16× faster pipeline internally, give that slogan teeth.
Couple quotes from their call;:
“CEOs are mindful that the global economy is in a fluid state. No, they are not standing still.”
“Across every industry we see a renewed focus on cost-takeout—rooting out inefficiencies, modernizing outdated tech stacks and restoring an integrated enterprise”
“Guidance bakes in a healthy degree of conservatism… demand remains strong, pipelines are scrubbed, coverage ratios look solid”
“U.S. public-sector net-new ACV grew 30 %+ despite tightening budgets”
Here’s how I’d summarize the Google earnings call: “Ads are still humming (finance & retail lead), but capacity, not demand, is the gating factor in Cloud. On AI, they’re flexing both model quality (Gemini 2.5) and distribution (1.5 B AI-overview users, 15 half-billion-user products on Gemini). Throw in confirmation of their $75 B of CapEx and a 10x TPU leap, and the takeaway is clear: Google is betting the balance sheet that AI-native search and infra will widen, not shrink, its moats.”
A couple quotes from their call:
“We saw broad-based strength across ad verticals – search was led by finance (insurance), with retail, health-care and travel also sizable contributors”
“We’re obviously not immune to the macro environment, and the new de-minimis rules will be a slight head-wind to ads in ’25.”
“We’re in a tight demand-supply environment; Cloud growth will vary quarter-to-quarter depending on when new capacity lands.”
“We still plan to invest $75 B in CapEx this year.”
Some more AI specific quotes:
“AI Overviews now serves 1.5 billion users every month”
“Gemini 2.5, our most intelligent model, is already #1 on Chatbot Arena and underpins future innovation.”
“Active users in AI Studio and Gemini API have grown 200 % since January”
“All 15 Google products with ≥ 0.5 B users now run on Gemini models”
“Ironwood, our 7th-gen TPU, delivers 10× more inference compute at nearly 2× power-efficiency”
We can also look outside of tech to get a broader of what’s going on in the economy. TLDR: Big banks still see healthy spend and stable credit, but P&G’s flat volumes, Chipotle’s traffic dip, Delta’s stalled bookings, and D.R. Horton’s order slide all hint that lower- and middle-income consumers are growing cautious as tariffs and high rates hit. Here’s a summary of some key calls:
JP Morgan: CFO Jeremy Barnum said “consumers and small businesses remain financially healthy … spend, cash buffers and credit utilization are in line with expectations,” though he sees some “front-loading of spending” ahead of tariff-driven price hikes and therefore built reserves for a tougher macro backdrop
Bank of America: CEO Brian Moynihan: “Consumers are still solidly in the game,” with combined credit/debit card spending +4 % Y/Y and net charge-offs flat Q/Q at 0.54 %. Internal data shows April spending still running ~5 % above last year, even as tariffs inject uncertainty.
Capital One: CEO Rich Fairbank called the U.S. consumer “in good shape for now.” Q1 card purchase volume +5 % Y/Y, auto spending ticked up as buyers tried to beat tariff-related price increases. Delinquencies are stable, though the share of customers making only minimum payments has edged above pre-COVID levels
American Express: Billed business rose +6 % Y/Y and the company kept its 8-10 % revenue-growth outlook, crediting “continued strong spending by our affluent customer base” despite tariff noise. Gen-Z/Millennial members now drive >60 % of new accounts and show higher FICO scores and lower delinquency than peers.
Procter & Gamble: Organic sales eked out +1 % on more price hikes, but volumes were flat/negative and P&G cut its FY guidance, citing a $1-1.5 B tariff cost hit and “reduced consumer spending given economic uncertainty.” Pricing, not unit growth, is doing the work—signaling a stretched low-end shopper.
Chipotle: Revenue +6 %, yet comparable-restaurant sales slipped 0.4 %—first drop since 2020. Management blamed a February pull-back in visits as consumers “saved money because of concerns around the economy.” Traffic softness shows up quickly in discretionary dining.
Delta: Premium and international demand held up, but corporate-sales growth stalled in Feb–Mar and domestic leisure bookings softened, leading Delta to dial back capacity growth. Execs now describe corporate demand as “flattish” and say confidence has “moderated.”
DR Horton: Net sales orders -15 % Y/Y and the builder trimmed its FY revenue outlook, citing a slower spring selling season, affordability pressures and waning consumer confidence. Management still notes low cancellations and some pick-up in April, but housing clearly feels higher rates first
Quarterly Reports Summary

Top 10 EV / NTM Revenue Multiples

Top 10 Weekly Share Price Movement

Update on Multiples
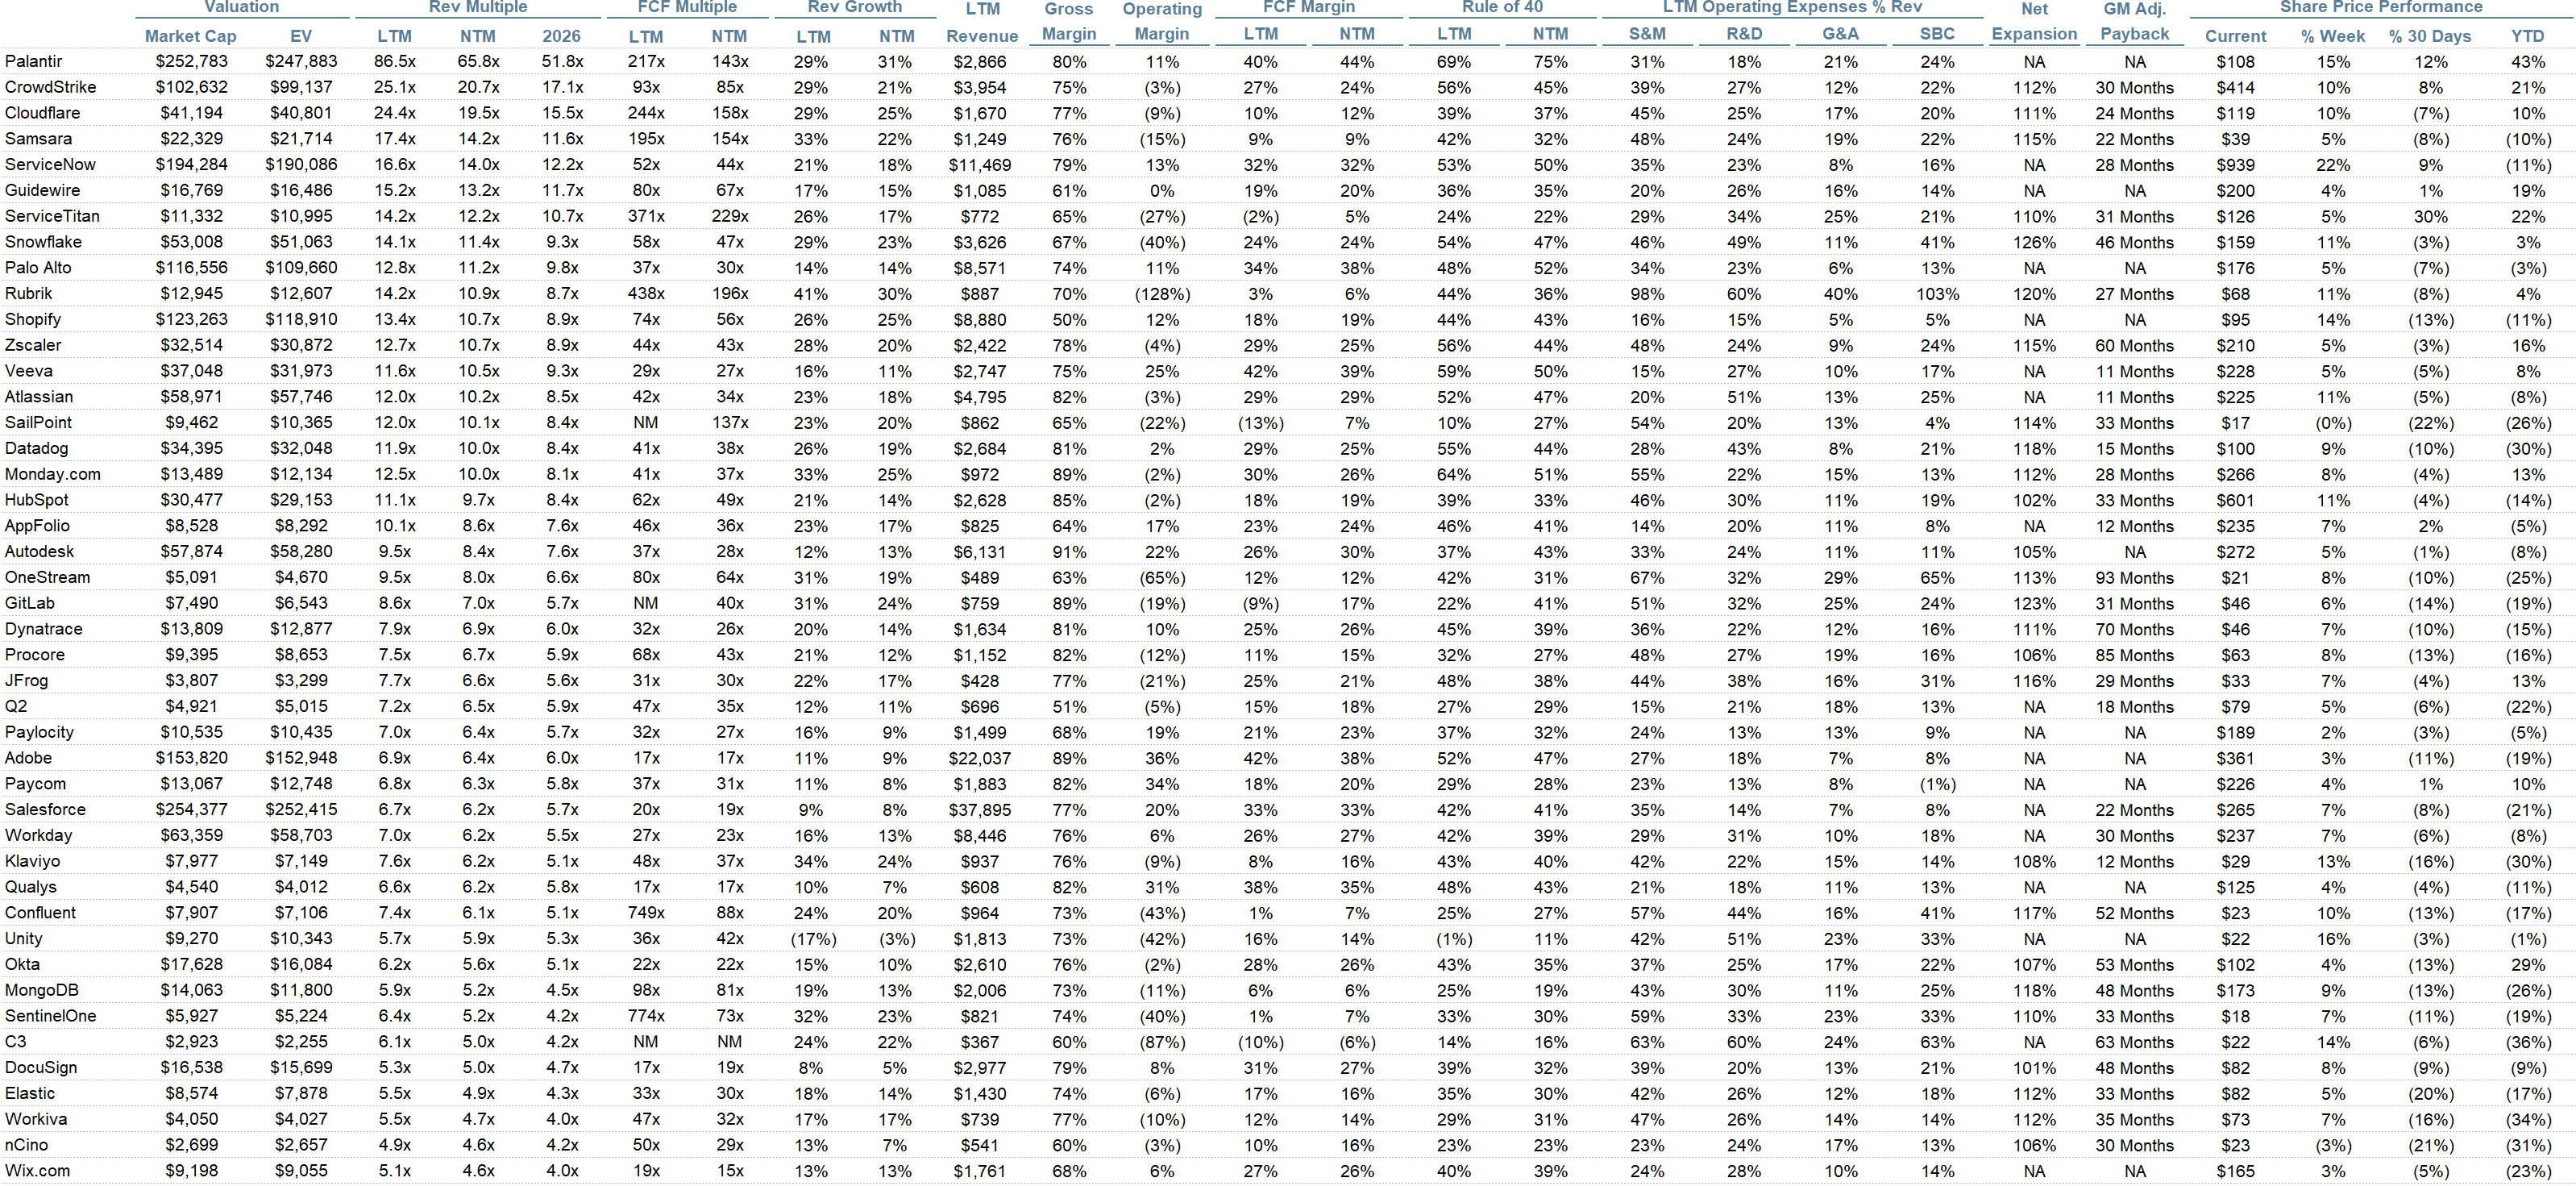
SaaS businesses are generally valued on a multiple of their revenue - in most cases the projected revenue for the next 12 months. Revenue multiples are a shorthand valuation framework. Given most software companies are not profitable, or not generating meaningful FCF, it’s the only metric to compare the entire industry against. Even a DCF is riddled with long term assumptions. The promise of SaaS is that growth in the early years leads to profits in the mature years. Multiples shown below are calculated by taking the Enterprise Value (market cap + debt - cash) / NTM revenue.
Overall Stats:
Overall Median: 5.0x
Top 5 Median: 19.5x
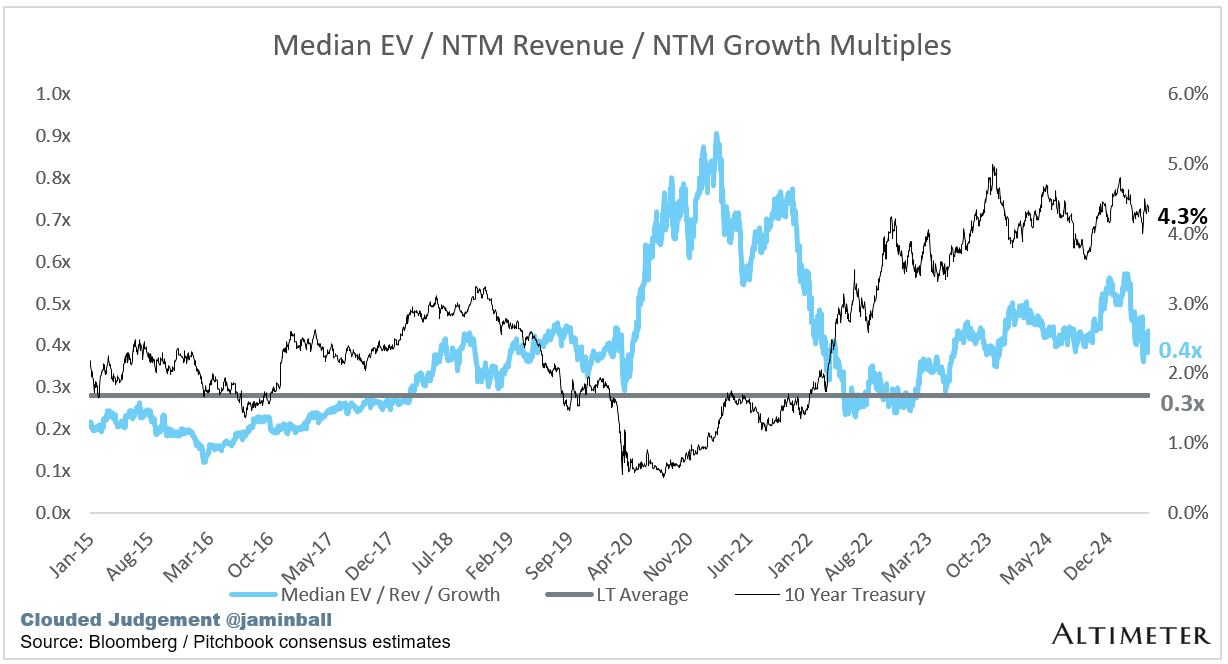
10Y: 4.3%


Bucketed by Growth. In the buckets below I consider high growth >27% projected NTM growth (I had to update this, as there’s only 1 company projected to grow >30% after this quarter’s earnings), mid growth 15%-27% and low growth <15%
High Growth Median: 15.2x
Mid Growth Median: 9.5x
Low Growth Median: 3.9x


EV / NTM Rev / NTM Growth
The below chart shows the EV / NTM revenue multiple divided by NTM consensus growth expectations. So a company trading at 20x NTM revenue that is projected to grow 100% would be trading at 0.2x. The goal of this graph is to show how relatively cheap / expensive each stock is relative to their growth expectations

EV / NTM FCF
The line chart shows the median of all companies with a FCF multiple >0x and <100x. I created this subset to show companies where FCF is a relevant valuation metric.

Companies with negative NTM FCF are not listed on the chart

Scatter Plot of EV / NTM Rev Multiple vs NTM Rev Growth
How correlated is growth to valuation multiple?

Operating Metrics
Median NTM growth rate: 11%
Median LTM growth rate: 15%
Median Gross Margin: 76%
Median Operating Margin (6%)
Median FCF Margin: 16%
Median Net Retention: 108%
Median CAC Payback: 43 months
Median S&M % Revenue: 39%
Median R&D % Revenue: 24%
Median G&A % Revenue: 16%
Comps Output
Rule of 40 shows rev growth + FCF margin (both LTM and NTM for growth + margins). FCF calculated as Cash Flow from Operations - Capital Expenditures
GM Adjusted Payback is calculated as: (Previous Q S&M) / (Net New ARR in Q x Gross Margin) x 12 . It shows the number of months it takes for a SaaS business to payback their fully burdened CAC on a gross profit basis. Most public companies don’t report net new ARR, so I’m taking an implied ARR metric (quarterly subscription revenue x 4). Net new ARR is simply the ARR of the current quarter, minus the ARR of the previous quarter. Companies that do not disclose subscription rev have been left out of the analysis and are listed as NA.

Sources used in this post include Bloomberg, Pitchbook and company filings
The information presented in this newsletter is the opinion of the author and does not necessarily reflect the view of any other person or entity, including Altimeter Capital Management, LP ("Altimeter"). The information provided is believed to be from reliable sources but no liability is accepted for any inaccuracies. This is for information purposes and should not be construed as an investment recommendation. Past performance is no guarantee of future performance. Altimeter is an investment adviser registered with the U.S. Securities and Exchange Commission. Registration does not imply a certain level of skill or training.
This post and the information presented are intended for informational purposes only. The views expressed herein are the author’s alone and do not constitute an offer to sell, or a recommendation to purchase, or a solicitation of an offer to buy, any security, nor a recommendation for any investment product or service. While certain information contained herein has been obtained from sources believed to be reliable, neither the author nor any of his employers or their affiliates have independently verified this information, and its accuracy and completeness cannot be guaranteed. Accordingly, no representation or warranty, express or implied, is made as to, and no reliance should be placed on, the fairness, accuracy, timeliness or completeness of this information. The author and all employers and their affiliated persons assume no liability for this information and no obligation to update the information or analysis contained herein in the future.
Not for Everyone. But maybe for you and your patrons?
Dear Jamin,
I hope this finds you in a rare pocket of stillness.
We hold deep respect for what you've built—and for how.
We’ve just opened the door to something we’ve been quietly handcrafting for years.
Not for mass markets. Not for scale. But for memory and reflection.
Not designed to perform. Designed to endure.
It’s called The Silent Treasury.
A sanctuary where truth, judgment, and consciousness are kept like firewood—dry, sacred, and meant for long winters.
Where trust, vision, patience, and stewardship are treated as capital—more rare, perhaps, than liquidity itself.
The two inaugural pieces speak to a quiet truth we've long engaged with:
1. Why we quietly crave for signals from rare, niche sanctuaries—especially when judgment must be clear.
2. Why many modern investment ecosystems (PE, VC, Hedge, ALT, SPAC, rollups) fracture before they root.
These are not short, nor designed for virality.
They are multi-sensory, slow experiences—built to last.
If this speaks to something you've always felt but rarely seen expressed,
perhaps these works belong in your world.
Both publication links are enclosed, should you choose to enter.
https://tinyurl.com/The-Silent-Treasury-1
https://tinyurl.com/The-Silent-Treasury-2
Warmly,
The Silent Treasury
Sanctuary for strategy, judgment, and elevated consciousness