Every week I’ll provide updates on the latest trends in cloud software companies. Follow along to stay up to date!
Economic Uncertainty
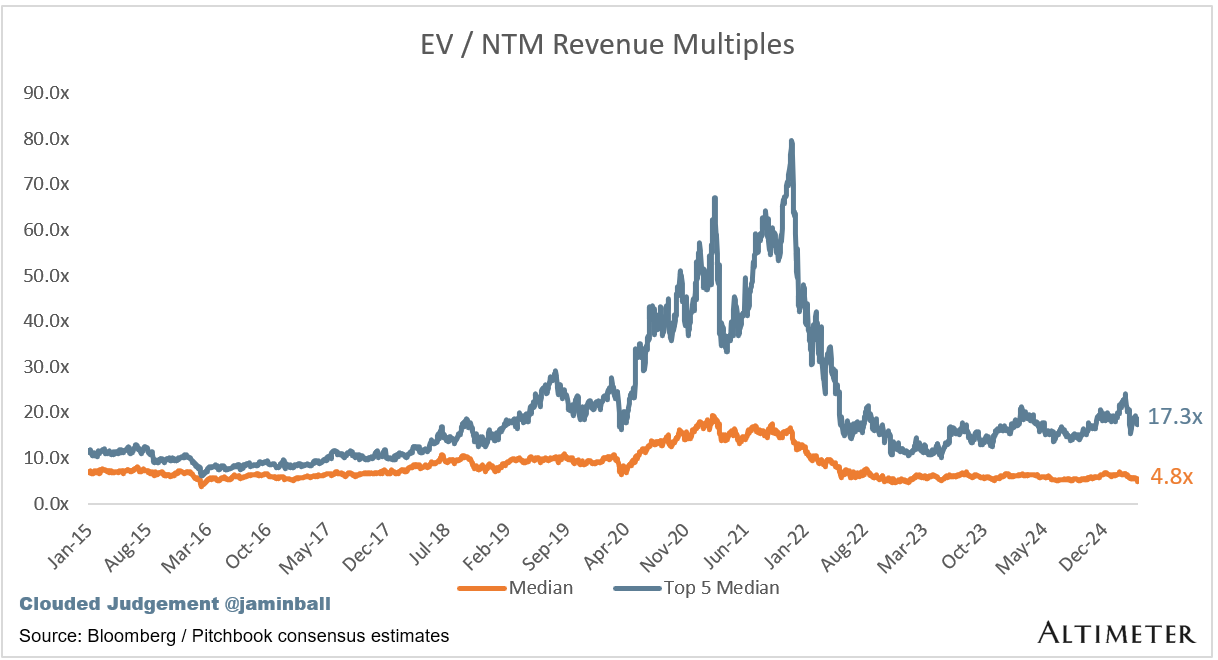
The big news this week was Tariff day! It sure caused a reaction in the markets on Thursday… At the end of day Thursday, the median software NTM revenue multiple was 4.8x. Going back 10 years, we’ve only hit that level twice. Once in Feb ‘16 - the median multiple fell <5x and stayed there for ~3 weeks (the low then bottomed at 3.8x). The second window was about a week long period in November 2022 (bottomed at 4.6x).
A natural reaction could be “why is software getting hammered? Those companies don’t have physical supply chains impacted by tariffs?” While this is true, and the move in software may in fact be an over-reaction (why were Confluent / Mongo both down similar amounts to Nike?), there will certainly be trickle down impacts that effect software. Every CIO is now going to be more cautious. Budgets won’t be as loose. Everyone will “batten down the hatches” to some extent. This means tighter budgets. There is a real “growth scare” in the market (ie “will this trigger a recession?”). And sometimes, recessions can become self fulfilling prophecies. First, everyone is worried about a recession. Then, everyone starts saving (and not spending) money to prepare for that recession. And finally, that reduction in spending leads to GDP contraction and an ultimate recession. Then it spirals.
Why do multiples contract? Generally because growth expectations change. There are times when businesses “re-rate” for other reasons, but generally it’s due to future expectations about growth. If the rest of the world starts to get tighter on budgets, that will trickle to software spend. Renewals will face more scrutiny, expansions won’t be as frictionless, more pressure to bundle, etc. Many of the same things we saw in 2022. There is a lot of uncertainty in the world about future growth expectations, and when growth falls multiples contract.
Q1 earnings season will be fascinating. I don’t think people will really care about Q1 results. They’ll care about the Q2 guide. And given everything going on, it’s EXTREMELY possible that Q2 guides come in INCREDIBLY conservative… It’s easy to kitchen sink the guide and just blame the macro. If you were a CFO, by give yourself a high hurdle rate of a guide with all the uncertainty in the world. Set a low bar, and then beat it if the macro turns out to be “not as bad as feared.” I think this is the real risk in the market today. We’ll kick off Q1 earnings season in a few weeks here, and if Q2 guides end up looking conservative, we could see another leg down.
Of course, the fun with Trump is you never know what will happen! Maybe he pulls back the tariffs (either because other countries capitulate or he just changes his mind). I doubt the latter happens - I think he has a very deep fundamental belief in tariffs. Commerce Secretary Howard Lutnick shared this tweet after the tariff announcement on Wednesday. This was 35 years ago. Trump has held these views on tariffs for a LONG time, and I don’t think he’s changing his mind anytime soon. Those who are hoping for a “this is just Trump being Trump, he’ll change his mind” will be disappointed (I think). As more people come to this conclusion, I think we will see even more “battening down of the hatches.”
For startups, it’s hard to know what this means for you. If you’re an early stage company, nothing probably changes. Keep on operating, keep on building killer products that end customers love. This too shall pass. For mid and late stage companies, there could be more whiplash. Hiring plans should probably move from an annual plan to a “let’s re-evaluate every quarter.” If we do hit a real growth scare, you don’t want to be sitting with a team too large with too much capacity (similar to 2022). At the same time, you don’t want to over-rotate too much. Staying nimble will be key. Getting ahead of this messaging to your broader employee base will be key. Staying attentive to signals from your customer base will be key. And if you need to raise money - best to do it ASAP…
Quarterly Reports Summary
Top 10 EV / NTM Revenue Multiples
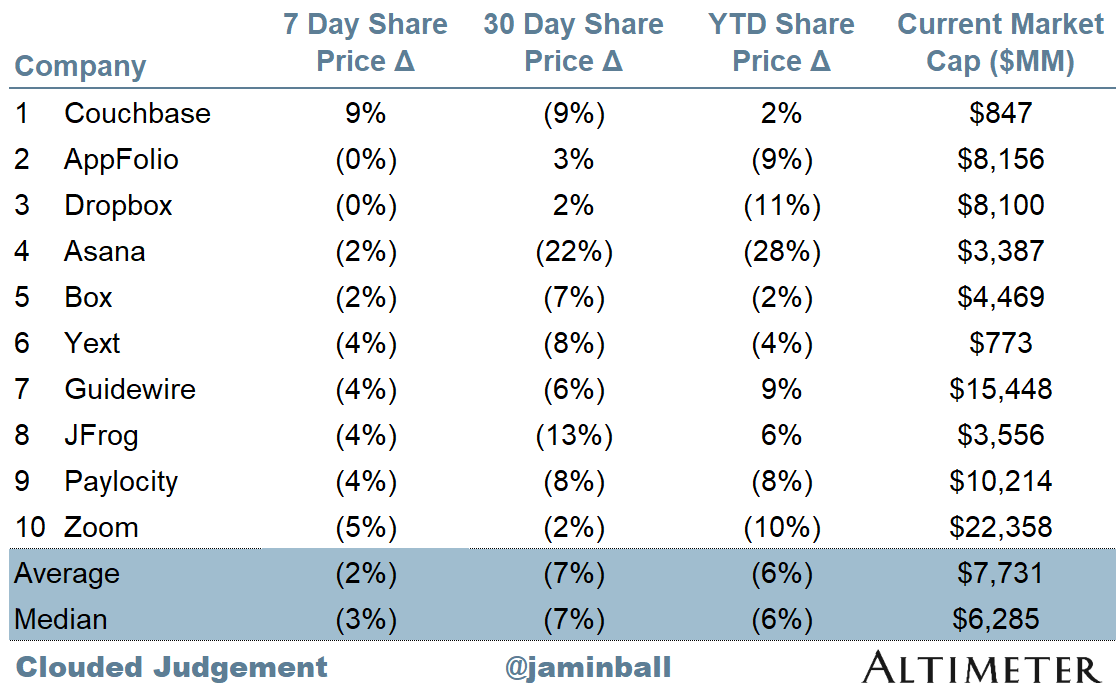
Top 10 Weekly Share Price Movement
Update on Multiples
SaaS businesses are generally valued on a multiple of their revenue - in most cases the projected revenue for the next 12 months. Revenue multiples are a shorthand valuation framework. Given most software companies are not profitable, or not generating meaningful FCF, it’s the only metric to compare the entire industry against. Even a DCF is riddled with long term assumptions. The promise of SaaS is that growth in the early years leads to profits in the mature years. Multiples shown below are calculated by taking the Enterprise Value (market cap + debt - cash) / NTM revenue.
Overall Stats:
Overall Median: 4.8x
Top 5 Median: 17.3x
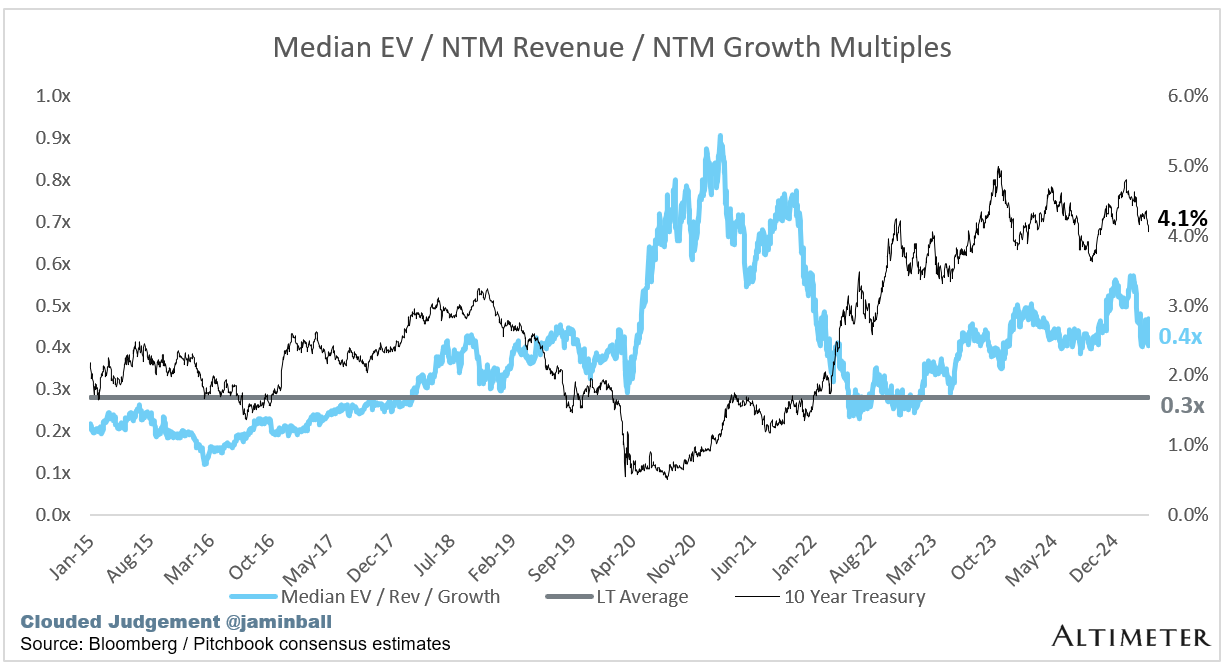
10Y: 4.0%
Bucketed by Growth. In the buckets below I consider high growth >27% projected NTM growth (I had to update this, as there’s only 1 company projected to grow >30% after this quarter’s earnings), mid growth 15%-27% and low growth <15%
High Growth Median: 13.3x
Mid Growth Median: 8.6x
Low Growth Median: 3.8x
EV / NTM Rev / NTM Growth
The below chart shows the EV / NTM revenue multiple divided by NTM consensus growth expectations. So a company trading at 20x NTM revenue that is projected to grow 100% would be trading at 0.2x. The goal of this graph is to show how relatively cheap / expensive each stock is relative to their growth expectations
EV / NTM FCF
The line chart shows the median of all companies with a FCF multiple >0x and <100x. I created this subset to show companies where FCF is a relevant valuation metric.
Companies with negative NTM FCF are not listed on the chart
Scatter Plot of EV / NTM Rev Multiple vs NTM Rev Growth
How correlated is growth to valuation multiple?
Operating Metrics
Median NTM growth rate: 11%
Median LTM growth rate: 15%
Median Gross Margin: 76%
Median Operating Margin (6%)
Median FCF Margin: 16%
Median Net Retention: 108%
Median CAC Payback: 43 months
Median S&M % Revenue: 39%
Median R&D % Revenue: 24%
Median G&A % Revenue: 16%
Comps Output
Rule of 40 shows rev growth + FCF margin (both LTM and NTM for growth + margins). FCF calculated as Cash Flow from Operations - Capital Expenditures
GM Adjusted Payback is calculated as: (Previous Q S&M) / (Net New ARR in Q x Gross Margin) x 12 . It shows the number of months it takes for a SaaS business to payback their fully burdened CAC on a gross profit basis. Most public companies don’t report net new ARR, so I’m taking an implied ARR metric (quarterly subscription revenue x 4). Net new ARR is simply the ARR of the current quarter, minus the ARR of the previous quarter. Companies that do not disclose subscription rev have been left out of the analysis and are listed as NA.
Sources used in this post include Bloomberg, Pitchbook and company filings
The information presented in this newsletter is the opinion of the author and does not necessarily reflect the view of any other person or entity, including Altimeter Capital Management, LP ("Altimeter"). The information provided is believed to be from reliable sources but no liability is accepted for any inaccuracies. This is for information purposes and should not be construed as an investment recommendation. Past performance is no guarantee of future performance. Altimeter is an investment adviser registered with the U.S. Securities and Exchange Commission. Registration does not imply a certain level of skill or training.
This post and the information presented are intended for informational purposes only. The views expressed herein are the author’s alone and do not constitute an offer to sell, or a recommendation to purchase, or a solicitation of an offer to buy, any security, nor a recommendation for any investment product or service. While certain information contained herein has been obtained from sources believed to be reliable, neither the author nor any of his employers or their affiliates have independently verified this information, and its accuracy and completeness cannot be guaranteed. Accordingly, no representation or warranty, express or implied, is made as to, and no reliance should be placed on, the fairness, accuracy, timeliness or completeness of this information. The author and all employers and their affiliated persons assume no liability for this information and no obligation to update the information or analysis contained herein in the future.


Hi, i love your newsletters, so keep up the good work! There seems to be a problem with the two tables at the end of the newsletter (the big list of all the SaaS companies with all the financial data)... When i try to enlarge them, i get an error message.