


Clouded Judgement 5.23.25 - AI Grows the Size of the Prize

Every week I’ll provide updates on the latest trends in cloud software companies. Follow along to stay up to date!
The Size of the Prize is Growing
There’s been a great discussion on X over the last couple weeks. It started when Packy McCormick published a piece called Everything is Technology, with a section titled “In Defense of Megafunds.” Dave Clark from VenCap (him and his team publish great data related to VC / LP markets) then followed up with data of his own. Everyone who’s been following Clouded Judgement knows I’m a bit of an analytical nerd - I love a good data driven discussion. And both Packy and Dave brought lots of good data to a broader discussion around the scalability of venture. Or said another way, will the return profile of venture funds hold up as fund sizes scale. There’s of course no definitive answer to the question. BUT - there’s a good argument that it’s possible (many people say it isn’t). And the data behind this viewpoint all starts with looking at the size of the exit market. A core argument individuals make that venture returns can scale as fund sizes scale is that the size of venture backed exits is growing. Dave brought great data to this (below).

This data is great. What does it show? A top 1% VC backed exit from 2005 - 2009 was $1.4b (and there were 13 exits of this size). From 2020-2024 a top 1% VC backed exit was $10.2b (and there were 22 exits of that size). Said another way, the size of a top 1% exit nearly doubles every 5 years. And as Dave pointed out, if you expect this trend to continue, a top 1% VC backed exit in 10 years will be ~$40b (and maybe there will be ~40 outcomes of this size in a 5 year window). This is what matters most. You can’t look at a venture fund today and make a judgement on its scalability using a lens of today’s exit environment. You have to look through a 10 year out lens (because this is when investments made today will exit). And I personally think there’s a very credible argument that the rate at which the top 1% exits will grow will exceed the prior rate (of roughly doubling every 5 years). Tech platforms compound (mobile > cloud > and now AI). And I think this current AI wave will lead to much faster growing companies with larger exits (I am a VC at the end of the day, I’m an optimist at heart!). Maybe the top 1% outcome in 10 years looks more like $50b - $60b.
At the end of the day, venture has always been a power law game. You’re either in the big winners and have a great fund, or you’re not in them and you don’t. If the power law outcomes start looking like $50-$60b, and if you have a ~$4b fund, then ~8% ownership in one of these power law outcomes returns your fund. And bingo - generally having a fund returner in a fund leads to outsized returns.
There are a lot of other plusses and minuses of a large fund (some I’ve discussed in the past), but if you believe the trend of exit value growth will continue, there is a credible argument to be made that venture returns can hold up as fund sizes scale. Venture will always be about the power law.
Why Are Rates Rising (Again)?
The 10Y Treasury yield quietly spiked last week, from ~4.45% to over 4.6%, and mortgage rates followed suit. The move wasn’t driven by a single event, but a cluster of factors all pointing in the same direction: higher long-term risk, and more inflation uncertainty.
Here’s a breakdown of what’s happening:
1. Moody’s downgrade adds fuel. On Friday, Moody’s downgraded the U.S. credit outlook. It didn’t get as much airtime as it should’ve, but it matters. Combine that with the “big, beautiful” spending bill passed in the House, and you’ve got a bond market that’s starting to price in real sovereign risk. Investors want a higher yield to hold U.S. debt when there’s more concern about long-term fiscal stability.
2. Government spending is back in focus. That same bill (which includes an extension of the 2017 tax cuts) is projected to add $4 trillion to the national debt over the next decade. Even if you believe the U.S. won’t default, you still have to ask: who’s going to buy all this debt? The Treasury is already issuing aggressively. When supply goes up, and demand is soft, yields rise. That’s exactly what we’re seeing.
3. Treasury auctions weren’t great. This past week’s 10Y and 30Y auctions were lukewarm. Not catastrophic, but not strong. Foreign buyers are more cautious. Japan was on holiday. China may be quietly reducing U.S. exposure. And the Fed isn’t buying. That means the marginal buyer needs a bigger incentive (read: higher yield) to step in.
4. Inflation expectations are creeping back. Core CPI remains sticky, and shelter costs are still elevated. Add in the potential for new tariffs and you get a market starting to rethink its “disinflation is here” narrative. Lenders raise rates to protect against future inflation. It’s bond market 101.
5. Rate cuts are off the table (for now). The market’s gone from expecting 3 to 4 cuts this year to maybe just one. A strong labor market, resilient consumer spending, and sticky inflation are pushing the Fed’s hand. If short rates stay higher for longer, and long rates rise too, you get a full re-tightening of financial conditions. That’s what’s happening.
So what? The 10Y yield drives mortgage rates, shapes equity valuations, and sets the tone for the entire market. Even if the Fed holds still, the bond market is moving. And right now, it’s saying: “we need more yield to hold your debt.”
It’s not a panic move. But it’s a warning shot. And if the fiscal outlook gets worse, or inflation proves even stickier, there’s still room for yields to climb. Keep watching the 10Y. It’s doing more tightening than Powell right now.
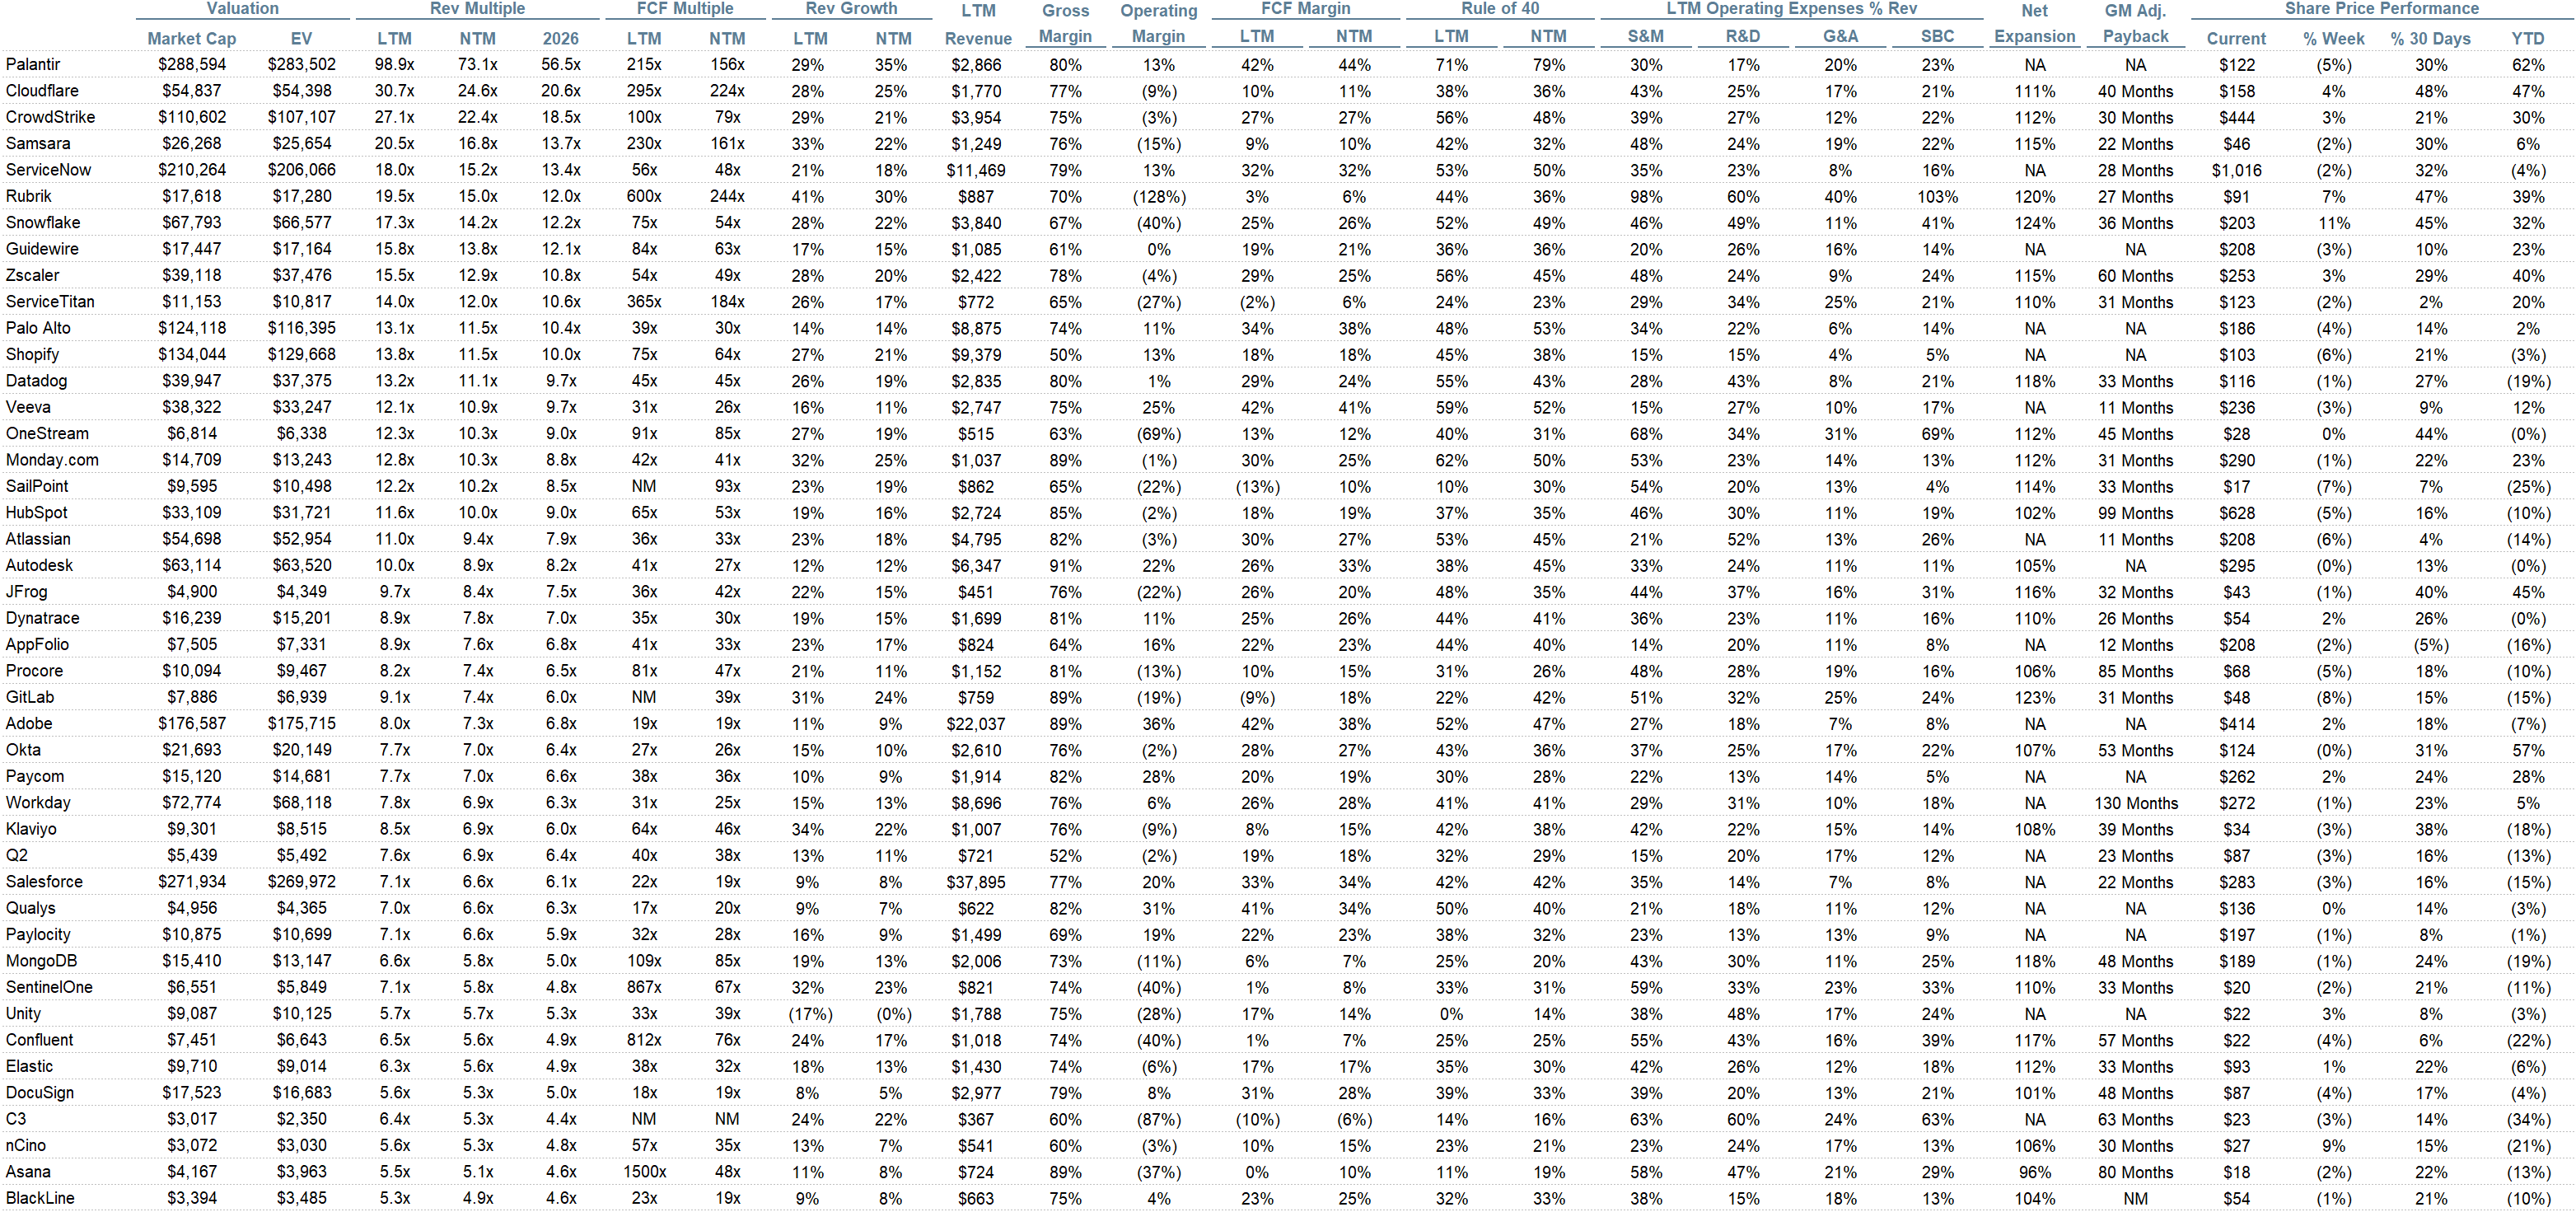
Quarterly Reports Summary

Top 10 EV / NTM Revenue Multiples

Top 10 Weekly Share Price Movement

Update on Multiples
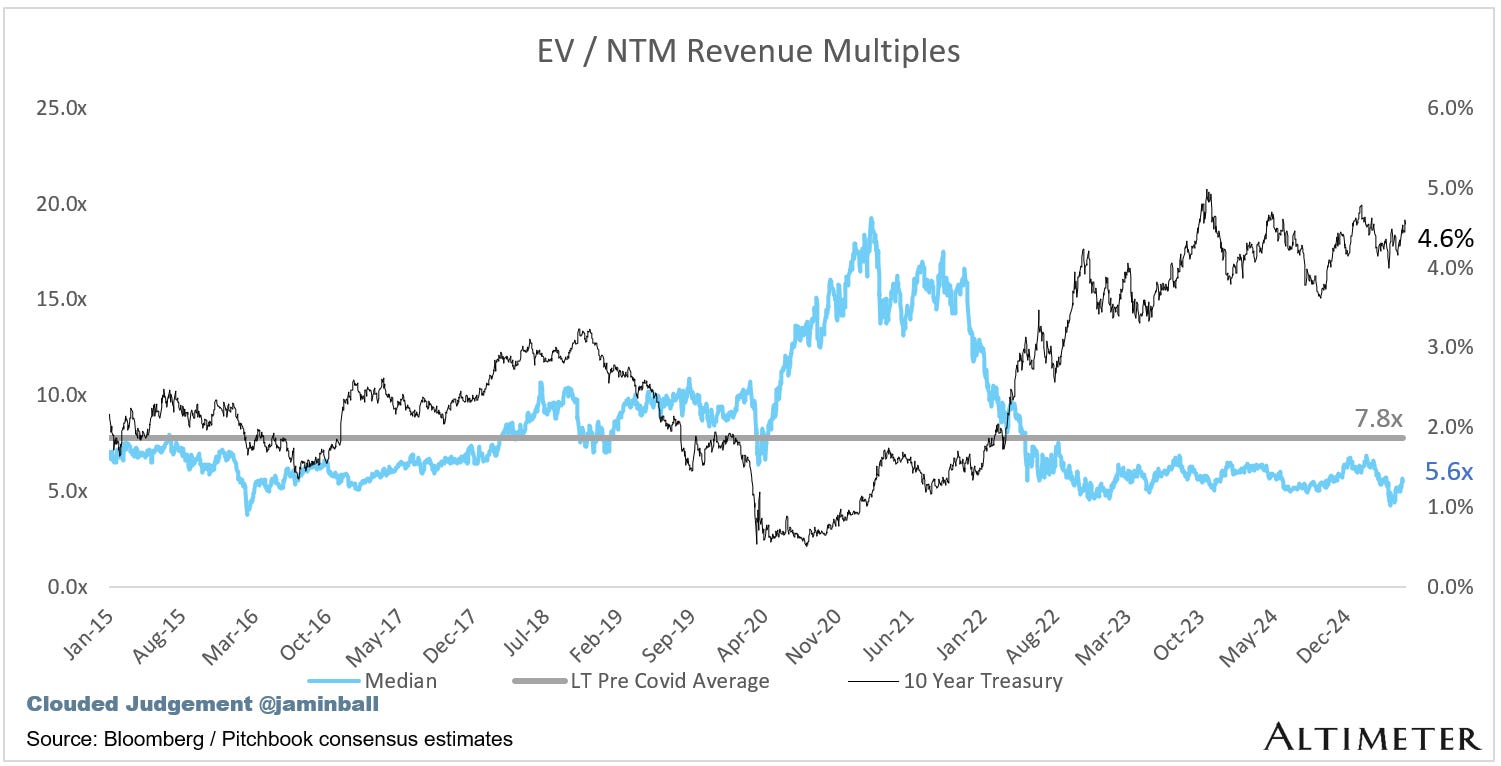
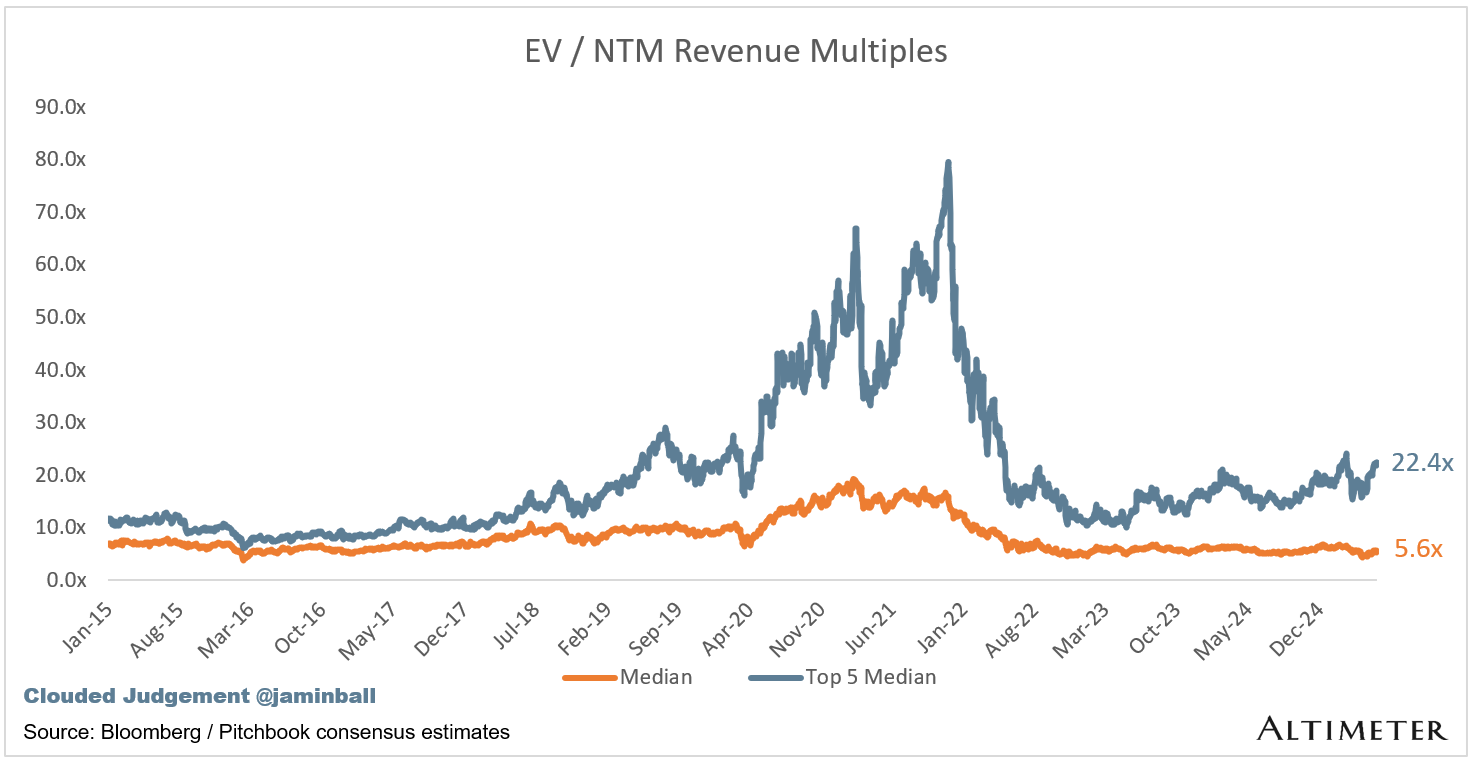
SaaS businesses are generally valued on a multiple of their revenue - in most cases the projected revenue for the next 12 months. Revenue multiples are a shorthand valuation framework. Given most software companies are not profitable, or not generating meaningful FCF, it’s the only metric to compare the entire industry against. Even a DCF is riddled with long term assumptions. The promise of SaaS is that growth in the early years leads to profits in the mature years. Multiples shown below are calculated by taking the Enterprise Value (market cap + debt - cash) / NTM revenue.
Overall Stats:
Overall Median: 5.6x
Top 5 Median: 22.4x
10Y: 4.6%
Bucketed by Growth. In the buckets below I consider high growth >25% projected NTM growth, mid growth 15%-25% and low growth <15%
High Growth Median: 19.8x
Mid Growth Median: 9.4x
Low Growth Median: 4.0x


EV / NTM Rev / NTM Growth
The below chart shows the EV / NTM revenue multiple divided by NTM consensus growth expectations. So a company trading at 20x NTM revenue that is projected to grow 100% would be trading at 0.2x. The goal of this graph is to show how relatively cheap / expensive each stock is relative to their growth expectations


EV / NTM FCF
The line chart shows the median of all companies with a FCF multiple >0x and <100x. I created this subset to show companies where FCF is a relevant valuation metric.

Companies with negative NTM FCF are not listed on the chart

Scatter Plot of EV / NTM Rev Multiple vs NTM Rev Growth
How correlated is growth to valuation multiple?

Operating Metrics
Median NTM growth rate: 11%
Median LTM growth rate: 15%
Median Gross Margin: 76%
Median Operating Margin (4%)
Median FCF Margin: 17%
Median Net Retention: 108%
Median CAC Payback: 41 months
Median S&M % Revenue: 38%
Median R&D % Revenue: 24%
Median G&A % Revenue: 16%
Comps Output
Rule of 40 shows rev growth + FCF margin (both LTM and NTM for growth + margins). FCF calculated as Cash Flow from Operations - Capital Expenditures
GM Adjusted Payback is calculated as: (Previous Q S&M) / (Net New ARR in Q x Gross Margin) x 12 . It shows the number of months it takes for a SaaS business to payback their fully burdened CAC on a gross profit basis. Most public companies don’t report net new ARR, so I’m taking an implied ARR metric (quarterly subscription revenue x 4). Net new ARR is simply the ARR of the current quarter, minus the ARR of the previous quarter. Companies that do not disclose subscription rev have been left out of the analysis and are listed as NA.

Sources used in this post include Bloomberg, Pitchbook and company filings
The information presented in this newsletter is the opinion of the author and does not necessarily reflect the view of any other person or entity, including Altimeter Capital Management, LP ("Altimeter"). The information provided is believed to be from reliable sources but no liability is accepted for any inaccuracies. This is for information purposes and should not be construed as an investment recommendation. Past performance is no guarantee of future performance. Altimeter is an investment adviser registered with the U.S. Securities and Exchange Commission. Registration does not imply a certain level of skill or training. Altimeter and its clients trade in public securities and have made and/or may make investments in or investment decisions relating to the companies referenced herein. The views expressed herein are those of the author and not of Altimeter or its clients, which reserve the right to make investment decisions or engage in trading activity that would be (or could be construed as) consistent and/or inconsistent with the views expressed herein.
This post and the information presented are intended for informational purposes only. The views expressed herein are the author’s alone and do not constitute an offer to sell, or a recommendation to purchase, or a solicitation of an offer to buy, any security, nor a recommendation for any investment product or service. While certain information contained herein has been obtained from sources believed to be reliable, neither the author nor any of his employers or their affiliates have independently verified this information, and its accuracy and completeness cannot be guaranteed. Accordingly, no representation or warranty, express or implied, is made as to, and no reliance should be placed on, the fairness, accuracy, timeliness or completeness of this information. The author and all employers and their affiliated persons assume no liability for this information and no obligation to update the information or analysis contained herein in the future.
Concerning your updates will you decide to lower some stock weightings i.e. Palantir?
Have a great weekend
Matthias