Clouded Judgement 5.27.22
Have We Hit The Bottom? Follow Up from Last Week:
Caveat to everything in this post - we can try to analyze fundamentals as much as possible (valuation fundamentals in the face of rising rates / inflation, as well as business fundamentals in the face of a recession). Right now, none of it matters :) As I mentioned 2 weeks ago, everyone is risk off. Funds are flowing out of equities. In these moments, technicals overwhelm fundamentals. We’ll get back to fundamentals eventually, so this post is hopefully a framework to help navigate that point in time in the future.
Last week I centered the conversation around rate expectations vs valuation expectations for software, and used that to frame a discussion around “have we hit the bottom.” In summary, the broader point was: given where I think rates end this year, we’ve probably gone too low (multiples). However, at the end of last weeks post I brought up the bogey in the room of estimate revisions so I want to unpack that more. At a high level, there’s a growing consensus of a recession. And during a recession, budgets contract, buying / procurement slows, etc. So the natural question is: are forward estimates for software companies too high? IF expectations are for X forward revenue, and in reality a company hits 80% of X, it means the multiple today is artificially “too low” (because the denominator in EV / NTM Rev higher than what it should be). So if estimates get revised down, which we’re already seeing, then today’s real multiples are higher than current consensus based multiples. This may be confusing to follow - but what this implies is if you think multiples should be 6x based on interest rates, and current consensus medians are 6x you may be tempted to say “we’re where we should be.” However, if estimates come down then the multiple will go up, which means there’s still room to fall down to the 6x levels. At the same time, when estimates fall valuations take a double hit. The first hit is the revenue target you’re applying the multiple to falls. At the same time growth is slowing, so the company should have a lower multiple for lower growth. This “double whammy” can be powerful.
Putting aside where multiples should be, if estimates get revised down we’ll have another leg downward. Companies almost never trade up as numbers go down, regardless of their starting point. This is now my base case - I think we’ll have another leg down, driven by the tech “generals.” Granted, I think where we currently are DOES factor in the rate environment + downward revisions, but that’s not what the market says. I do believe the next leg down will have overshot the bottom, but that’s to be expected. For a clearing event to “rebound” we’ll need the Fed to start acting dovish + companies proving numbers were artificially revised down too low. For the former, I don’t foresee this happening before July. For the latter, we won’t have data on who’s fundamentals are still strong until Q2 or Q3 earnings. Net net - I don’t think in any scenario we get a “bounce.” I think we get a slower grind back up to the historical average multiples, which we’re 20% below today. And before that we have another leg down. With that, let’s talk about how I expect software companies to preform in a recession using ‘08 as a precedent.
How Will Software Preform in a Recession? What Happened in ‘08?
This deserves a stand alone post, will do my best to be succinct. TLDR - for the best companies, I expect them to drastically overperform the estimate revisions (which will overshoot to the downside) that will inevitably come. To be clear - I DO NOT expect every software company to outperform. Everyone will use ‘08 as a benchmark, but for reasons we’ll discuss this is a good and bad precedent.
How were things similar / different in ‘08?
The depth of the recession: my base case now is that the ‘08 recession will be much, much worse than what’s in store for us. In ‘08 we were on the brink of systemic collapse. Unemployment hit 10%. Chapter 11 bankruptcy filings hit ~4.5k / month. We’re no where near either of those today, and I don’t expect us to get close to those levels. Net net - I don’t expect nearly as much “belt tightening”
Software in ‘08 was still largely viewed as a cost center. Now, it’s a w to drive revenue and efficiency.
Software is different: In ‘08 we were very early in SaaS. Vendors (like Salesforce or NetSuite) still had to manage their own data centers as they scaled. It wasn’t capex light. In NetSuite’s S-1 they called out plans to open up their second data center in 2008 to meet customer scaling demands. We didn’t have AWS or the public cloud. Below is a very rough and high level summary of how I’ve seen software evolve. I’ve loosely put “SaaS” in the business model row, but it’s also a form of delivery.
Net net - software provides more value today, and is easier to sell / deploy. The friction around software as compared to ‘08 is drastically lower.
All of that being said - in a recession all vendor spend will be scrutinized. When times are good there’s a lot of excess: redundant headcount, bloat in vendor spend, etc. So it’s my base case that all being equal, growth in the immediate short term will be lower than without a recession.
Diving into two iconic early SaaS companies (Salesforce and NetSuite) provide an interesting case study
Pre GFC Salesforce 2010 rev expectations were $1.7B, and they ended up doing $1.67B (in line)
Pre GFC NetSuite 2010 rev expectations were $275M, and they ended up doing $193M (30% miss)
Both business took down their S&M spend, however NetSuite reaction was much more drastic. They spent less on S&M in 2009 than in 2008. Below you can see charts of how Salesforce and NetSuite’s growth and spend changed throughout the recession.
It begs the question - what would have happened if neither business slowed down S&M? Would they have grown straight through the recession?? To answer that question I dug into Salesforce’s sales efficiency (chart below).
As you can see from the chart, sales efficiency was roughly cut in half! It would appear as if growing S&M at a normal rate throughout the recession would not have been the prudent move. However, digging in on the sales efficiency (which is a measure of net new ARR added vs previous quarters S&M spend), I realized that the efficiency on new logo bookings actually stayed relatively constant (0.84 magic number vs 0.72). What changed was churn doubled. Salesforce had a high SMB base that was adversely affected. So each rep was still adding a similar amount of new business throughout the recession, but this was being offset by increasing churn.
So what does this mean? Sticky, market leader businesses like Salesforce probably won’t see as much of a slowdown in new business as feared. At the same time, today we have a new class of software that didn’t exist in ‘08 - infrastructure software. I believe infrastructure software is incredibly sticky. I don’t foresee a big uptick in churn for infrastructure software, and at the same time I don’t see the secular tailwind towards the cloud slowing down so I don’t expect much of a slowdown in new business for leading cloud infra.
All of this to say - I’m not nearly as bearish on a recessions impact on business fundamentals as most. For the average software business, they probably feel some pain. But for the strongest ones, I think ‘22 will show the market how resilient software is.
The final piece of data I’ll leave you with is an analysis of the SaaS companies growth throughout the ‘08 recession. The data in the chart below comes from 13 public SaaS companies (I excluded the public vertical SaaS companies from this time period). As you can see - growth came down. Was it a result of cutting spend? Budgets getting cut? More friction in how software was deployed / sold back then? Some similarities, some differences. Either way, we’ll learn a lot about software over the coming 18 months.
Now on to the regularly scheduled programing of multiples updates:
Quarterly Reports Summary
Top 10 EV / NTM Revenue Multiples
Top 10 Weekly Share Price Movement
Update on Multiples
SaaS businesses are valued on a multiple of their revenue - in most cases the projected revenue for the next 12 months. Multiples shown below are calculated by taking the Enterprise Value (market cap + debt - cash) / NTM revenue.
Overall Stats:
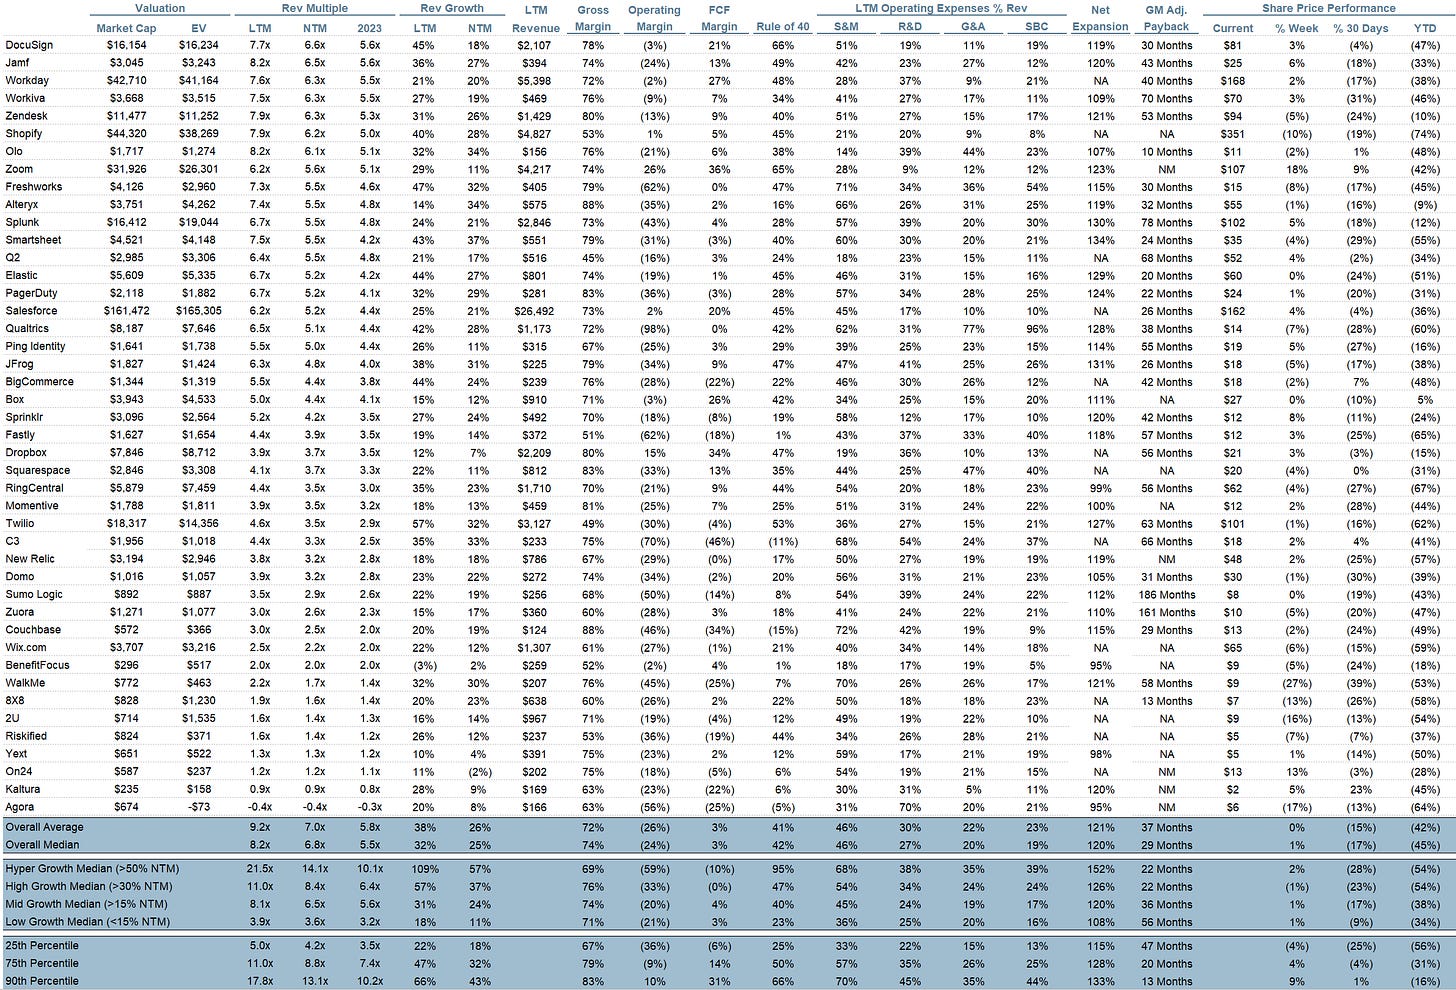
Overall Median: 6.8x
Top 5 Median: 16.2x
3 Month Trailing Average: 8.3x
1 Year Trailing Average: 12.8x
Bucketed by Growth. In the buckets below I consider high growth >30% projected NTM growth, mid growth 15%-30% and low growth <15%
High Growth Median: 8.4x
Mid Growth Median: 6.6x
Low Growth Median: 3.5x
Scatter Plot of EV / NTM Rev Multiple vs NTM Rev Growth
How correlated is growth to valuation multiple?
Growth Adjusted EV / NTM Rev
The below chart shows the EV / NTM revenue multiple divided by NTM consensus growth expectations. The goal of this graph is to show how relatively cheap / expensive each stock is relative to their growth expectations
Operating Metrics
Median NTM growth rate: 25%
Median LTM growth rate: 32%
Median Gross Margin: 74%
Median Operating Margin (24%)
Median FCF Margin: 3%
Median Net Retention: 120%
Median CAC Payback: 29 months
Median S&M % Revenue: 42%
Median R&D % Revenue: 27%
Median G&A % Revenue: 20%
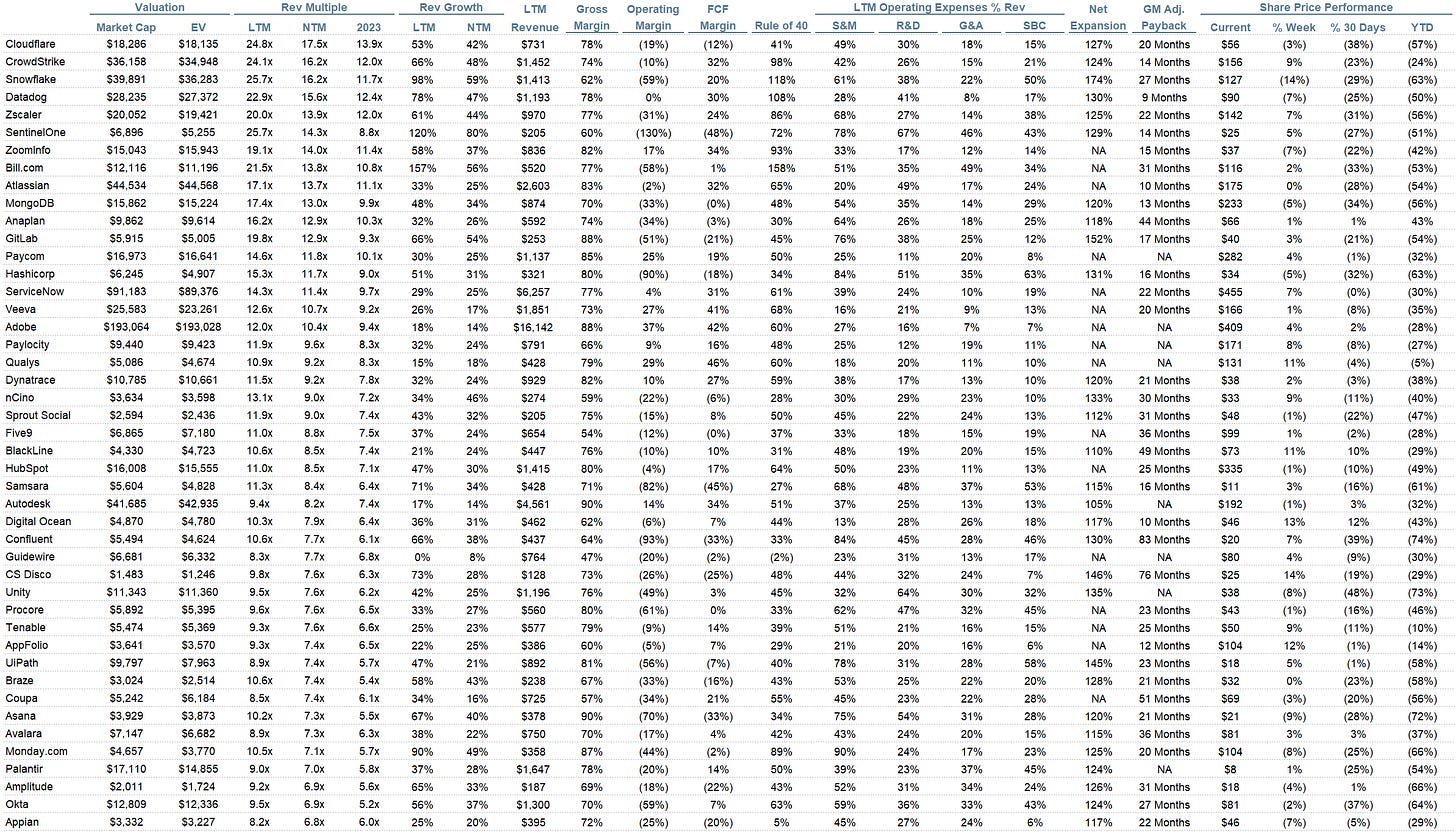
Comps Output
Rule of 40 shows LTM growth rate + LTM FCF Margin. FCF calculated as Cash Flow from Operations - Capital Expenditures
GM Adjusted Payback is calculated as: (Previous Q S&M) / (Net New ARR in Q x Gross Margin) x 12 . It shows the number of months it takes for a SaaS business to payback their fully burdened CAC on a gross profit basis. Most public companies don’t report net new ARR, so I’m taking an implied ARR metric (quarterly subscription revenue x 4). Net new ARR is simply the ARR of the current quarter, minus the ARR of the previous quarter. Companies that do not disclose subscription rev have been left out of the analysis and are listed as NA.
This post and the information presented are intended for informational purposes only. The views expressed herein are the author’s alone and do not constitute an offer to sell, or a recommendation to purchase, or a solicitation of an offer to buy, any security, nor a recommendation for any investment product or service. While certain information contained herein has been obtained from sources believed to be reliable, neither the author nor any of his employers or their affiliates have independently verified this information, and its accuracy and completeness cannot be guaranteed. Accordingly, no representation or warranty, express or implied, is made as to, and no reliance should be placed on, the fairness, accuracy, timeliness or completeness of this information. The author and all employers and their affiliated persons assume no liability for this information and no obligation to update the information or analysis contained herein in the future.


Terrific job here, Jamin. Thanks for the research, analysis, and insight as always.
Thanks Jamin!
Can you share the last two tables in excel format?