
Clouded Judgement 5.29.26 - The Second Life of a GPU

Every week I’ll provide updates on the latest trends in cloud software companies. Follow along to stay up to date!
The Second Life of a GPU
Last week I wrote a post on the opportunity for Neoclouds. At the end I teased out an idea that these businesses could really surprise people if chips retained value after a 4-5 year useful life, and I wanted to unpack that a bit this week.
First - it’s important to go through some of the unit economics / business model of these Neoclouds to understand why the useful life of these chips matter. There’s largely three different types of “deals” different offtakers (ie labs, hyperscalers, AI natives, etc) make with these neoclouds. Bare metal, “managed kubernetes”, and “full cloud.” Bare metal is the most stripped-down offering. The neocloud delivers the physical GPUs, networking, and power, and the customer brings everything else (their own scheduler, orchestration, storage layer, software stack), essentially renting the raw iron. Managed Kubernetes is the middle ground. The neocloud handles the orchestration layer on top of the bare metal (so the customer doesn't have to babysit cluster management, node failures, networking config, etc), but the customer is still running their own workloads and software. Full cloud is the closest analog to what AWS / Azure / GCP offer. The neocloud bundles compute with a full suite of services (storage, databases, networking primitives, managed inference endpoints, observability, etc), and the customer is effectively buying a "cloud" experience rather than just chips. As you move higher up (from bare metal to full cloud) generally you can charge higher rates / hour because you’re offering more.
For this post, I’ll use more “bare metal” assumptions. From the Neoclouds perspective this generally means they’re signing a single offtake site - one customer takes the entire site. It’s not a “cloud” where many different customers (ie scaling AI native startups) all use / share the resources.
To understand the unit economics, let’s first dig into the costs. Neoclouds generally buy the hardware (vs lease, there’s tradeoffs to both). BUT - buying gives you access to the residual value of the chips (which is the point of this post), and generally a lower cost of capital. The other point to highlight is many of these businesses are structured as “sub projects” or “sub entities".” Think of these projects as an individual data center. There’s a parent co (the Neocloud), with a number of projects (ie data centers) sitting beneath the parent.
To finance each project, the sources generally include some combo of project level debt, project level equity (think co-investors who invest equity for return on their equity), and equity from the parent co.
The debt is generally tied to the single contract for the site. The debt provider is looking at counter party risk. What is the likelihood that customer is around for the life of the contract? If they stick around and pay, we (the debt provider get paid). If they go away, go out of business, break their contract, etc, then the Neocloud has to find a replacement customer or they risk not being able to pay back the debt. So it really matters who the end customer is. If that end customer (the offtake) has high credit worthiness, a good reputation, etc, the debt provider probably gives a better rate.
When I say the debt is tied to the contract, what I mean is the debt is amortized over the lifetime of the contact. If the single offtaker is signing a 4-5 year deal, the debt will have a 4-5 year term (ie paid off in 4-5 years).
Ok - so let’s bring this back to the original point of the article. What are the implications of chips having a longer useful life than 4-5 years. After the Neolabs have “completed” a contract with an initial offtaker (ie 4-5 year deal), the debt has been fully paid off. IF the chips have value after that period, the Neolab can “recontract” the site. It will certainly be at meaningfully lower price per hour per chip, BUT without an interest expense the profit margins can skyrocket. These recontracting deals will almost certainly be for inference vs training (folks will want to train on frontier chips), BUT if you believe inference will explode (which I do), there will be SOO much demand for inference compute in the future. And these recontracting deals could prove to be extremely profitable.
I’m writing this post much later in the evening than normal, and I think I’m starting to ramble / not write as clearly as I’d like…But the takeaway - I believe chips will have a longer useful life than the original contracts they’re being signed to support, and if they do we could see a meaningful lift to neolab profitability.
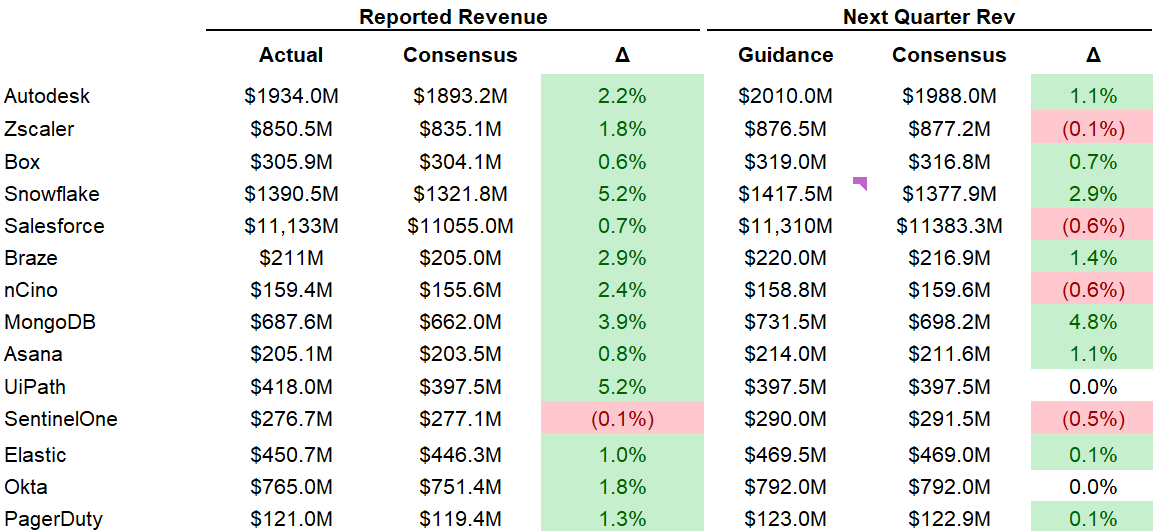
Quarterly Reports Summary
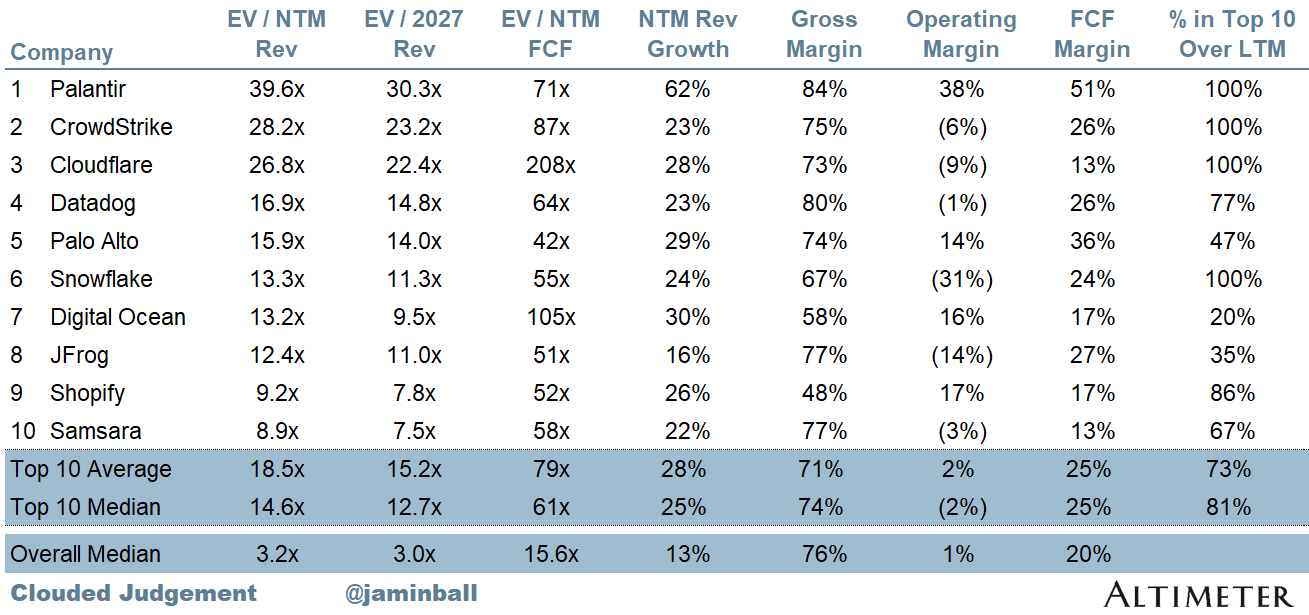
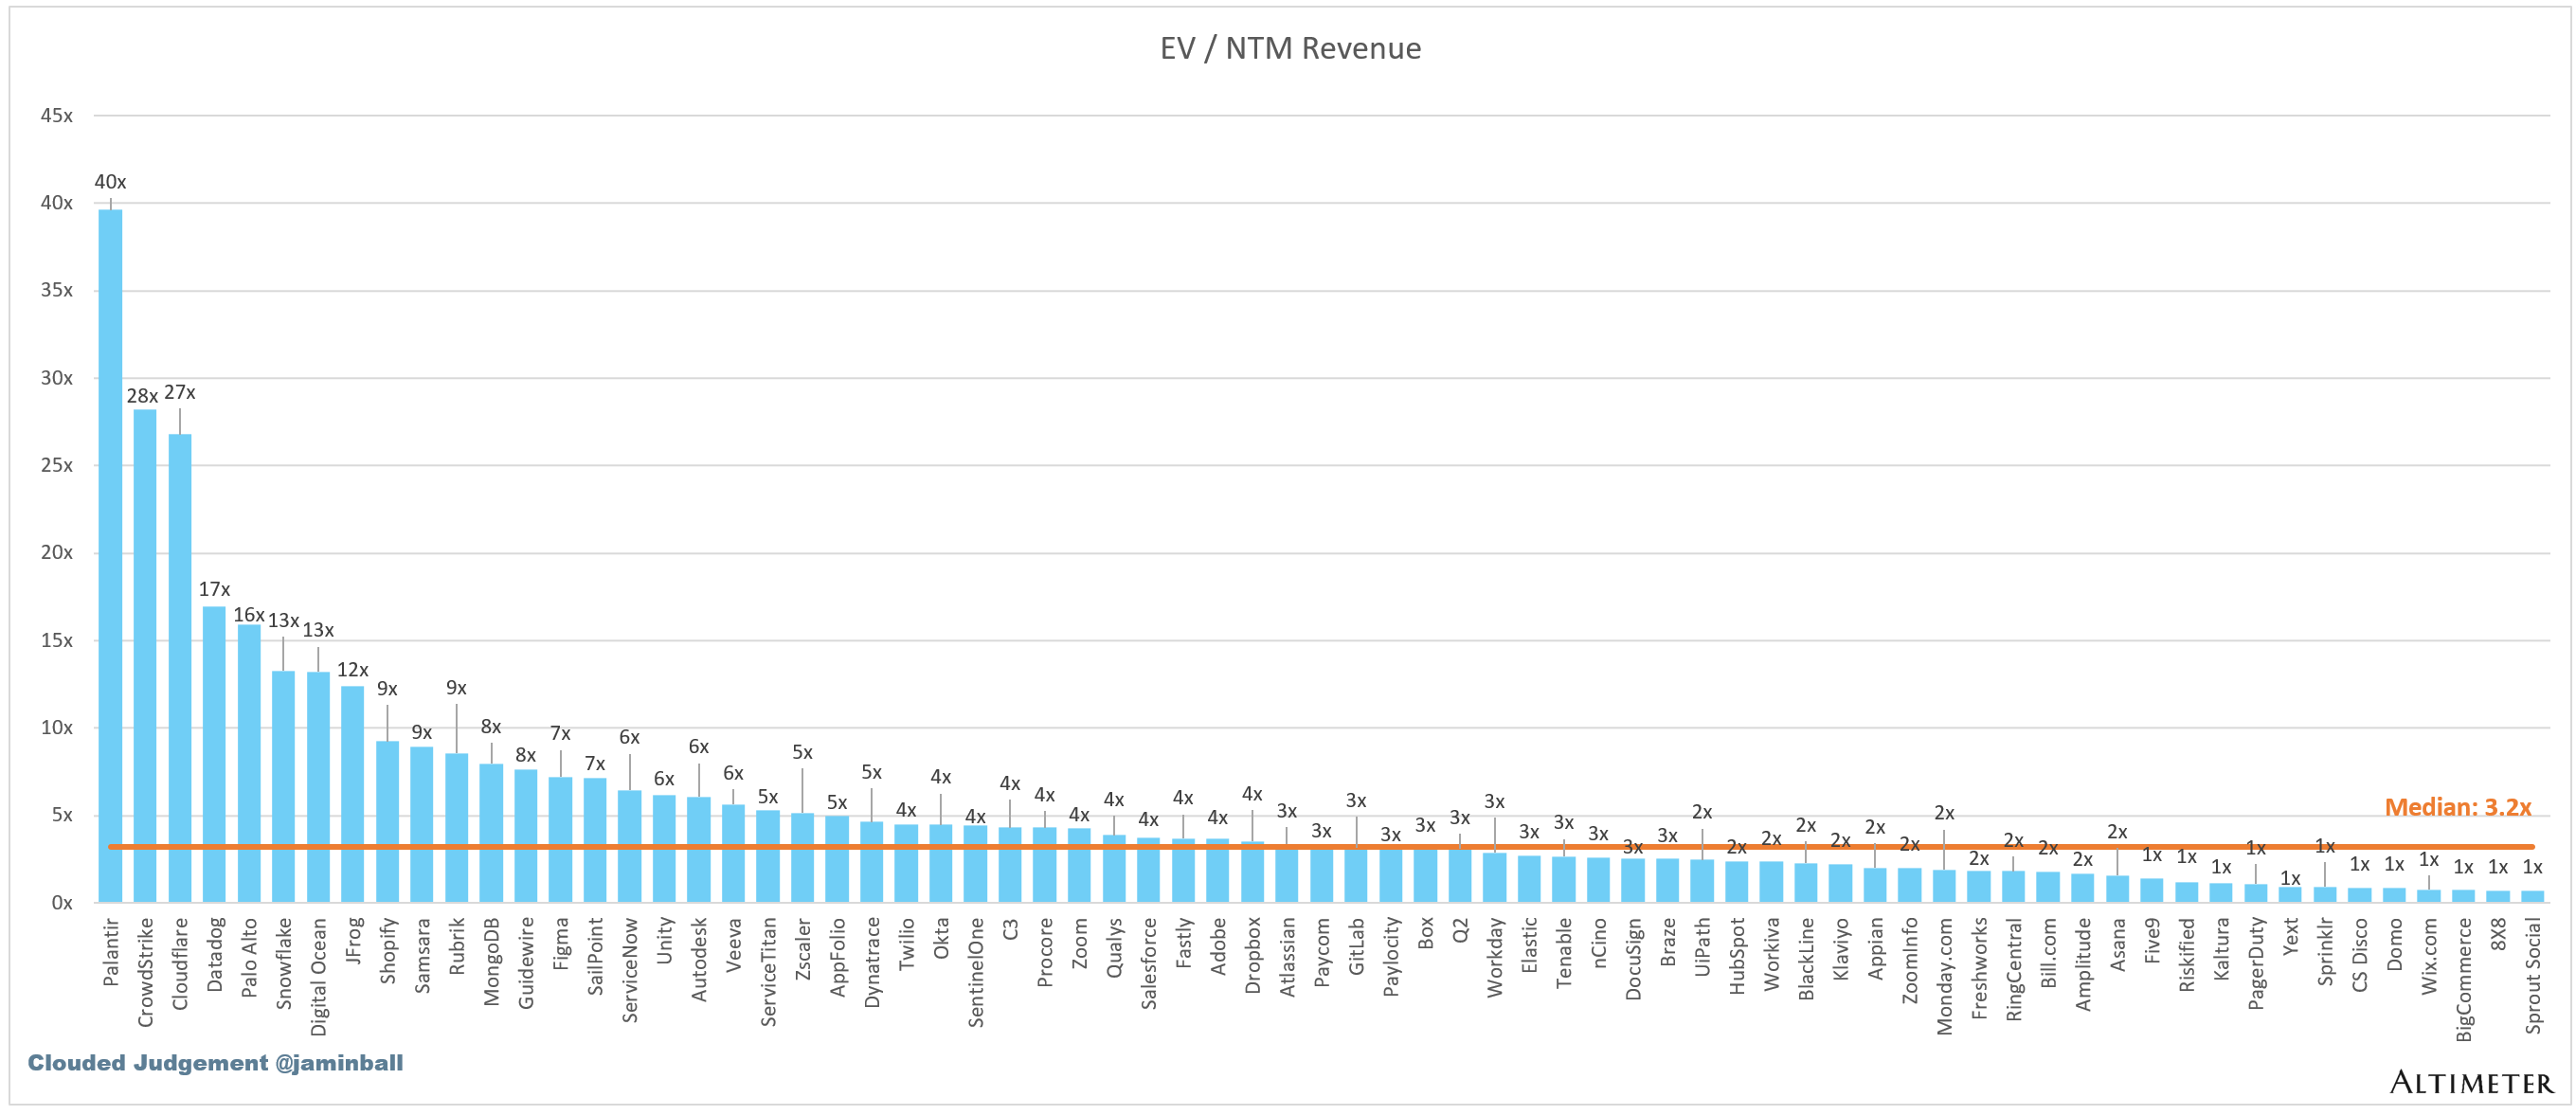
Top 10 EV / NTM Revenue Multiples
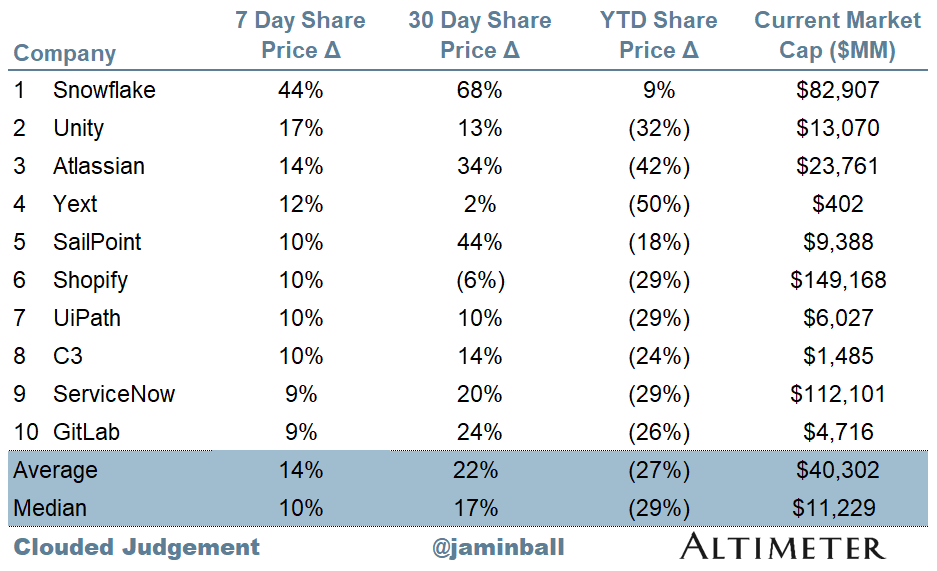
Top 10 Weekly Share Price Movement
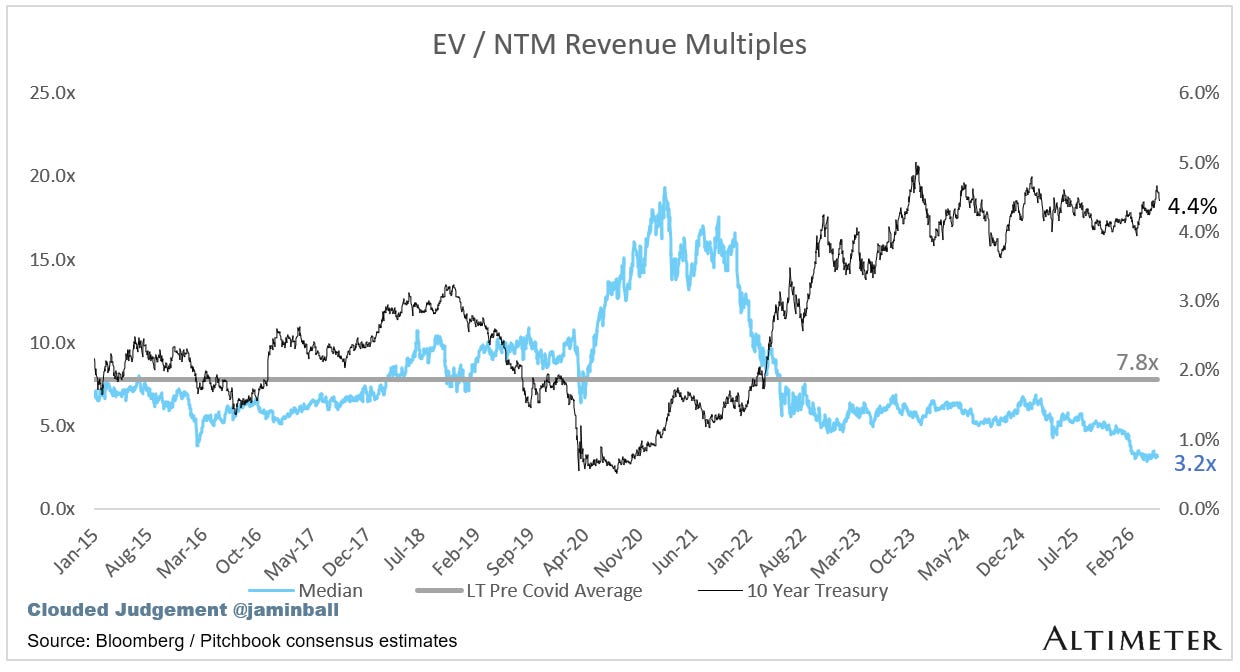
Update on Multiples
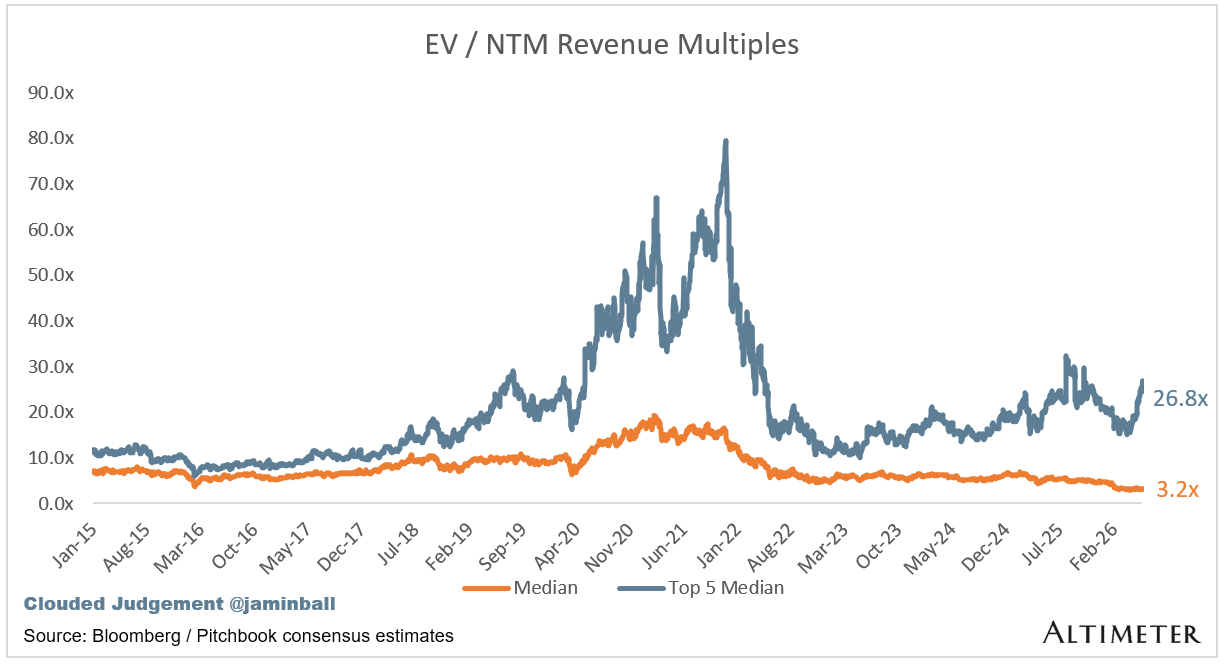
SaaS businesses are generally valued on a multiple of their revenue - in most cases the projected revenue for the next 12 months. Revenue multiples are a shorthand valuation framework. Given most software companies are not profitable, or not generating meaningful FCF, it’s the only metric to compare the entire industry against. Even a DCF is riddled with long term assumptions. The promise of SaaS is that growth in the early years leads to profits in the mature years. Multiples shown below are calculated by taking the Enterprise Value (market cap + debt - cash) / NTM revenue.
Overall Stats:
Overall Median: 3.2x
Top 5 Median: 26.8x
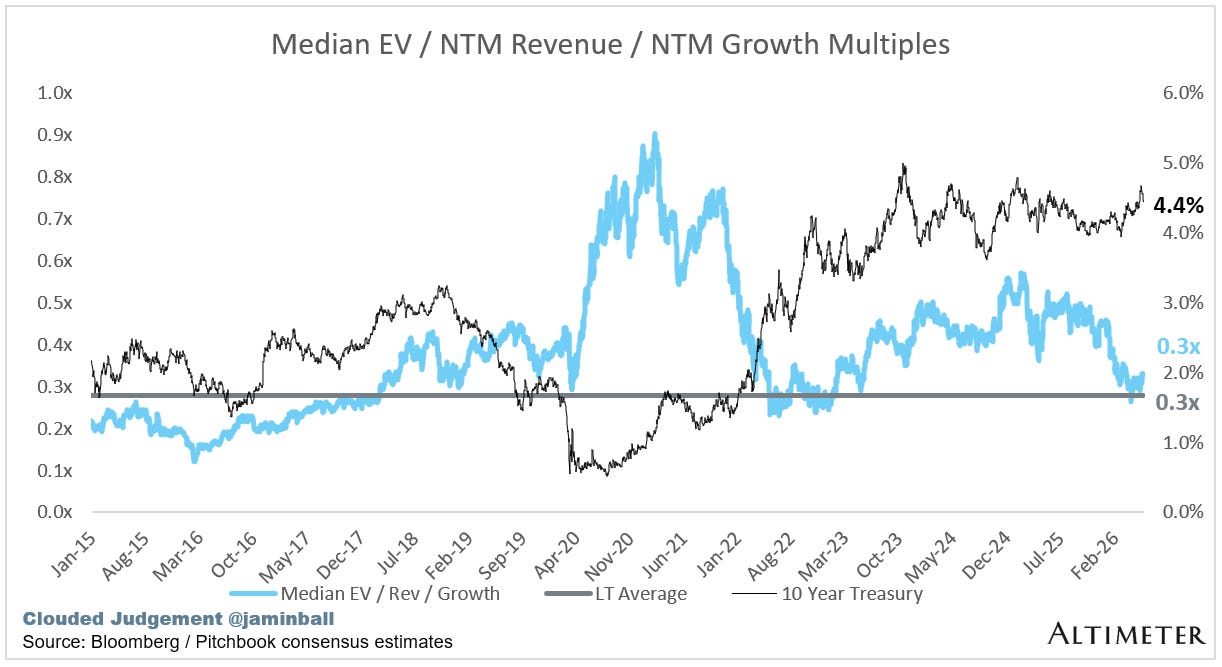
10Y: 4.4%
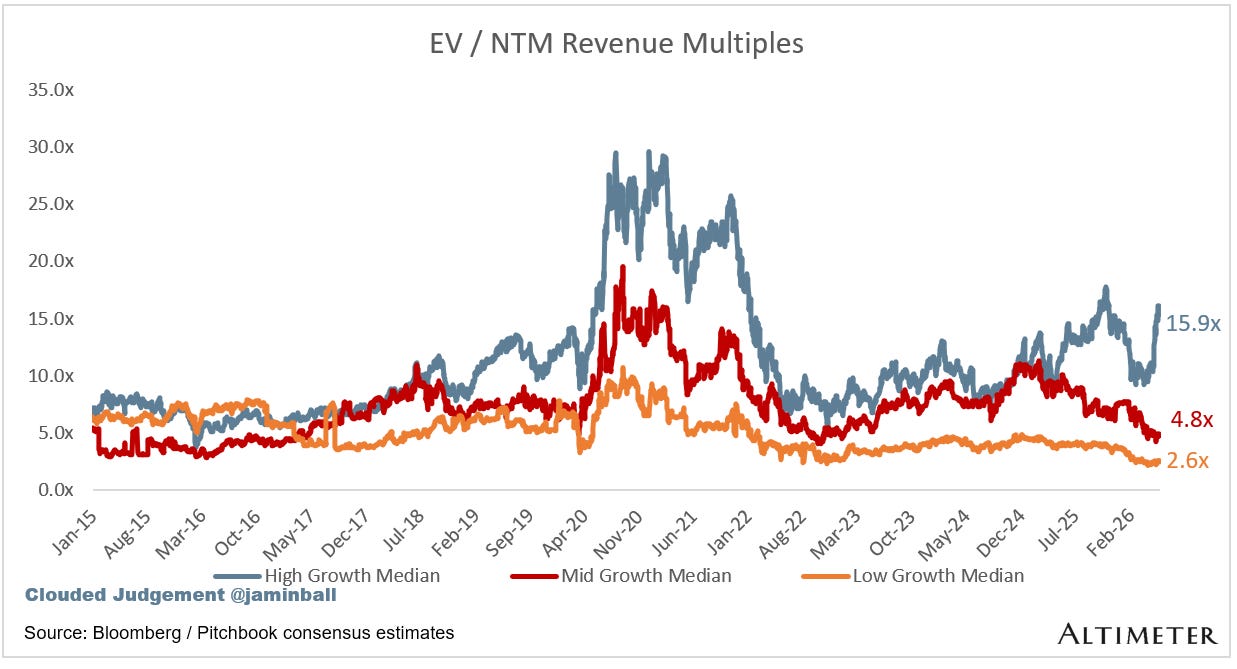
Bucketed by Growth. In the buckets below I consider high growth >22% projected NTM growth, mid growth 15%-22% and low growth <15%. I had to adjusted the cut off for “high growth.” If 22% feels a bit arbitrary, it’s because it is…I just picked a cutoff where there were ~10 companies that fit into the high growth bucket so the sample size was more statistically significant
High Growth Median: 15.9x
Mid Growth Median: 4.8x
Low Growth Median: 2.6x
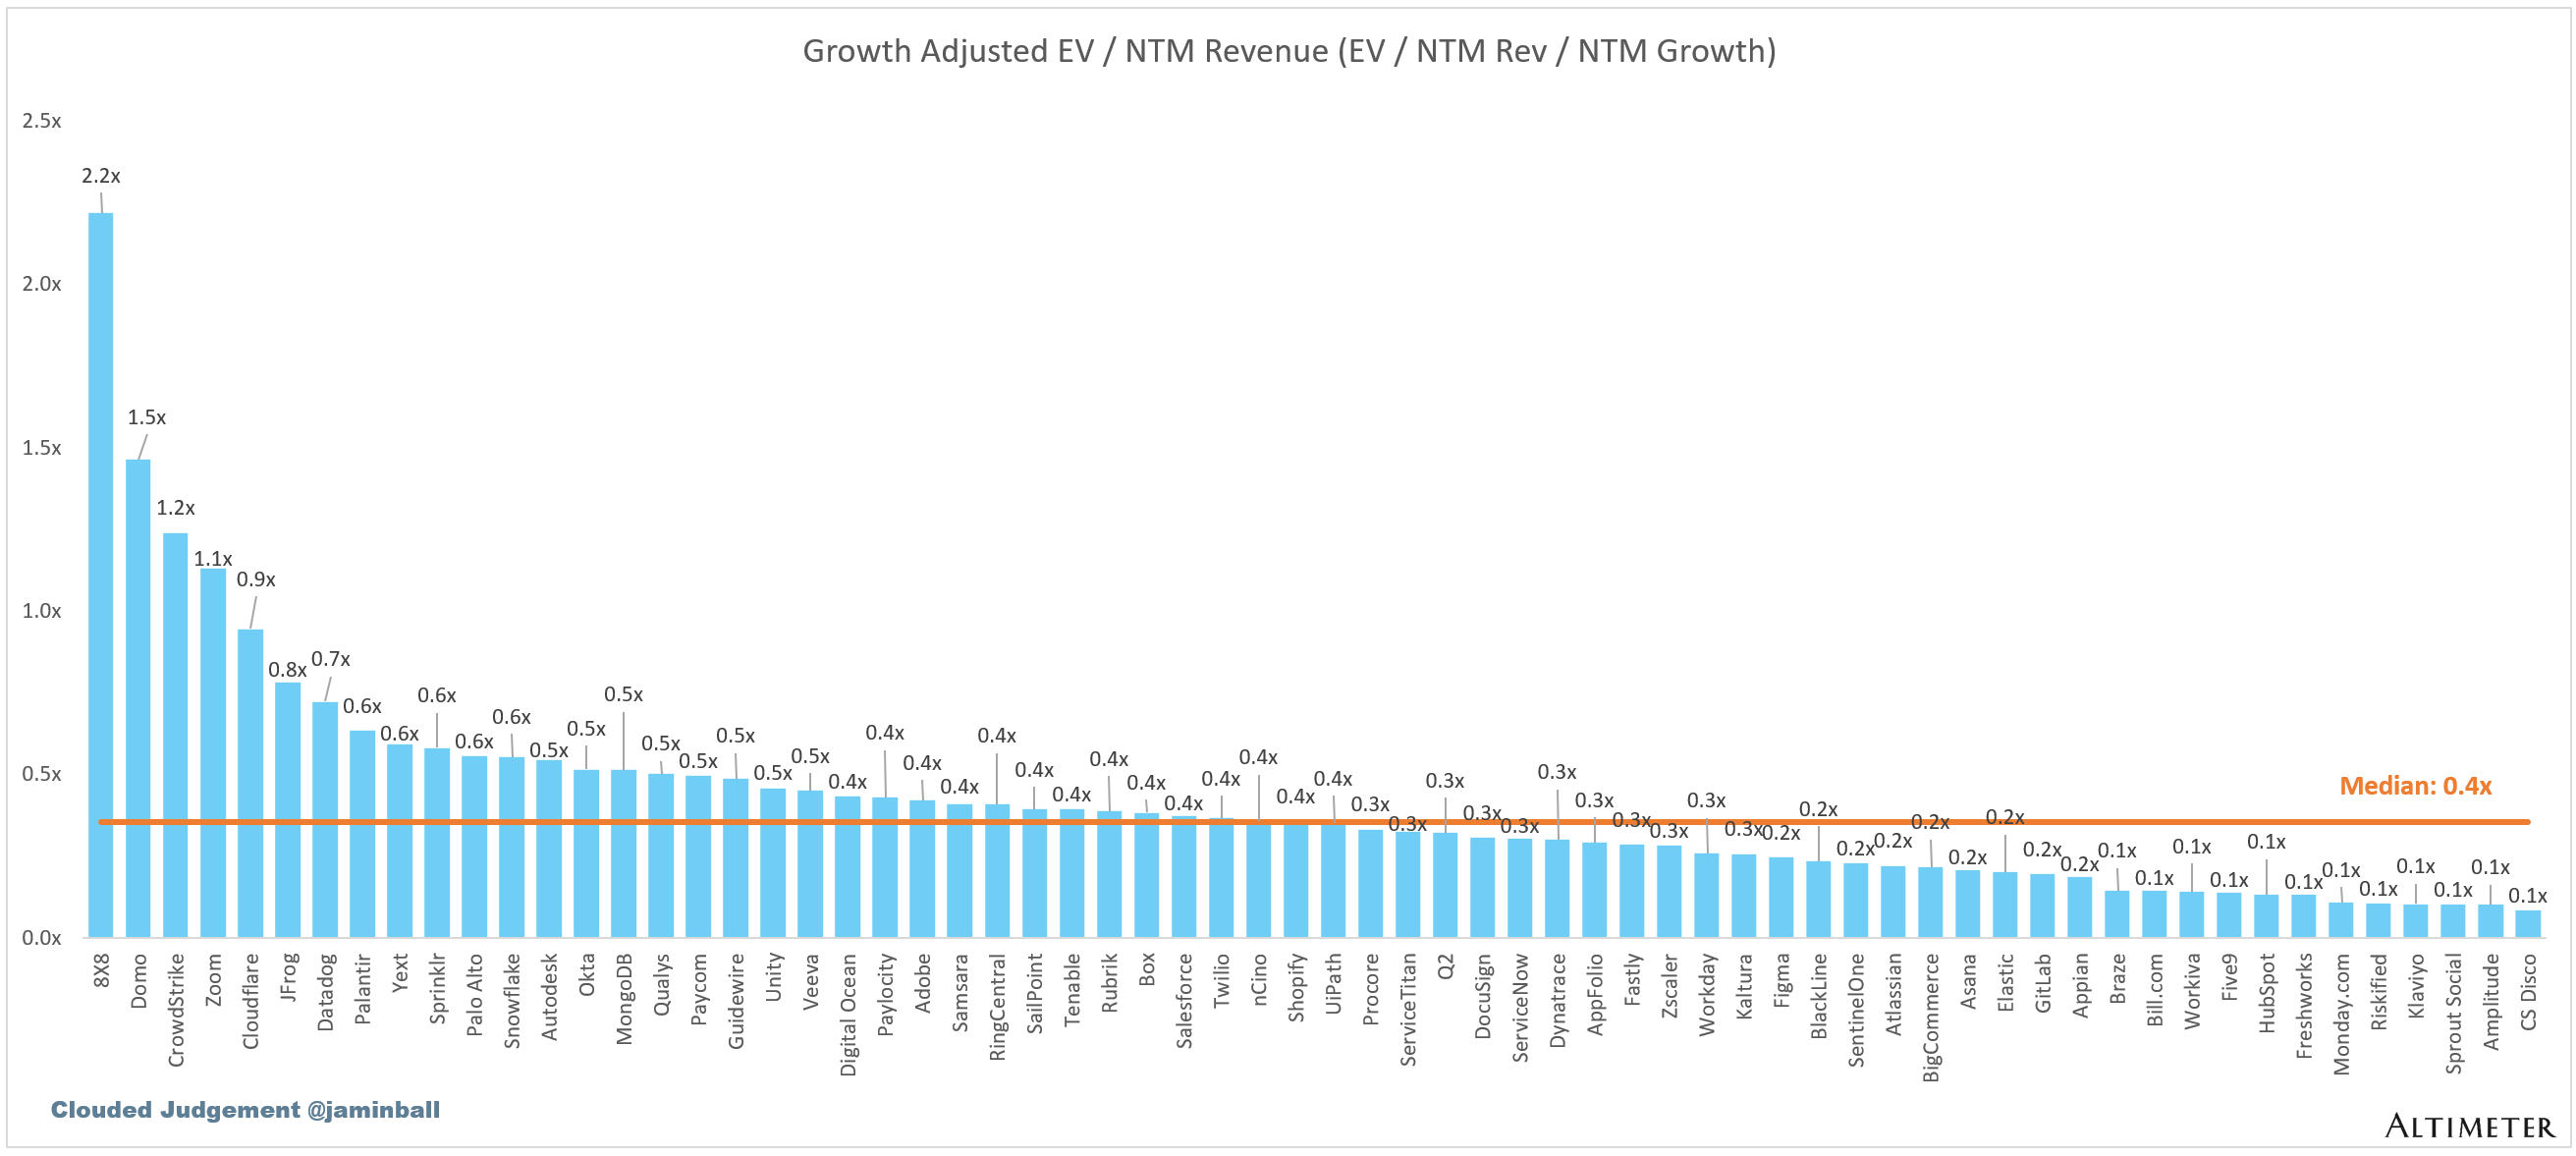
EV / NTM Rev / NTM Growth
The below chart shows the EV / NTM revenue multiple divided by NTM consensus growth expectations. So a company trading at 20x NTM revenue that is projected to grow 100% would be trading at 0.2x. The goal of this graph is to show how relatively cheap / expensive each stock is relative to its growth expectations.
EV / NTM FCF
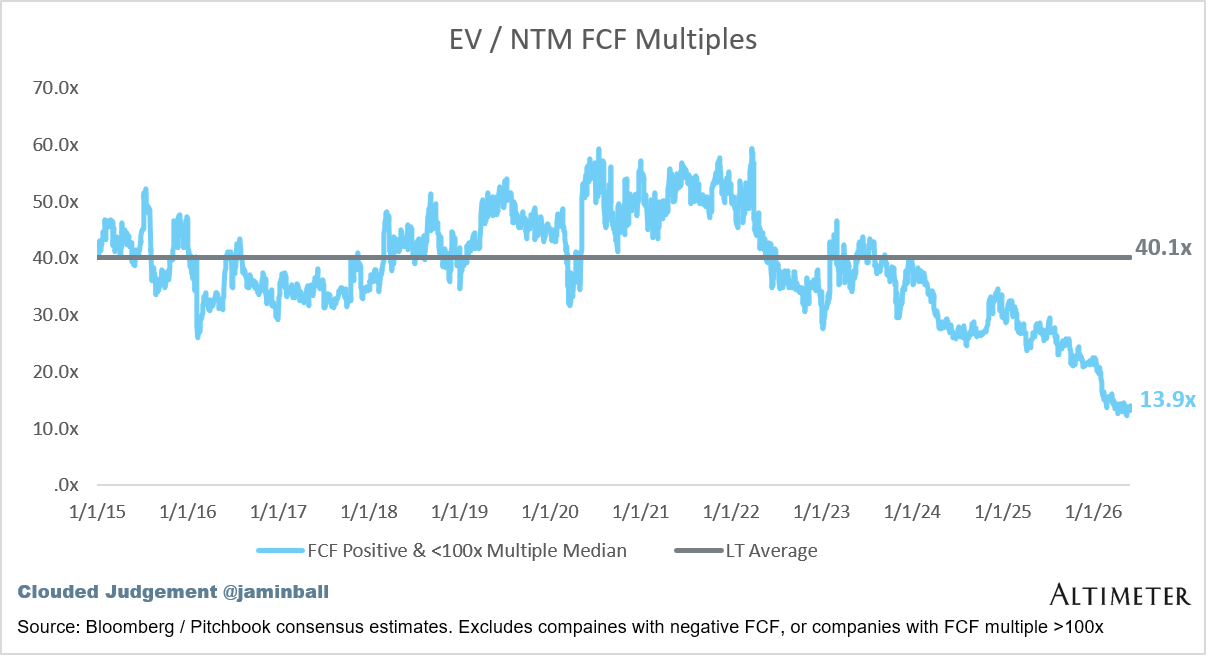
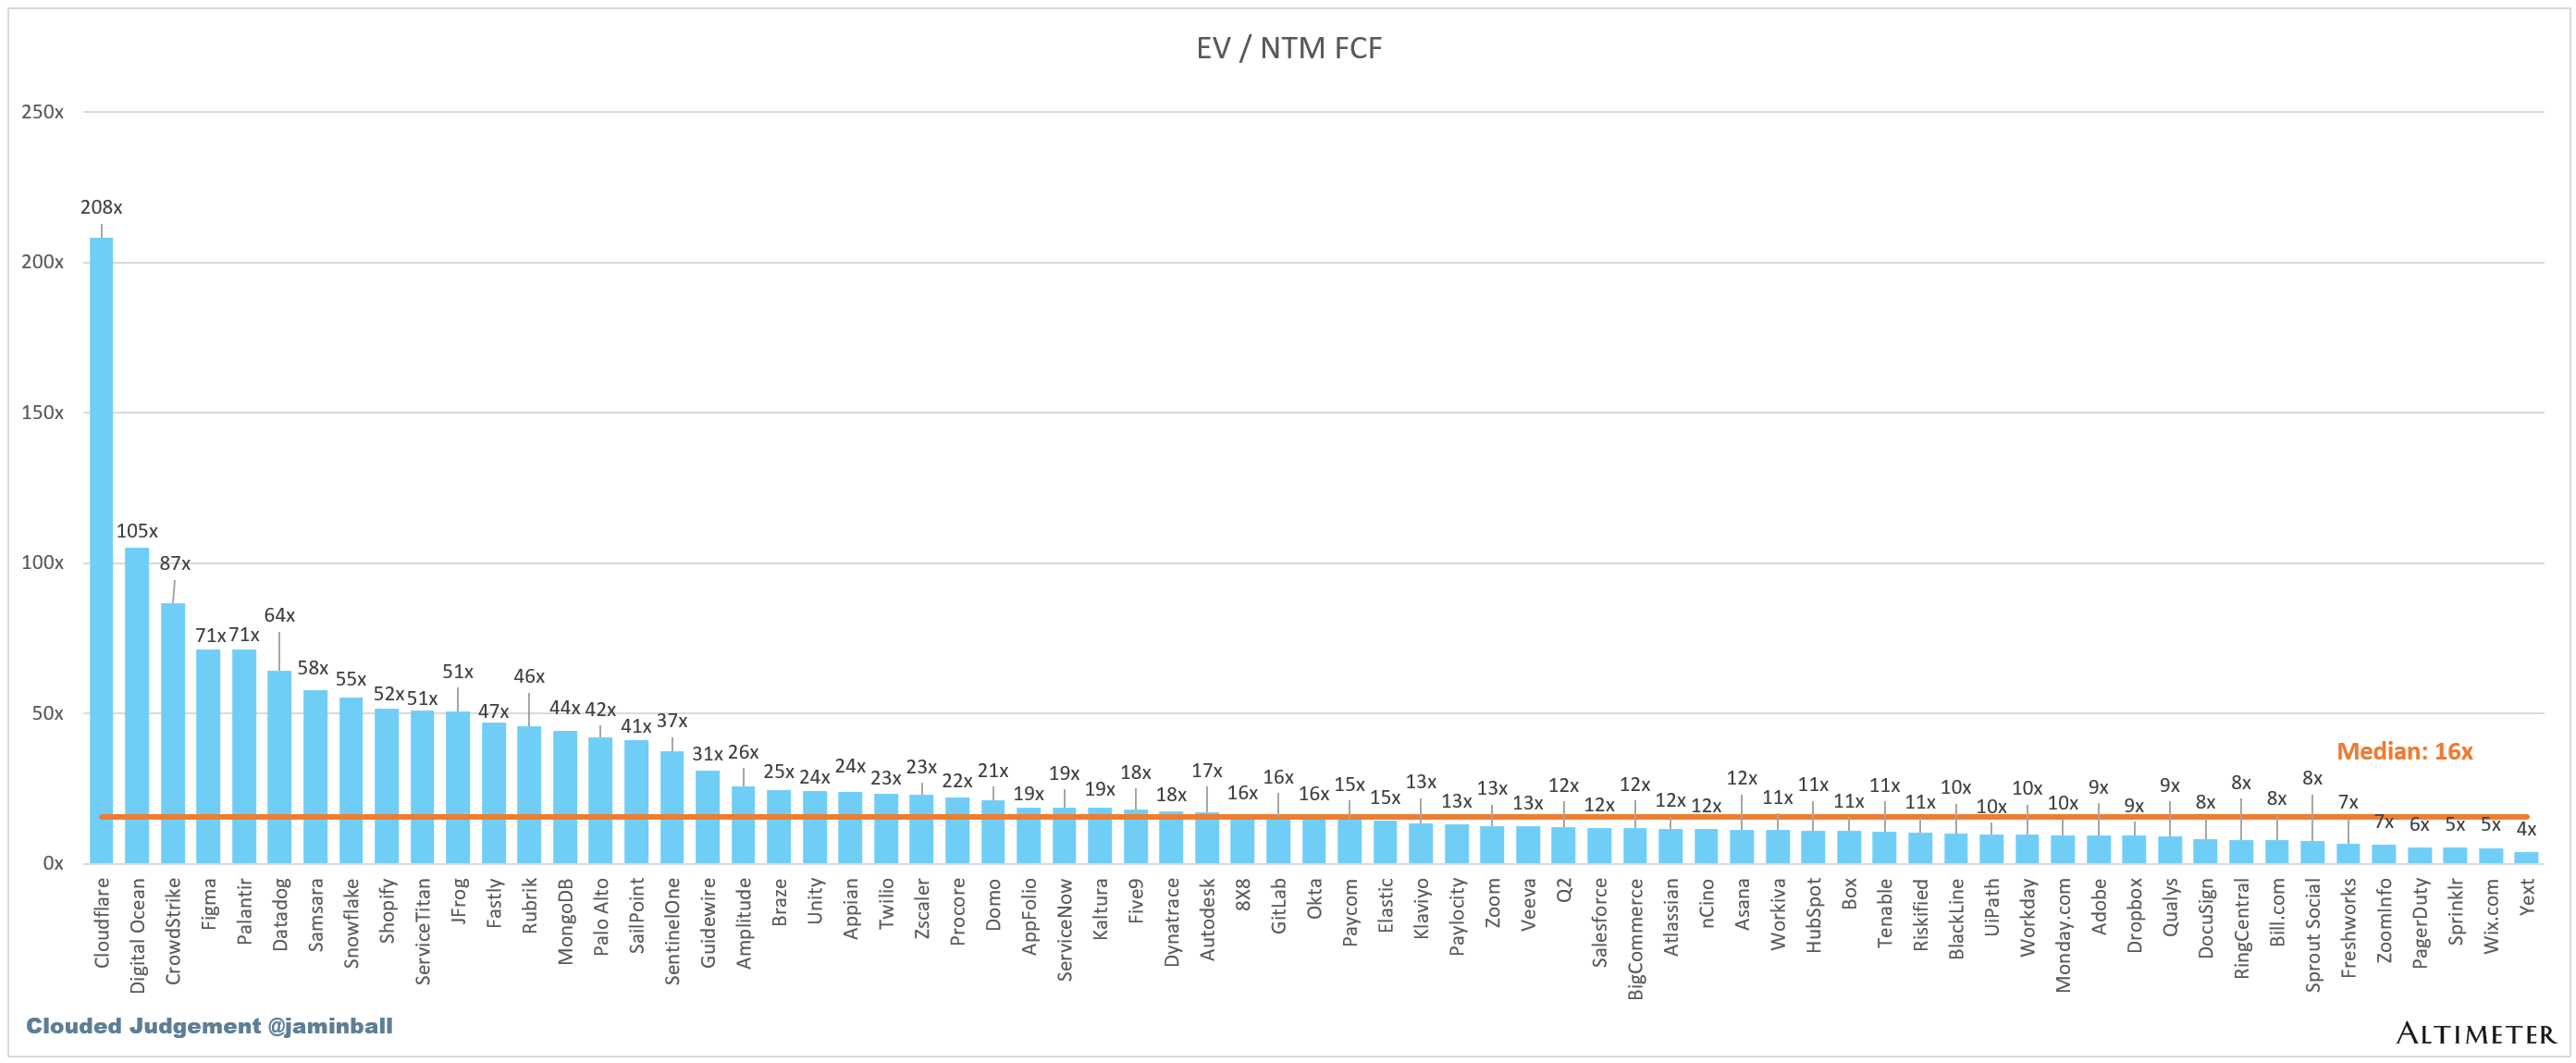
The line chart shows the median of all companies with a FCF multiple >0x and <100x. I created this subset to show companies where FCF is a relevant valuation metric.
Companies with negative NTM FCF are not listed on the chart
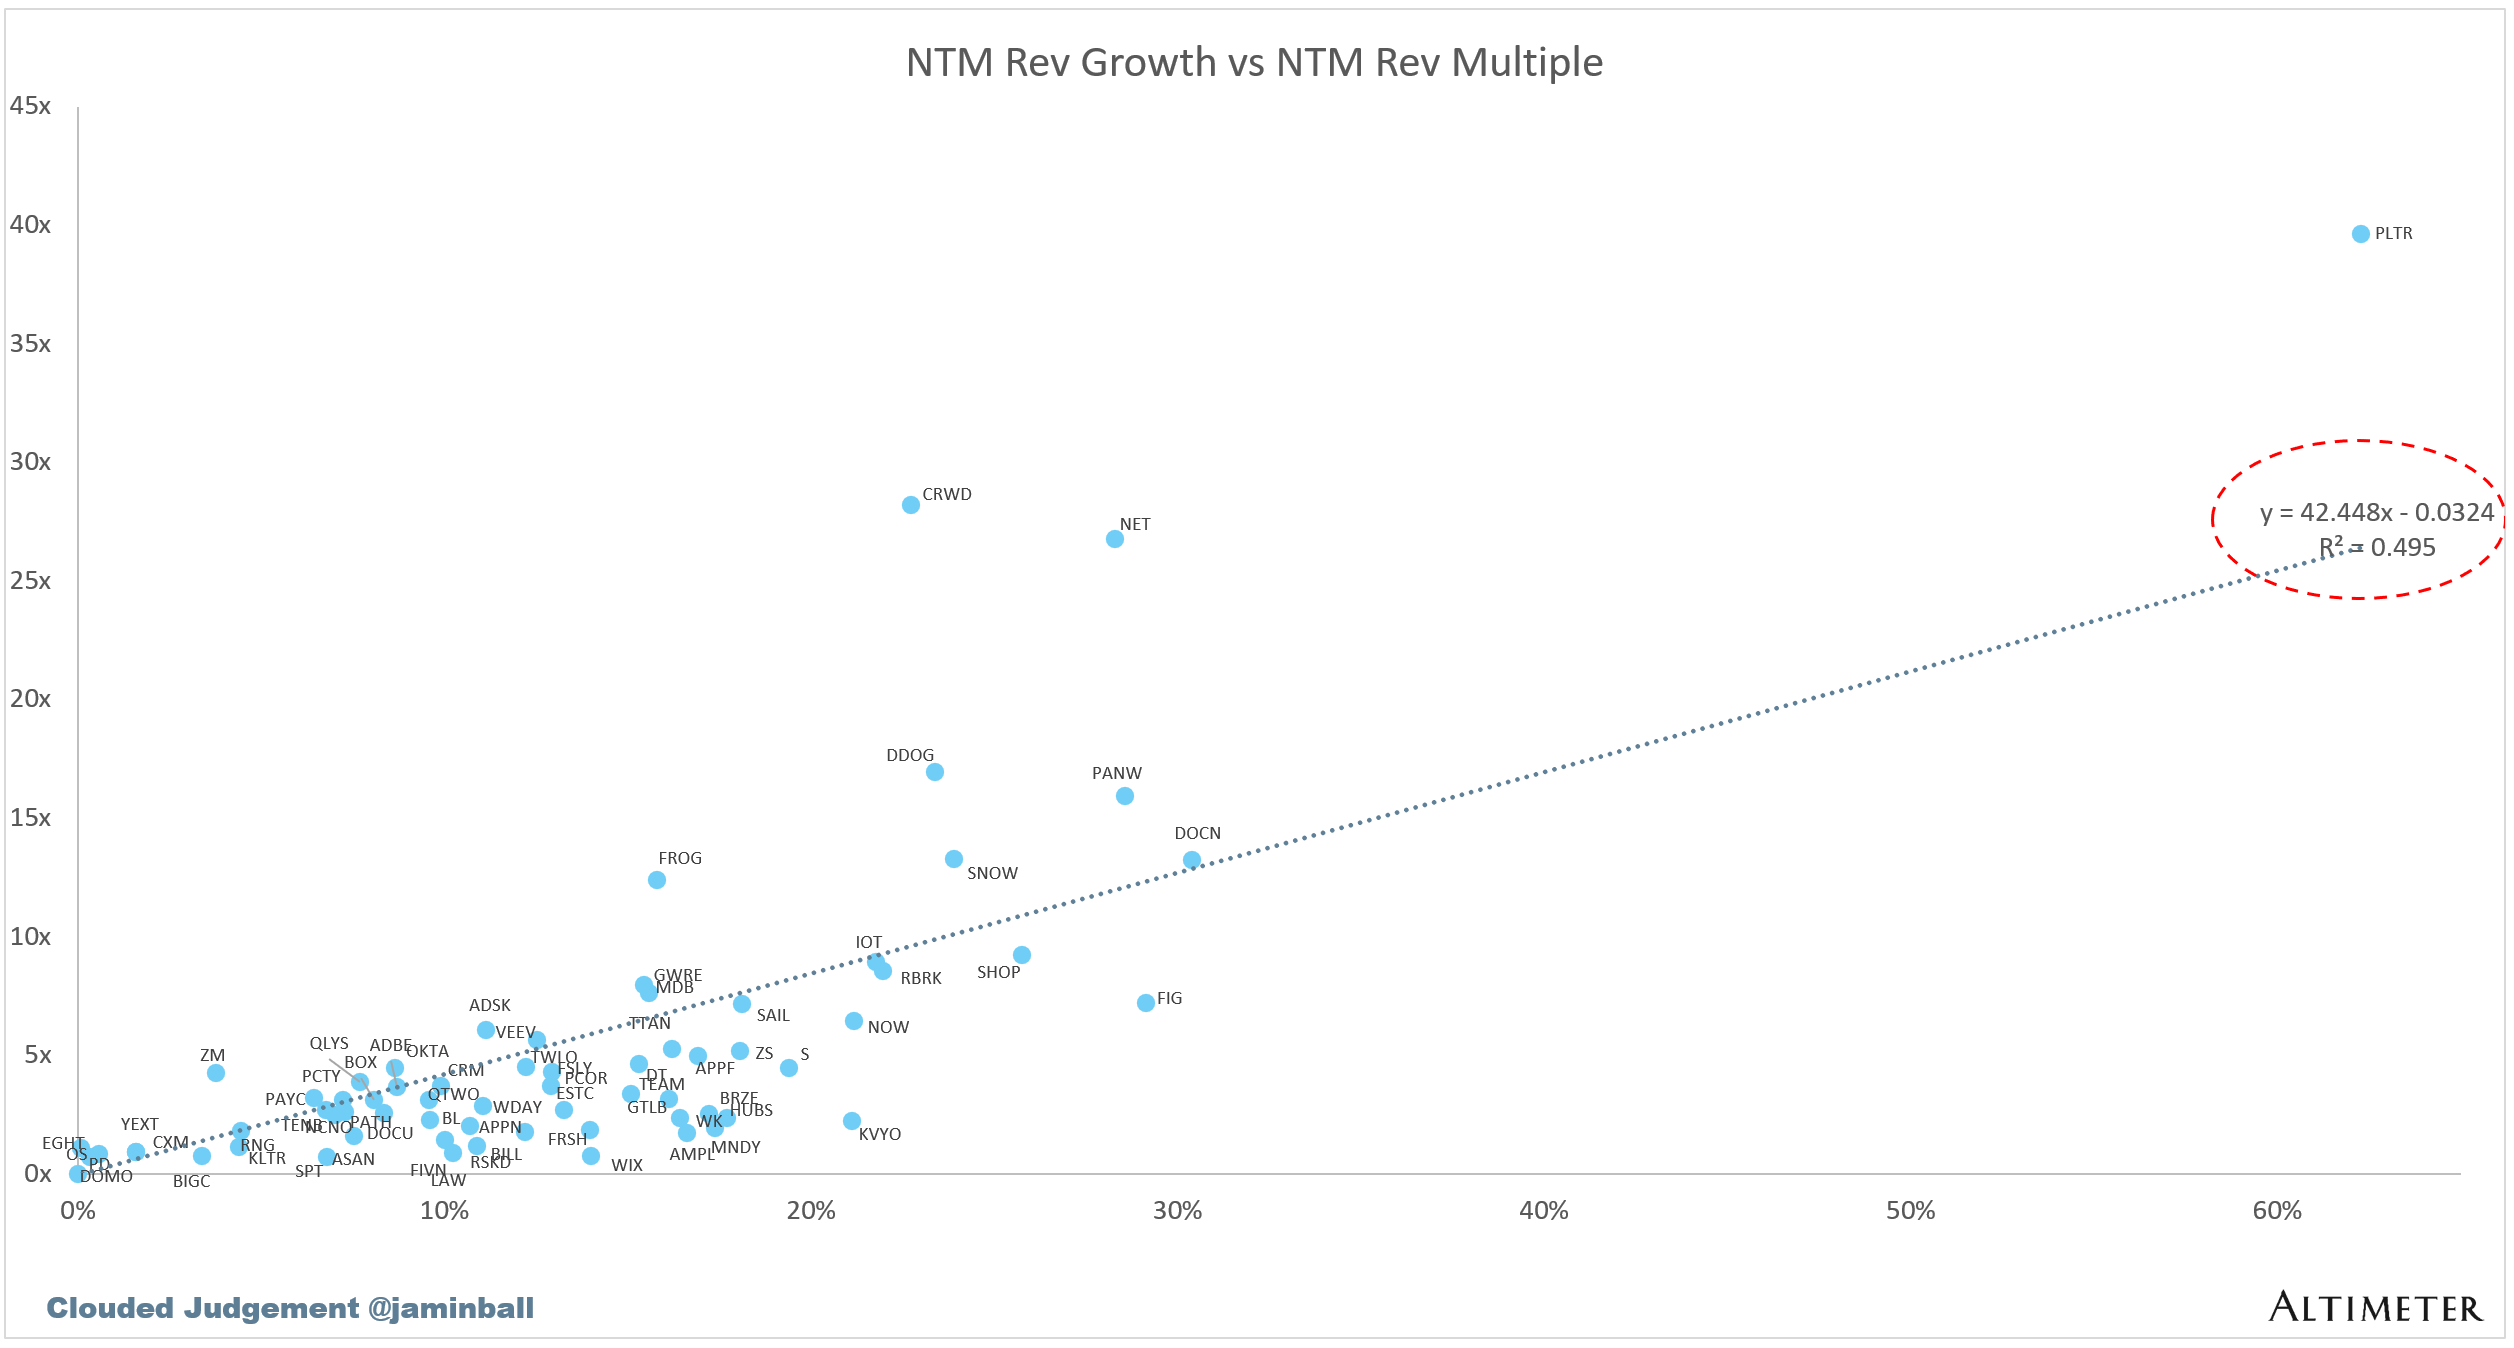
Scatter Plot of EV / NTM Rev Multiple vs NTM Rev Growth
How correlated is growth to valuation multiple?
Operating Metrics
Median NTM growth rate: 13%
Median LTM growth rate: 15%
Median Gross Margin: 76%
Median Operating Margin 0%
Median FCF Margin: 21%
Median Net Retention: 109%
Median CAC Payback: 33 months
Median S&M % Revenue: 35%
Median R&D % Revenue: 23%
Median G&A % Revenue: 15%
Comps Output
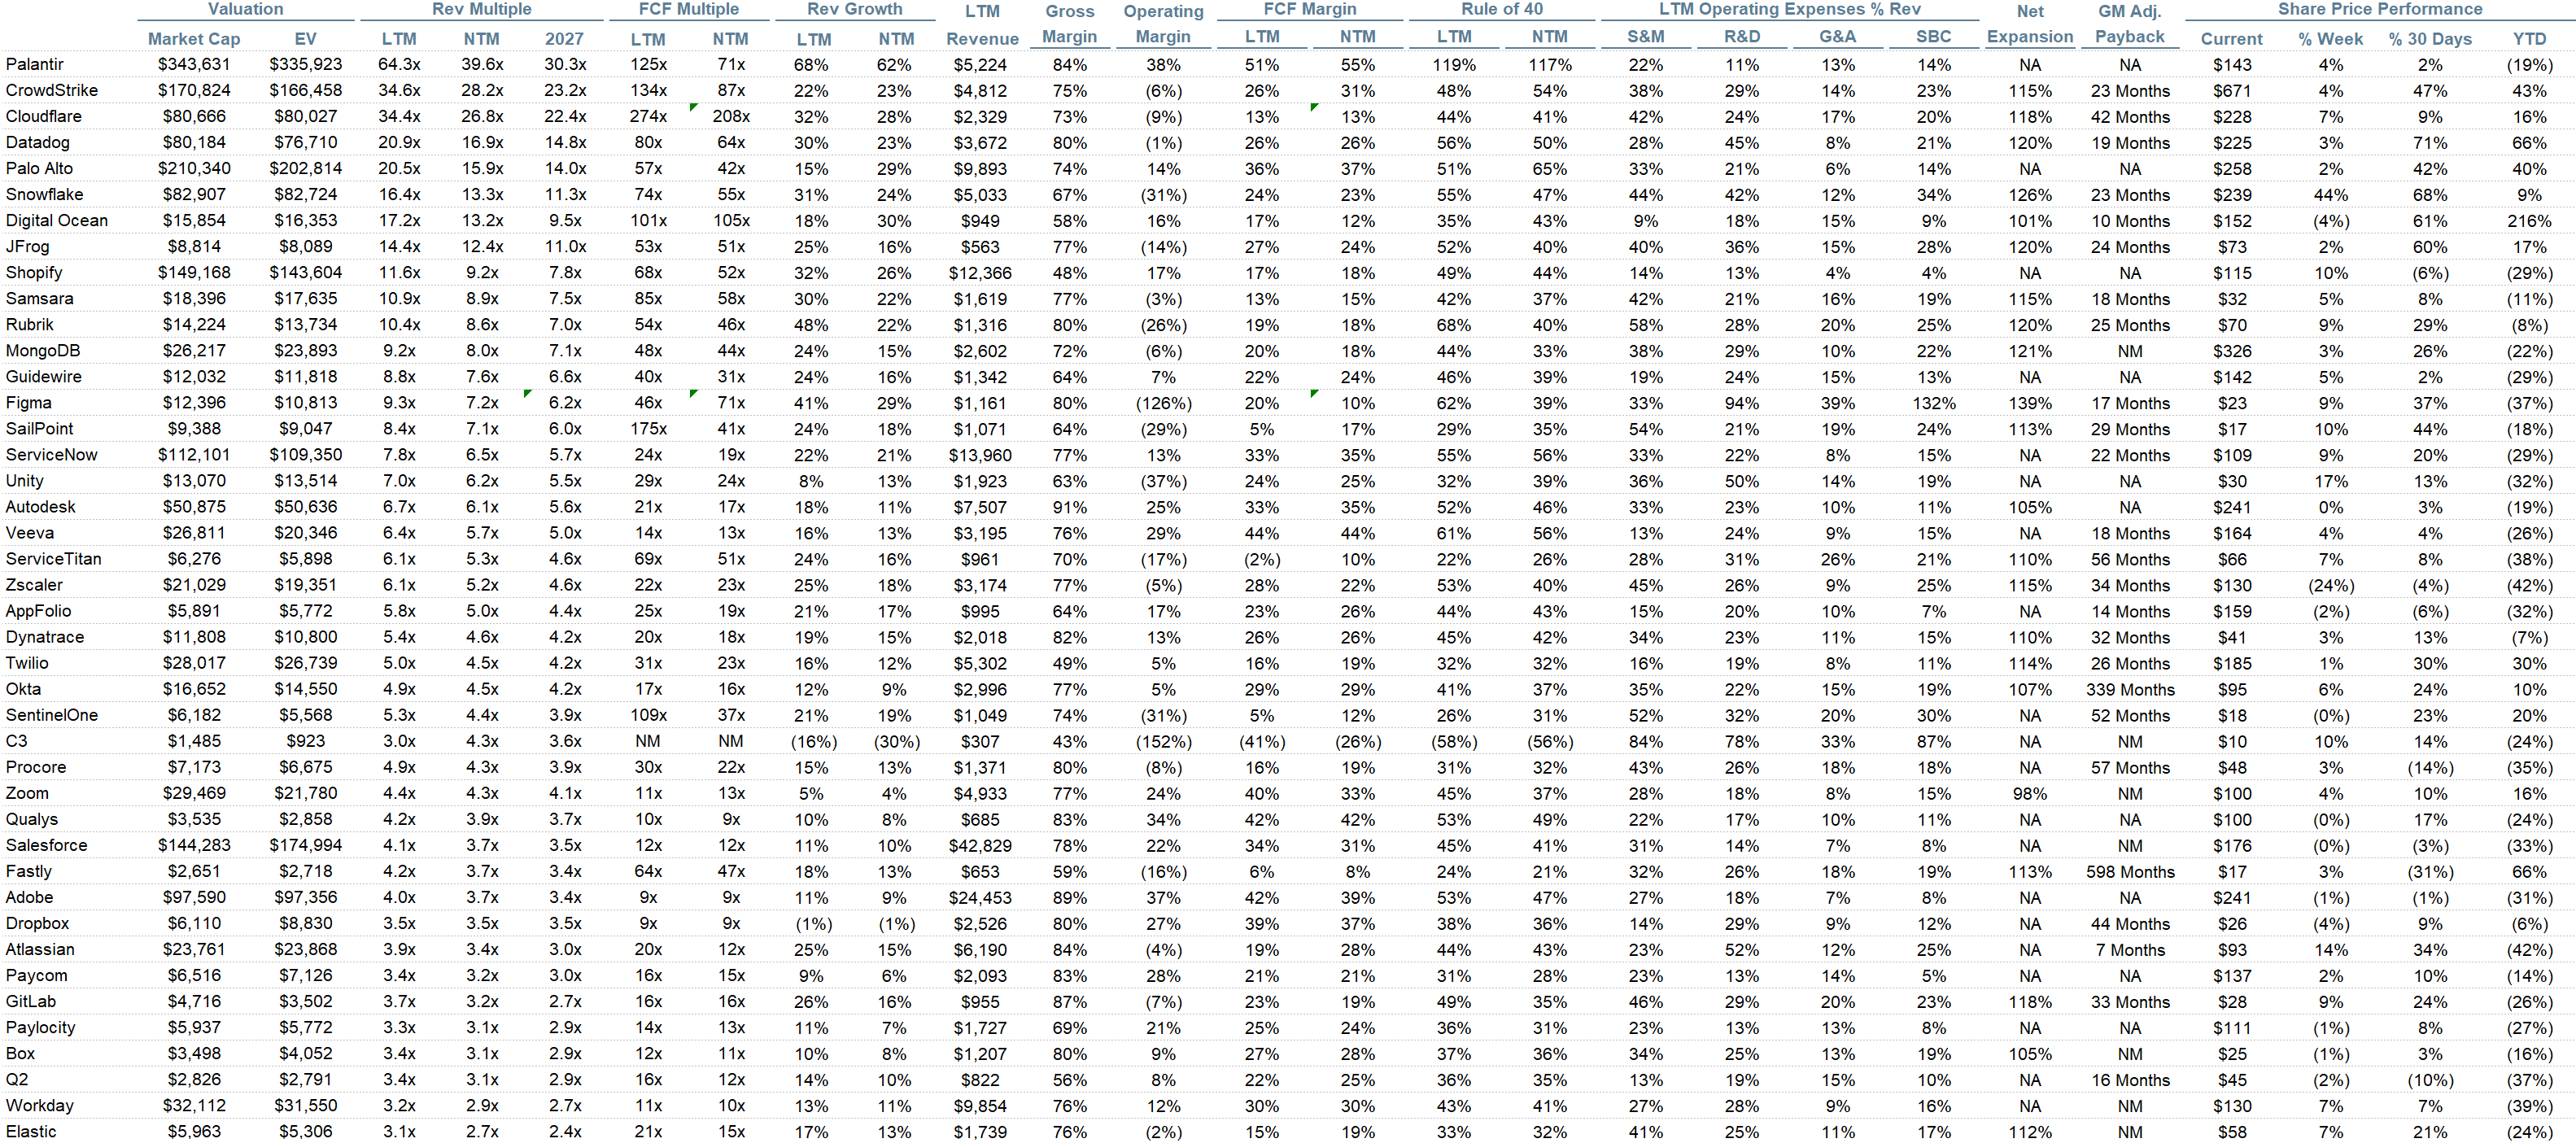
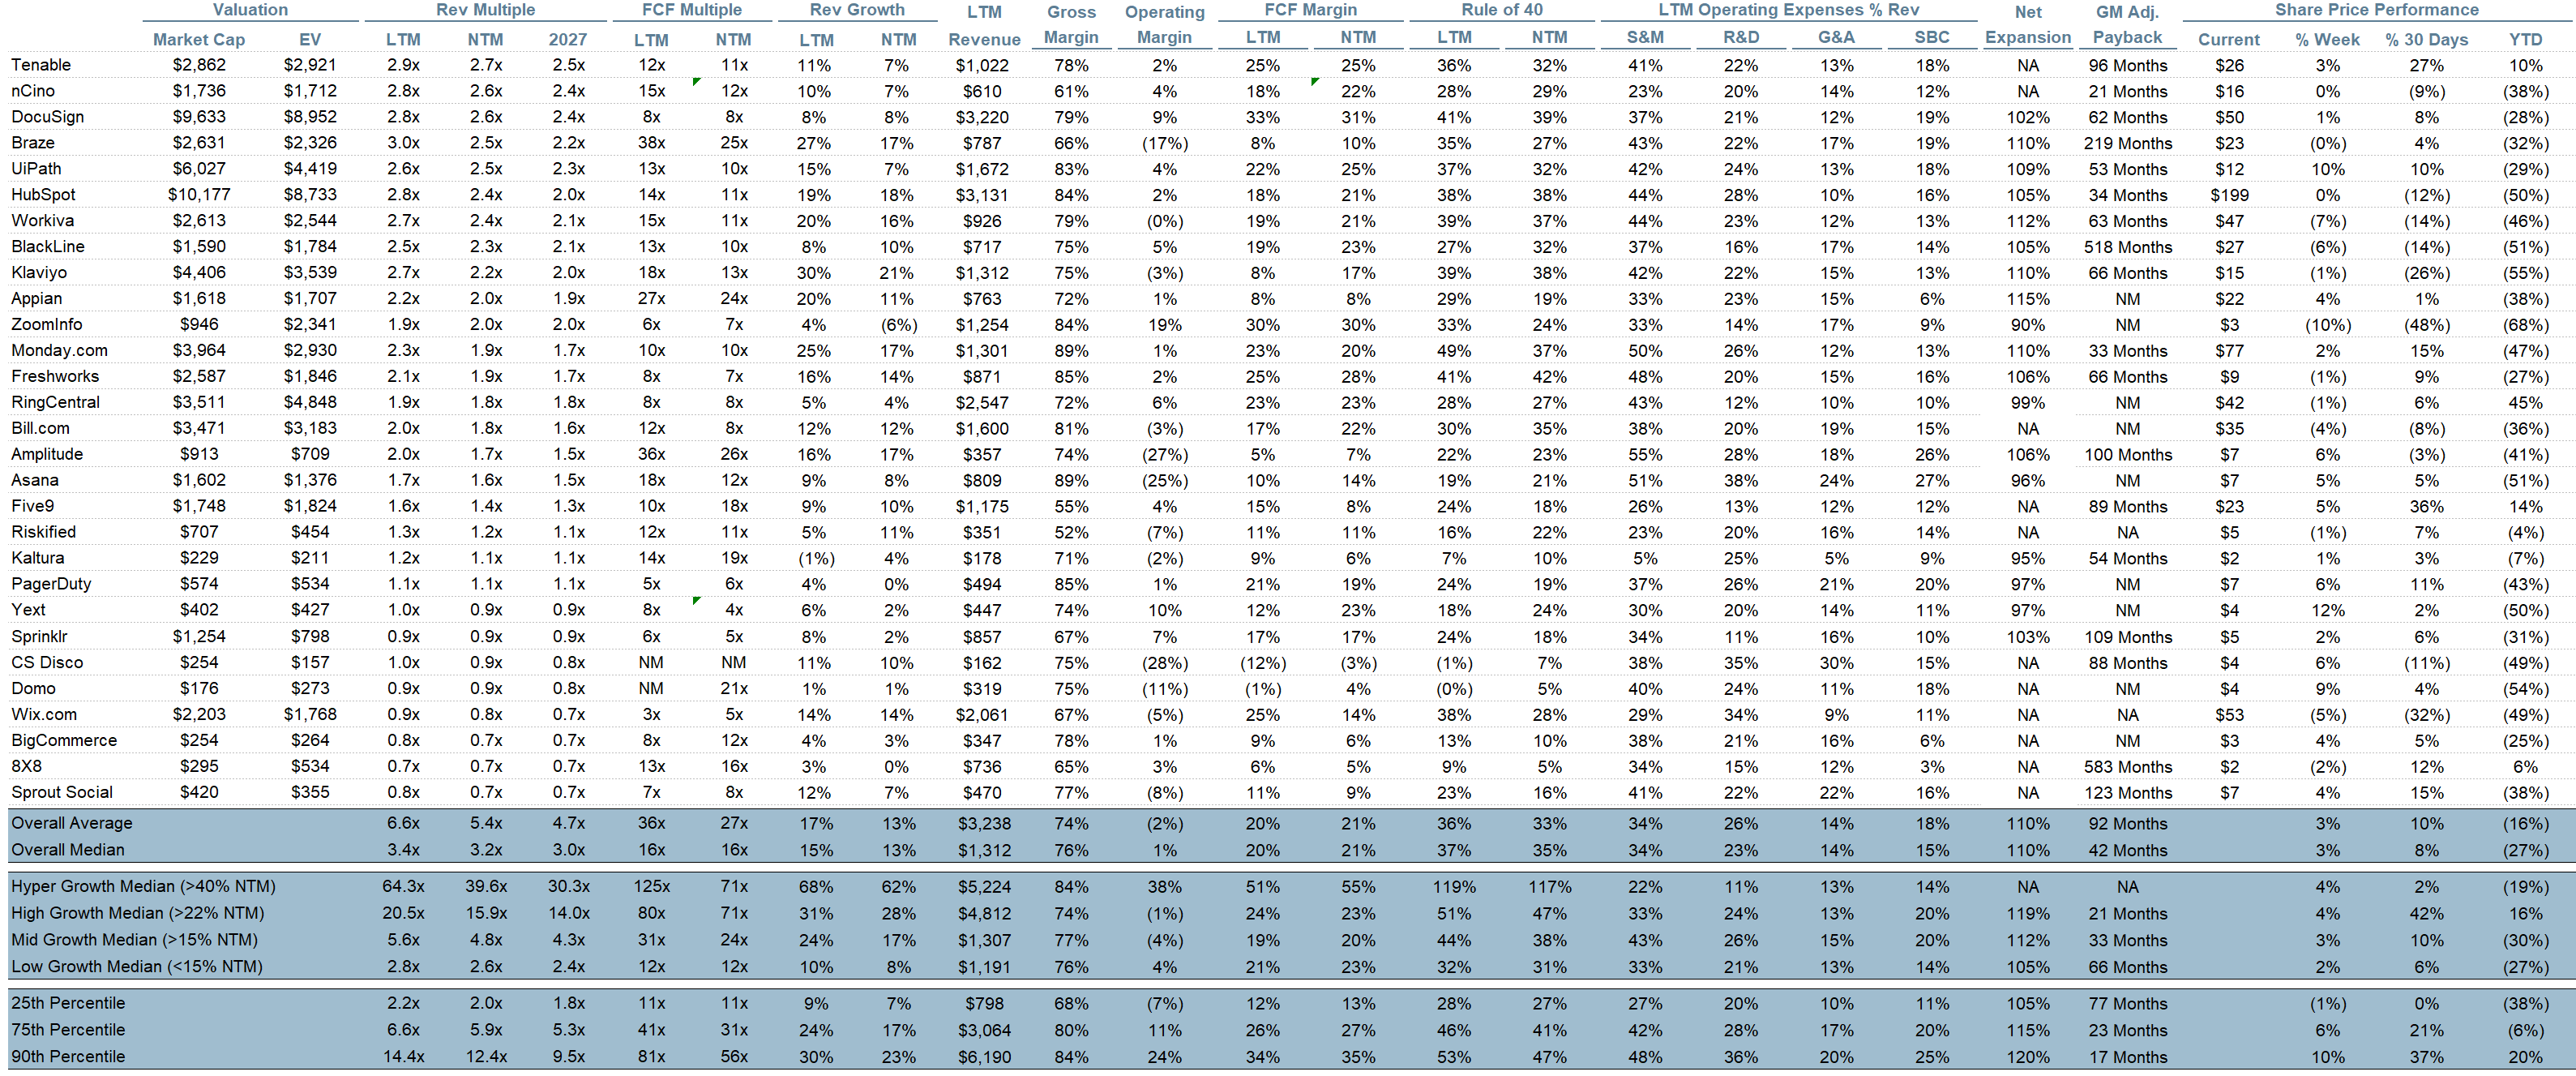
Rule of 40 shows rev growth + FCF margin (both LTM and NTM for growth + margins). FCF calculated as Cash Flow from Operations - Capital Expenditures
GM Adjusted Payback is calculated as: (Previous Q S&M) / (Net New ARR in Q x Gross Margin) x 12. It shows the number of months it takes for a SaaS business to pay back its fully burdened CAC on a gross profit basis. Most public companies don’t report net new ARR, so I’m taking an implied ARR metric (quarterly subscription revenue x 4). Net new ARR is simply the ARR of the current quarter, minus the ARR of the previous quarter. Companies that do not disclose subscription rev have been left out of the analysis and are listed as NA.
Sources used in this post include Bloomberg, Pitchbook and company filings
The information presented in this newsletter is the opinion of the author and does not necessarily reflect the view of any other person or entity, including Altimeter Capital Management, LP (”Altimeter”). The information provided is believed to be from reliable sources but no liability is accepted for any inaccuracies. This is for information purposes and should not be construed as an investment recommendation. Past performance is no guarantee of future performance. Altimeter is an investment adviser registered with the U.S. Securities and Exchange Commission. Registration does not imply a certain level of skill or training. Altimeter and its clients trade in public securities and have made and/or may make investments in or investment decisions relating to the companies referenced herein. The views expressed herein are those of the author and not of Altimeter or its clients, which reserve the right to make investment decisions or engage in trading activity that would be (or could be construed as) consistent and/or inconsistent with the views expressed herein.
This post and the information presented are intended for informational purposes only. The views expressed herein are the author’s alone and do not constitute an offer to sell, or a recommendation to purchase, or a solicitation of an offer to buy, any security, nor a recommendation for any investment product or service. While certain information contained herein has been obtained from sources believed to be reliable, neither the author nor any of his employers or their affiliates have independently verified this information, and its accuracy and completeness cannot be guaranteed. Accordingly, no representation or warranty, express or implied, is made as to, and no reliance should be placed on, the fairness, accuracy, timeliness or completeness of this information. The author and all employers and their affiliated persons assume no liability for this information and no obligation to update the information or analysis contained herein in the future.