


Clouded Judgement 5.30.25 - Moats in the Age of AI

Every week I’ll provide updates on the latest trends in cloud software companies. Follow along to stay up to date!
Moats in the Age of AI
A lot has been written about moats in software. Network effects. Switching costs. Proprietary data. Everyone wants to believe they’re building one. But I’ve come to believe the idea of a “long term moat” is mostly a myth, especially in this market. Moats aren’t permanent. They’re time-bound. At best, they function as a bridge. And companies either use that bridge to reach the next defensible position, or watch their moat get breached.
The real “long-term moat” is just a sequence of smaller moats stacked together. Each one buys time. And what you do with that time, how fast you execute, how quickly you evolve, determines whether you stay ahead. In the Age of AI, this is more true than ever. If the moat time window used to be 6–12 months, today it’s 2–3 weeks. Models change. Infrastructure shifts. Customer needs rewrite themselves in real time. What was a 12-month product head start in 2022 is now 3 prompts and a wrapper in 2024. It’s easier than ever to both build and distribute software.
And it’s happening all around us! The first LLM-based CRMs? Swarmed. The first AI note-taking tools? Cloned endlessly. Even infra plays like vector DBs or agent frameworks are seeing differentiation collapse overnight.
Speed isn’t just important, it is the moat. The ability to build, ship, learn, and adapt faster than everyone else is the only sustainable edge right now. In a world where everything is open source, everything is demo-able, and everything is one blog post away from being copied, speed is the only thing that compounds.
Execution speed. Hiring speed. Firing speed. Distribution speed. Even decision-making speed. You don’t win because you’re defensible, you win because you’re faster. Killing bad ideas is just as important as the speed of executing against good ones. The opportunity cost of time has never been greater. So if you’re trying to build a moat today, maybe don’t think of it as a castle wall. Think of it as a race. Whoever stacks the most advantages the fastest: products, distribution, talent, infra, wins.
Quarterly Reports Summary

Top 10 EV / NTM Revenue Multiples

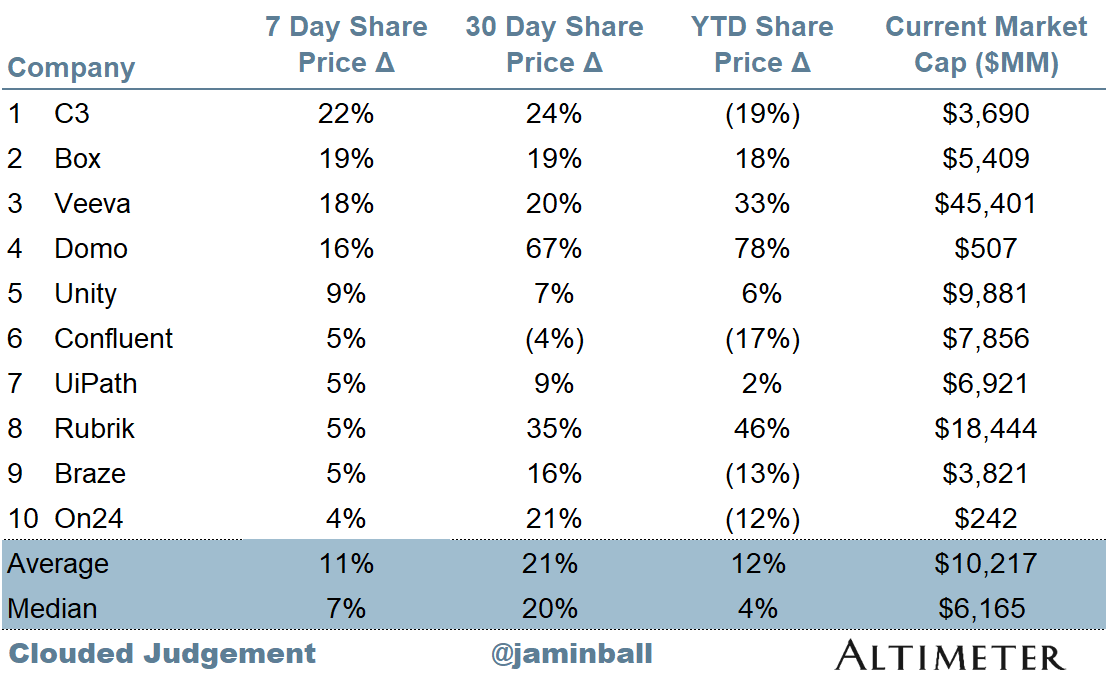
Top 10 Weekly Share Price Movement
Update on Multiples
SaaS businesses are generally valued on a multiple of their revenue - in most cases the projected revenue for the next 12 months. Revenue multiples are a shorthand valuation framework. Given most software companies are not profitable, or not generating meaningful FCF, it’s the only metric to compare the entire industry against. Even a DCF is riddled with long term assumptions. The promise of SaaS is that growth in the early years leads to profits in the mature years. Multiples shown below are calculated by taking the Enterprise Value (market cap + debt - cash) / NTM revenue.
Overall Stats:
Overall Median: 5.6x
Top 5 Median: 23.2x
10Y: 4.4%


Bucketed by Growth. In the buckets below I consider high growth >25% projected NTM growth, mid growth 15%-25% and low growth <15%
High Growth Median: 20.6x
Mid Growth Median: 9.2x
Low Growth Median: 4.1x


EV / NTM Rev / NTM Growth
The below chart shows the EV / NTM revenue multiple divided by NTM consensus growth expectations. So a company trading at 20x NTM revenue that is projected to grow 100% would be trading at 0.2x. The goal of this graph is to show how relatively cheap / expensive each stock is relative to their growth expectations


EV / NTM FCF
The line chart shows the median of all companies with a FCF multiple >0x and <100x. I created this subset to show companies where FCF is a relevant valuation metric.

Companies with negative NTM FCF are not listed on the chart

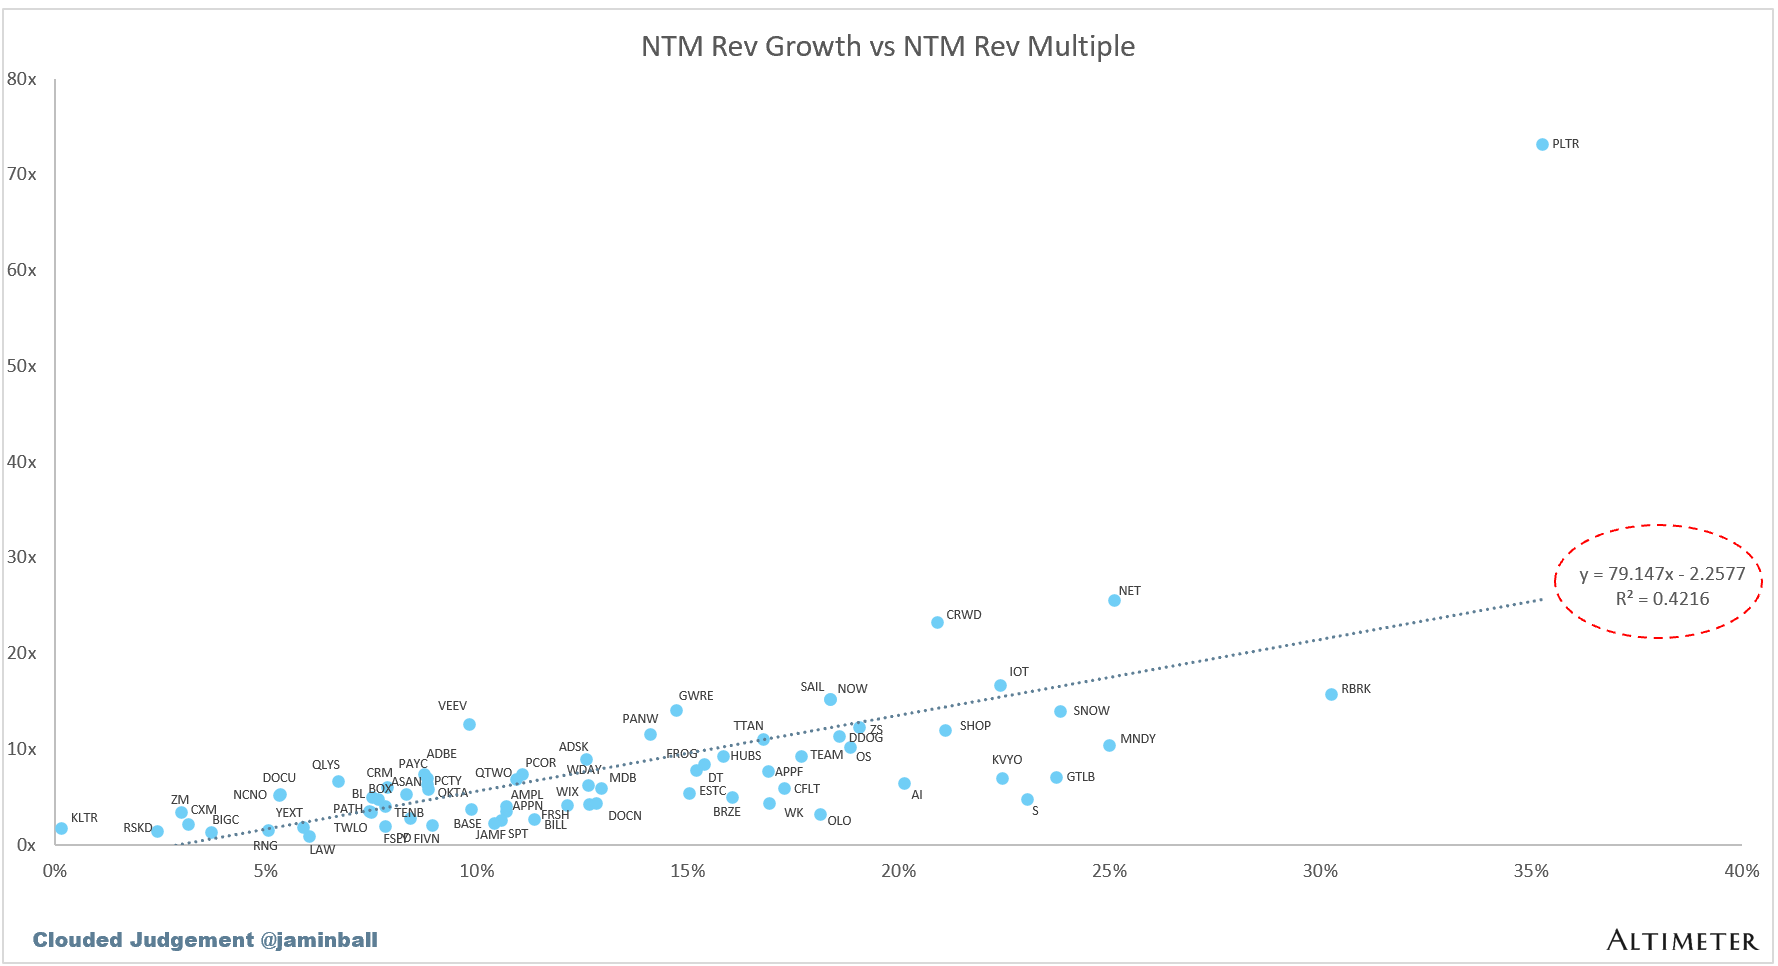
Scatter Plot of EV / NTM Rev Multiple vs NTM Rev Growth
How correlated is growth to valuation multiple?
Operating Metrics
Median NTM growth rate: 11%
Median LTM growth rate: 14%
Median Gross Margin: 76%
Median Operating Margin (4%)
Median FCF Margin: 18%
Median Net Retention: 108%
Median CAC Payback: 45 months
Median S&M % Revenue: 38%
Median R&D % Revenue: 24%
Median G&A % Revenue: 16%
Comps Output
Rule of 40 shows rev growth + FCF margin (both LTM and NTM for growth + margins). FCF calculated as Cash Flow from Operations - Capital Expenditures
GM Adjusted Payback is calculated as: (Previous Q S&M) / (Net New ARR in Q x Gross Margin) x 12 . It shows the number of months it takes for a SaaS business to payback their fully burdened CAC on a gross profit basis. Most public companies don’t report net new ARR, so I’m taking an implied ARR metric (quarterly subscription revenue x 4). Net new ARR is simply the ARR of the current quarter, minus the ARR of the previous quarter. Companies that do not disclose subscription rev have been left out of the analysis and are listed as NA.


Sources used in this post include Bloomberg, Pitchbook and company filings
The information presented in this newsletter is the opinion of the author and does not necessarily reflect the view of any other person or entity, including Altimeter Capital Management, LP ("Altimeter"). The information provided is believed to be from reliable sources but no liability is accepted for any inaccuracies. This is for information purposes and should not be construed as an investment recommendation. Past performance is no guarantee of future performance. Altimeter is an investment adviser registered with the U.S. Securities and Exchange Commission. Registration does not imply a certain level of skill or training. Altimeter and its clients trade in public securities and have made and/or may make investments in or investment decisions relating to the companies referenced herein. The views expressed herein are those of the author and not of Altimeter or its clients, which reserve the right to make investment decisions or engage in trading activity that would be (or could be construed as) consistent and/or inconsistent with the views expressed herein.
This post and the information presented are intended for informational purposes only. The views expressed herein are the author’s alone and do not constitute an offer to sell, or a recommendation to purchase, or a solicitation of an offer to buy, any security, nor a recommendation for any investment product or service. While certain information contained herein has been obtained from sources believed to be reliable, neither the author nor any of his employers or their affiliates have independently verified this information, and its accuracy and completeness cannot be guaranteed. Accordingly, no representation or warranty, express or implied, is made as to, and no reliance should be placed on, the fairness, accuracy, timeliness or completeness of this information. The author and all employers and their affiliated persons assume no liability for this information and no obligation to update the information or analysis contained herein in the future.
Why isn't workflow data that a whole bunch of SaaS companies are sitting on a moat? They can include Ai features that train on that data, and it's hard for a new AI first upstart to come and capture that opportunity because the client will first have to extract that data themselves...