

Every week I’ll provide updates on the latest trends in cloud software companies. Follow along to stay up to date!
Cost of Intelligence
It continues to shock me how quickly the cost of tokens (ie intelligence) has dropped. The chart below shows the evolution of the o-series of models (o1 and o3) pricing from the beginning of the year to today. As you can see, in just a few months the pricing has dropped 87%!

Of course, while these models are both full o-series models, they’re not exactly apples to apples to compare. o3 was built for inference cost reduction and speed. It might be cheaper, but that doesn’t mean it's objectively better or interchangeable with o1.
The implications of this kind of pricing change (and I don’t think the price cuts will stop here…) are significant. It’s becoming more clear the marginal cost of creation is going to zero. And this is profound!
There’s currently a lot of jawboning on what will happen to jobs in the age of AI. There are many CEOs, some of very large public companies, who have commented on what AI means for their headcount plans. The pessimistic view is that the job displacement from AI will be massive, leading to a contracting economy. The optimistic view is that creative destruction will destroy some jobs, but create orders of magnitude more leading to a massively expanding economy. At the end of the day, it’s easy to see the jobs that will be displaced, but hard to imagine the jobs that will be created.
I find myself very squarely in the latter camp (but I’m a very strong optimist generally!). Personally, I think it’s impossible to bet against the resilience of humanity :) We’ll find a way, and the progress will be exceptional. No one today is bemoaning the drop in number of blacksmith jobs.
Now, the challenge with comparing the “creative destruction” from the AI shift to say, the Industrial Revolution, is that this shift will happen much faster. In the industrial revolution (or other large technological or industry shifts), the people who’s jobs were being displaced had time to “re-skill.” There wasn’t as much of a jarring shift. It happened more gradually (relatively). With AI, the change will happen much faster (I think). This will present more challenges.
BUT - one of the reasons I’m most optimistic (and quite certain) that the AI shift will lead to a massive net new creation of jobs (not destruction) is the chart I posted above. The cost of creation is going to near zero. The amount of opportunities that will create is massive. So much so it’s hard to even imagine it.
So at the end of the day, I’m not entirely sure what new jobs will be created, but I’m confident that the cost of intelligence going to near zero will be a big driver of economic growth and jobs.
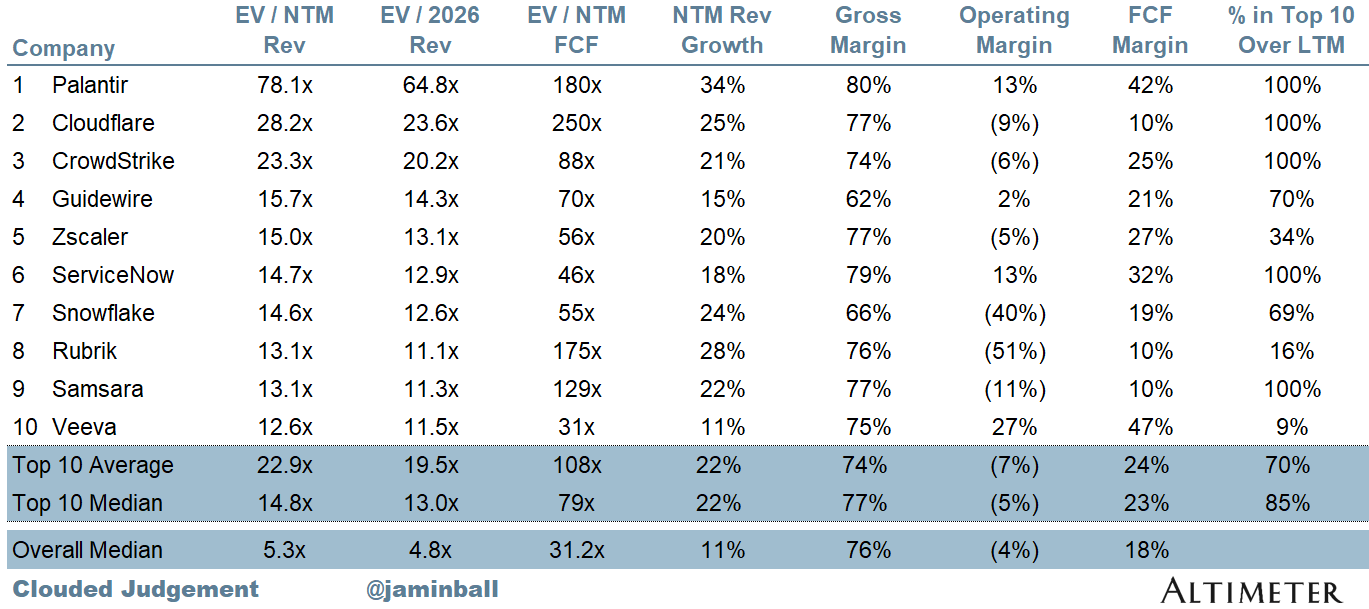
Top 10 EV / NTM Revenue Multiples
Top 10 Weekly Share Price Movement

Update on Multiples
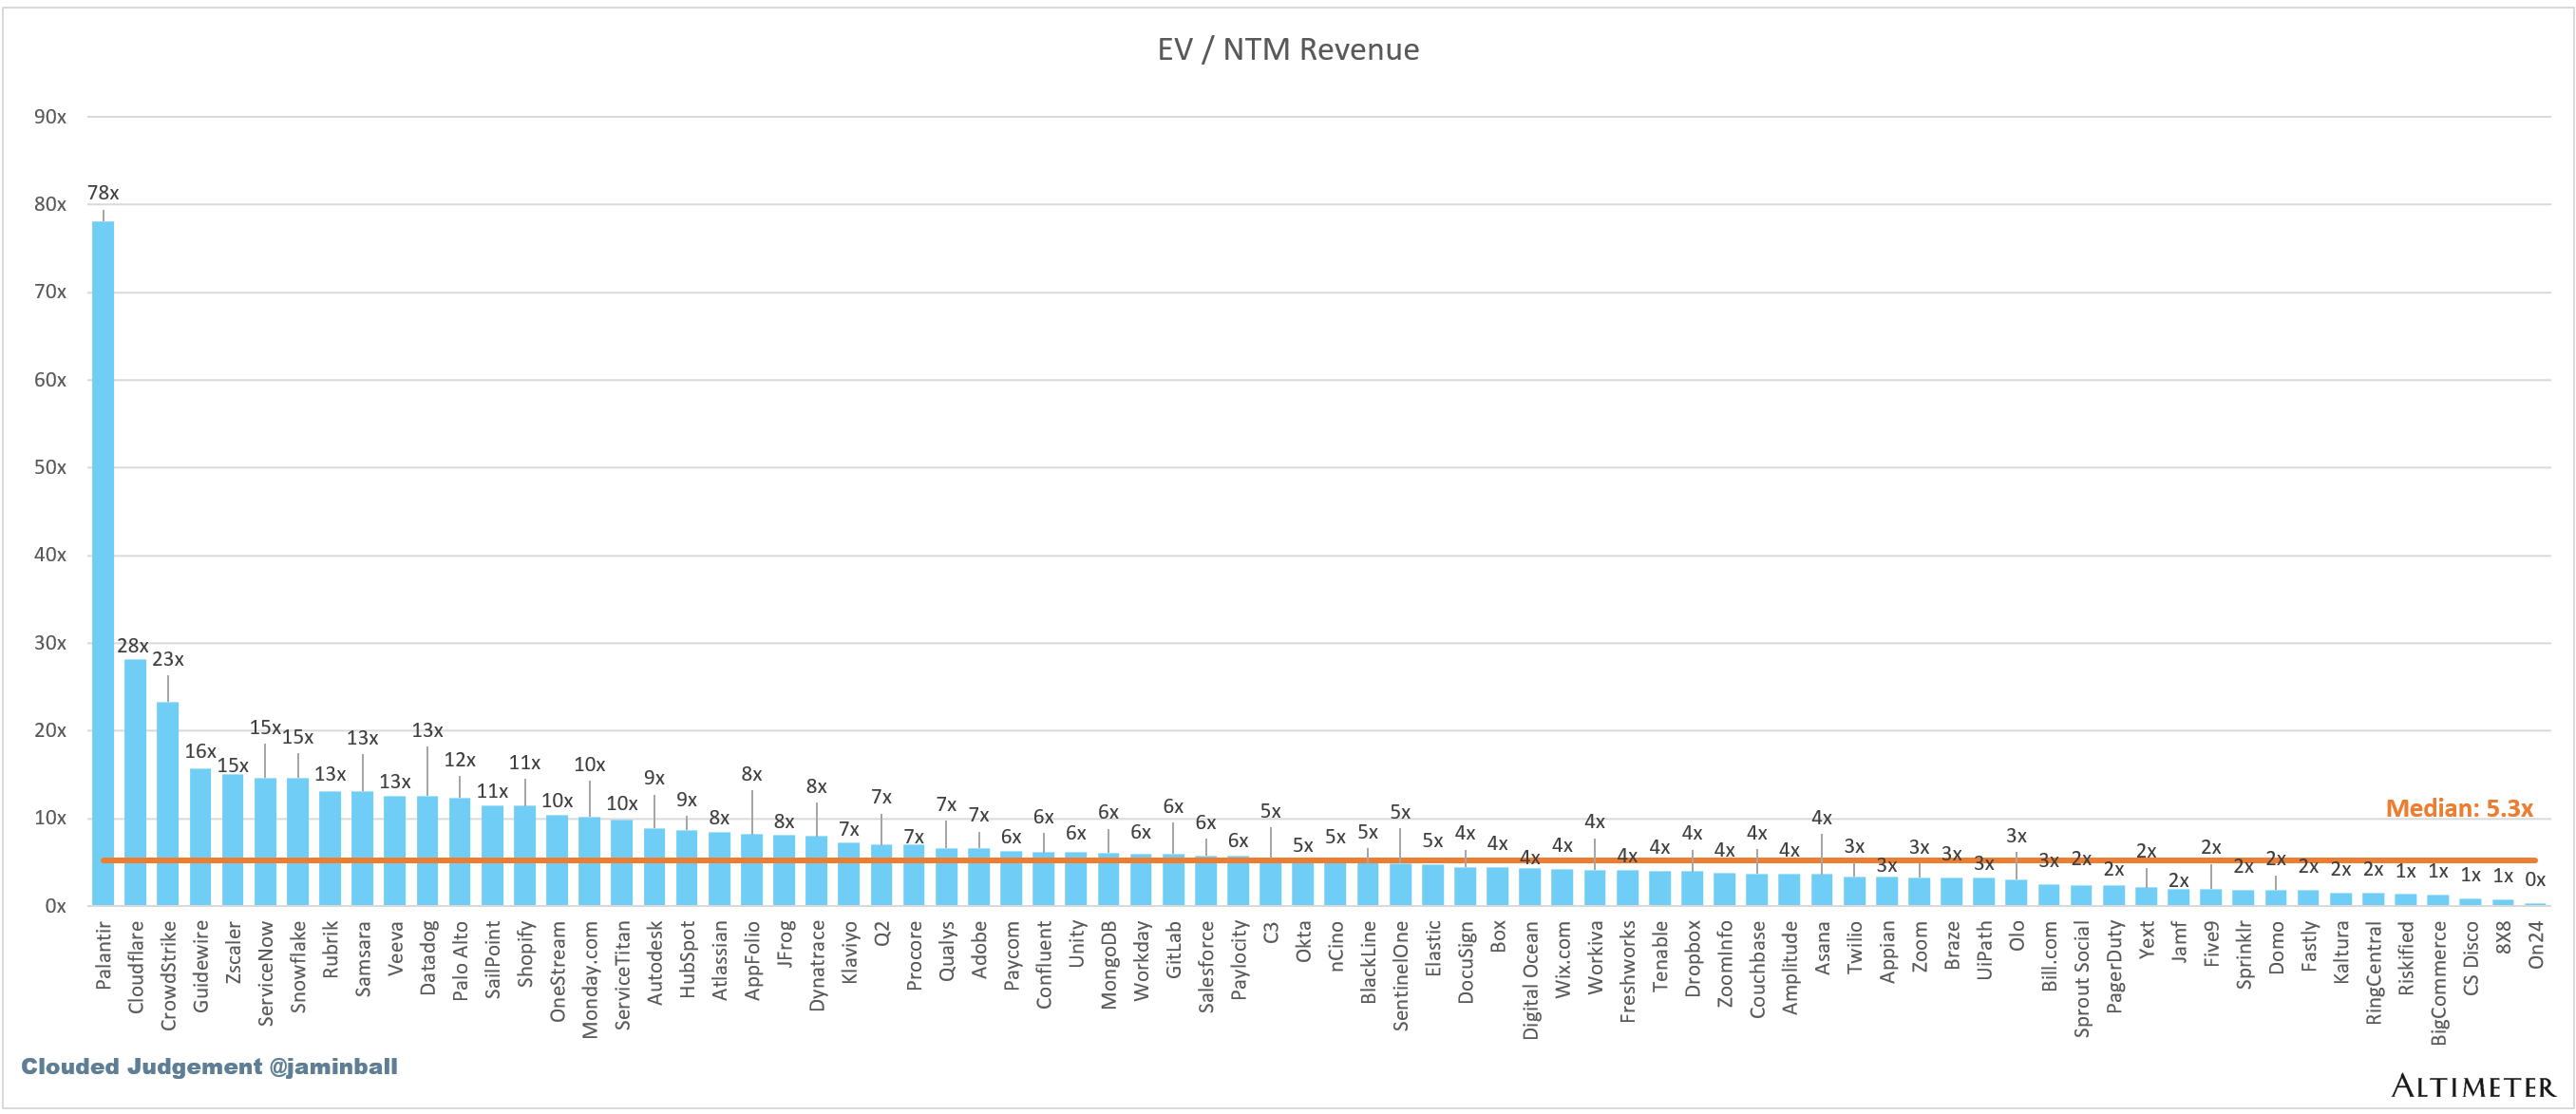
SaaS businesses are generally valued on a multiple of their revenue - in most cases the projected revenue for the next 12 months. Revenue multiples are a shorthand valuation framework. Given most software companies are not profitable, or not generating meaningful FCF, it’s the only metric to compare the entire industry against. Even a DCF is riddled with long term assumptions. The promise of SaaS is that growth in the early years leads to profits in the mature years. Multiples shown below are calculated by taking the Enterprise Value (market cap + debt - cash) / NTM revenue.
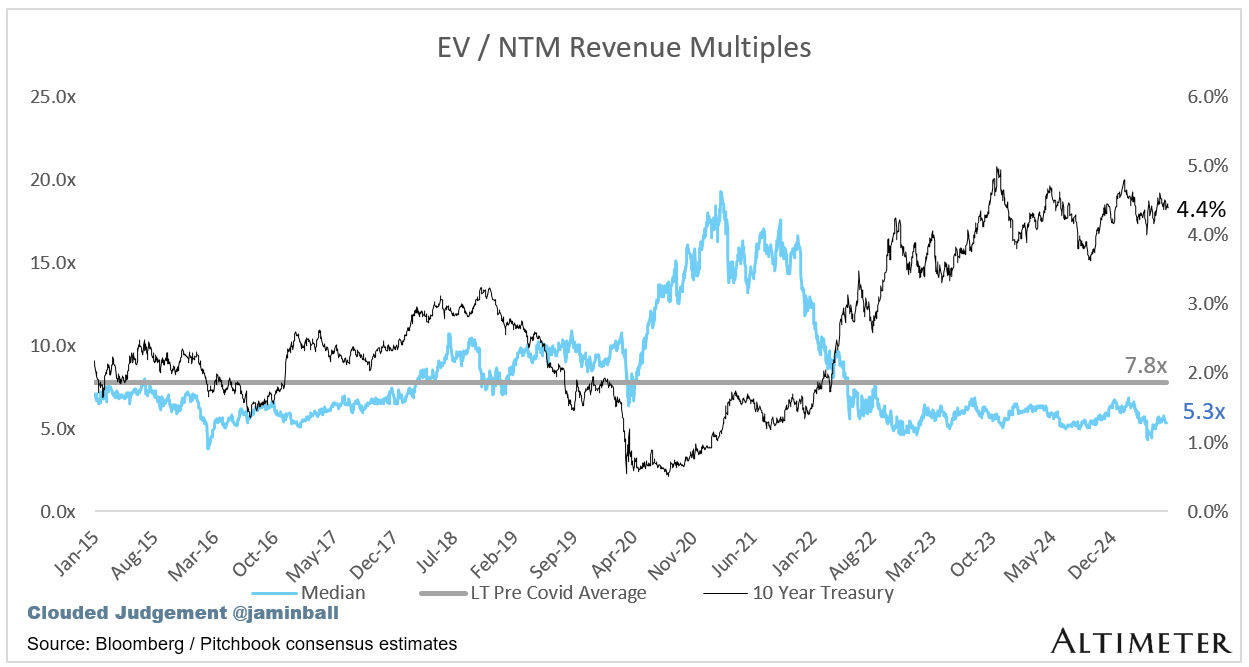
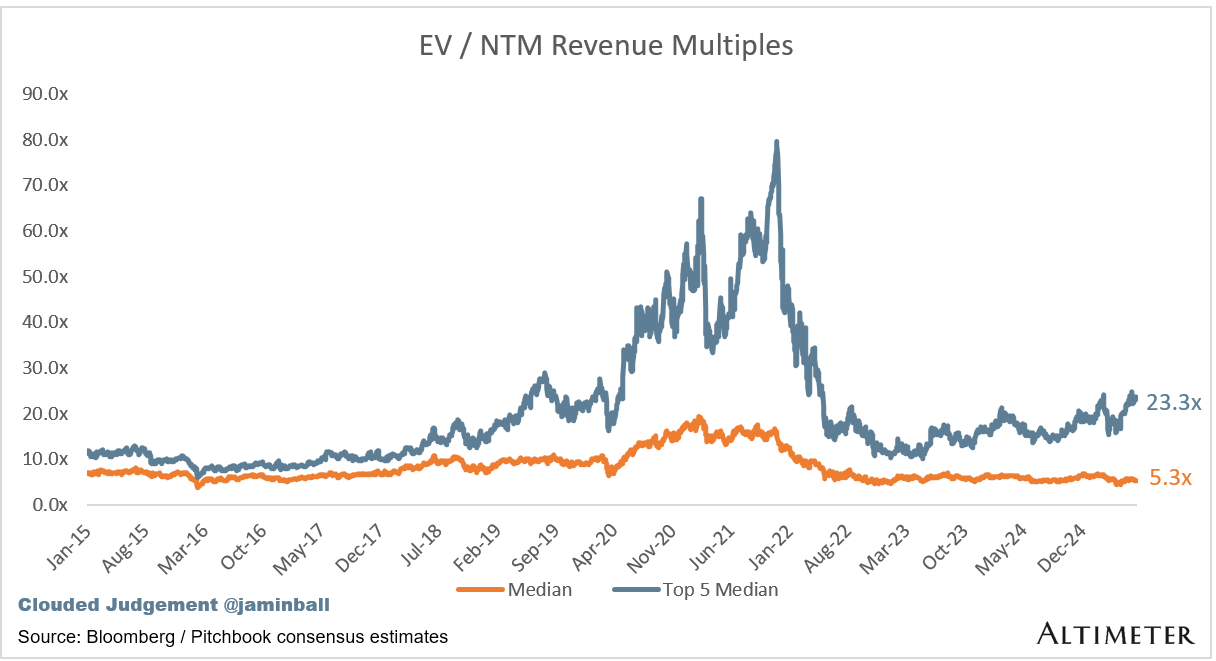
Overall Stats:
Overall Median: 5.3x
Top 5 Median: 23.3x
10Y: 4.4%
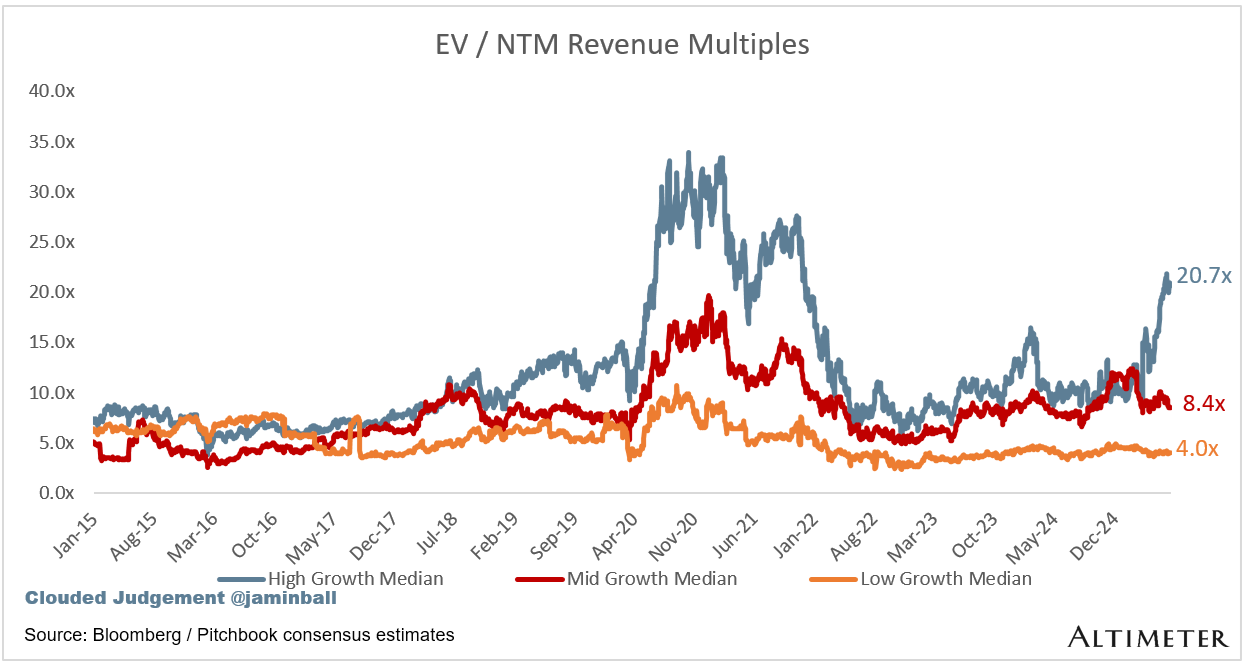
Bucketed by Growth. In the buckets below I consider high growth >25% projected NTM growth, mid growth 15%-25% and low growth <15%
High Growth Median: 20.7x
Mid Growth Median: 8.4x
Low Growth Median: 4.0x
EV / NTM Rev / NTM Growth
The below chart shows the EV / NTM revenue multiple divided by NTM consensus growth expectations. So a company trading at 20x NTM revenue that is projected to grow 100% would be trading at 0.2x. The goal of this graph is to show how relatively cheap / expensive each stock is relative to their growth expectations


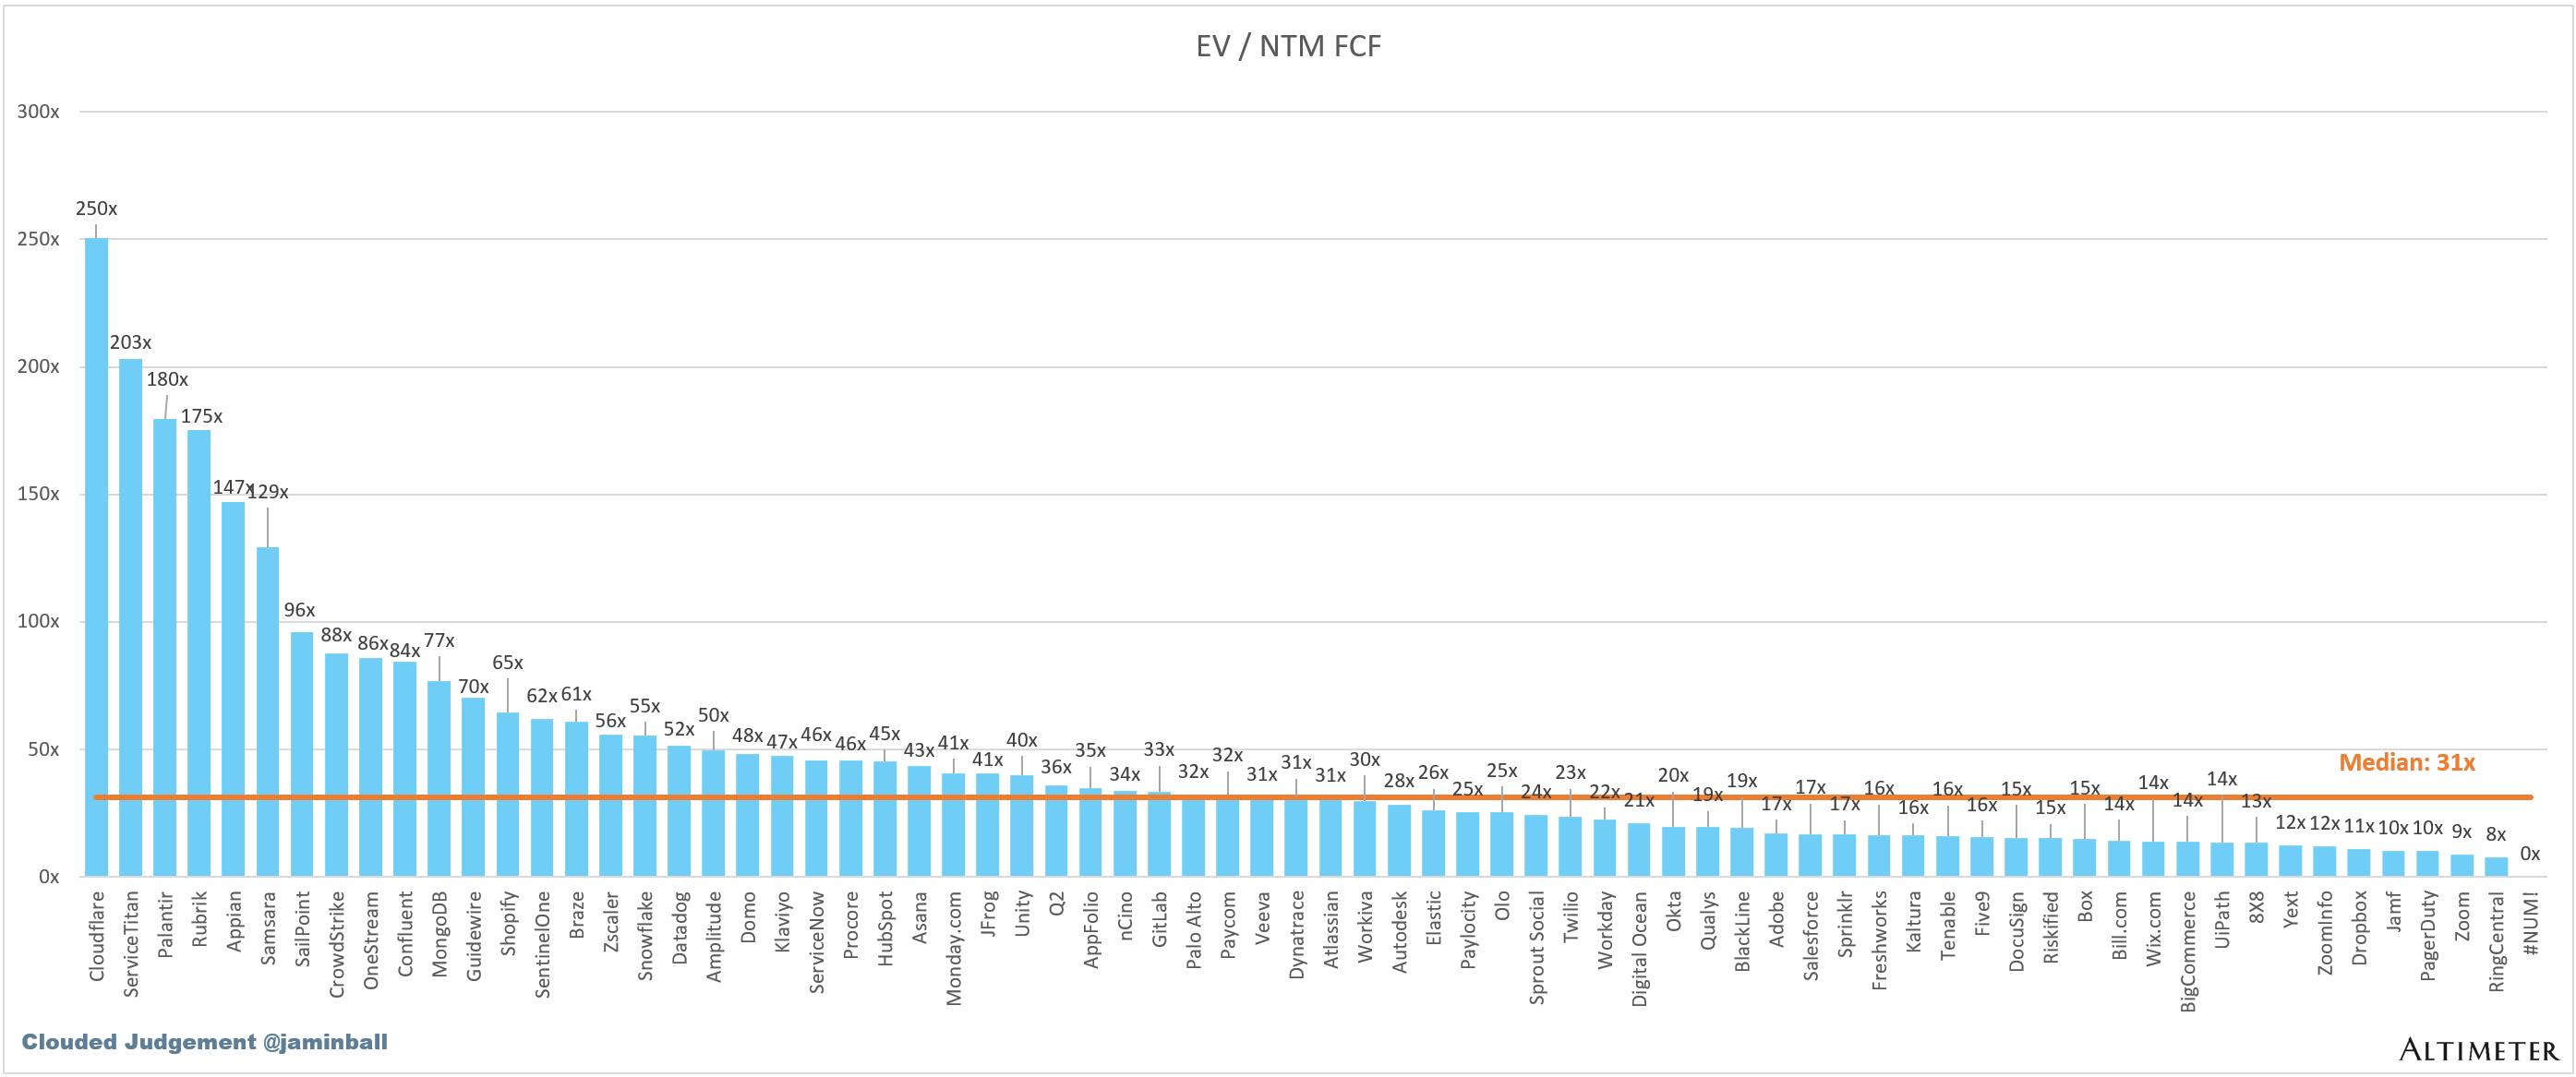
EV / NTM FCF
The line chart shows the median of all companies with a FCF multiple >0x and <100x. I created this subset to show companies where FCF is a relevant valuation metric.
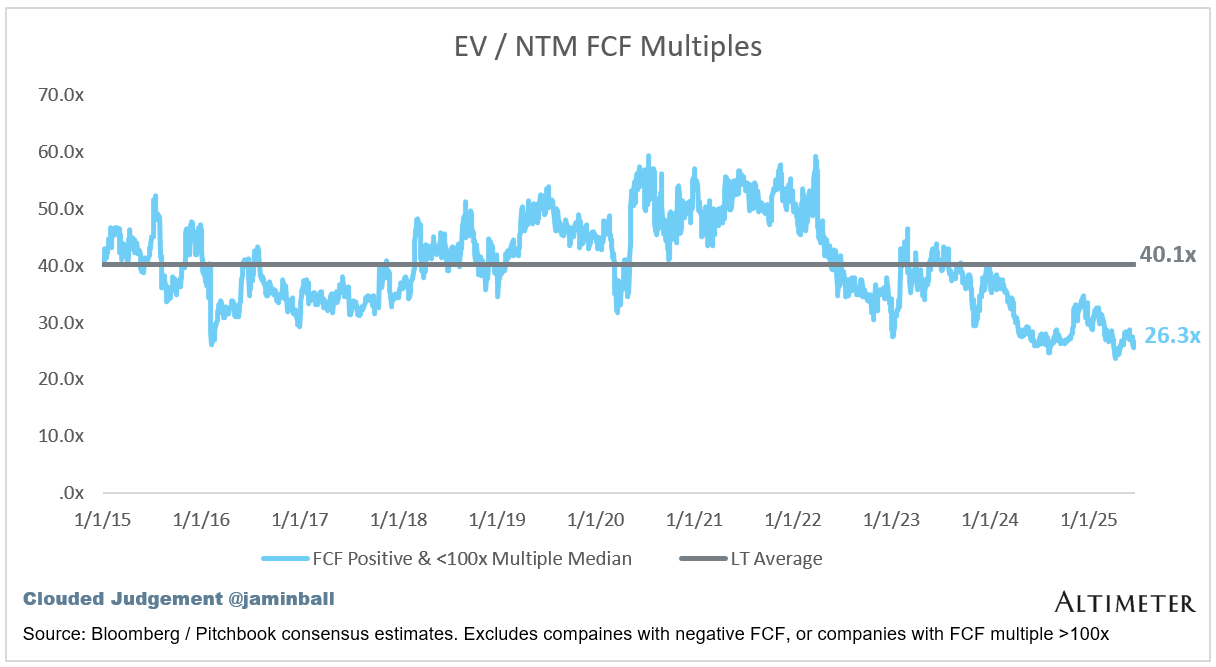
Companies with negative NTM FCF are not listed on the chart
Scatter Plot of EV / NTM Rev Multiple vs NTM Rev Growth
How correlated is growth to valuation multiple?

Operating Metrics
Median NTM growth rate: 11%
Median LTM growth rate: 14%
Median Gross Margin: 76%
Median Operating Margin (4%)
Median FCF Margin: 18%
Median Net Retention: 108%
Median CAC Payback: 72 months
Median S&M % Revenue: 38%
Median R&D % Revenue: 24%
Median G&A % Revenue: 17%
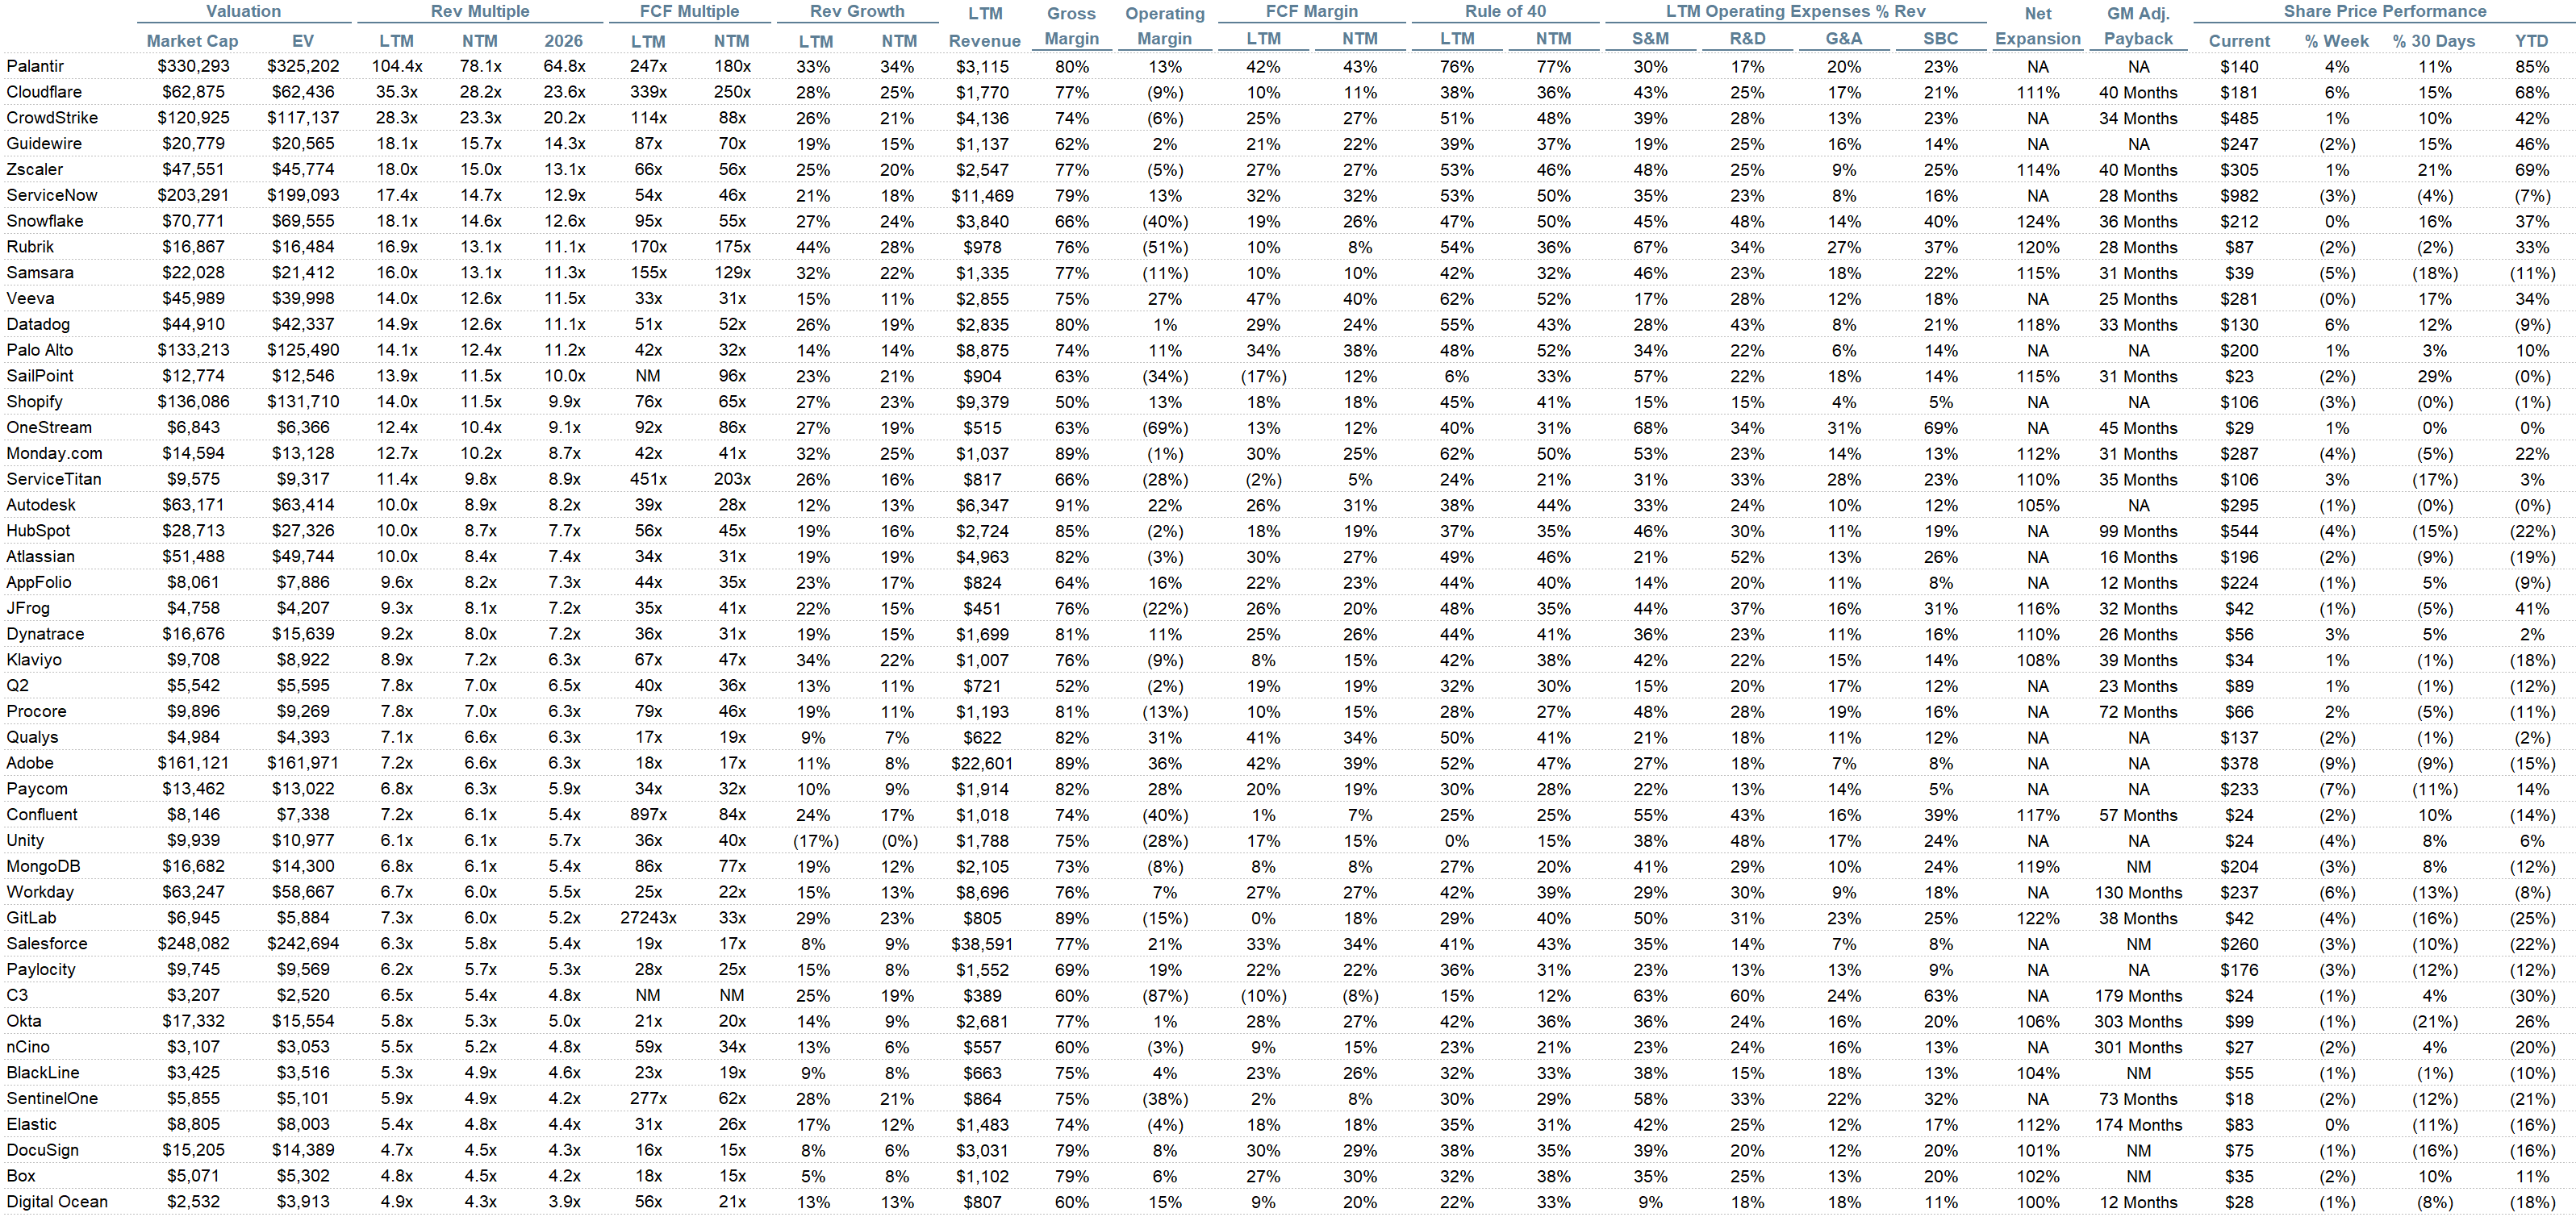
Comps Output
Rule of 40 shows rev growth + FCF margin (both LTM and NTM for growth + margins). FCF calculated as Cash Flow from Operations - Capital Expenditures
GM Adjusted Payback is calculated as: (Previous Q S&M) / (Net New ARR in Q x Gross Margin) x 12 . It shows the number of months it takes for a SaaS business to payback their fully burdened CAC on a gross profit basis. Most public companies don’t report net new ARR, so I’m taking an implied ARR metric (quarterly subscription revenue x 4). Net new ARR is simply the ARR of the current quarter, minus the ARR of the previous quarter. Companies that do not disclose subscription rev have been left out of the analysis and are listed as NA.
Sources used in this post include Bloomberg, Pitchbook and company filings
The information presented in this newsletter is the opinion of the author and does not necessarily reflect the view of any other person or entity, including Altimeter Capital Management, LP ("Altimeter"). The information provided is believed to be from reliable sources but no liability is accepted for any inaccuracies. This is for information purposes and should not be construed as an investment recommendation. Past performance is no guarantee of future performance. Altimeter is an investment adviser registered with the U.S. Securities and Exchange Commission. Registration does not imply a certain level of skill or training. Altimeter and its clients trade in public securities and have made and/or may make investments in or investment decisions relating to the companies referenced herein. The views expressed herein are those of the author and not of Altimeter or its clients, which reserve the right to make investment decisions or engage in trading activity that would be (or could be construed as) consistent and/or inconsistent with the views expressed herein.
This post and the information presented are intended for informational purposes only. The views expressed herein are the author’s alone and do not constitute an offer to sell, or a recommendation to purchase, or a solicitation of an offer to buy, any security, nor a recommendation for any investment product or service. While certain information contained herein has been obtained from sources believed to be reliable, neither the author nor any of his employers or their affiliates have independently verified this information, and its accuracy and completeness cannot be guaranteed. Accordingly, no representation or warranty, express or implied, is made as to, and no reliance should be placed on, the fairness, accuracy, timeliness or completeness of this information. The author and all employers and their affiliated persons assume no liability for this information and no obligation to update the information or analysis contained herein in the future.
Most SaaS is just UI for human workflows. What happens when agents run the workflows—and humans just talk to the AI?