Clouded Judgement 6.2.23 - Net New ARR Slowing
Every week I’ll provide updates on the latest trends in cloud software companies. Follow along to stay up to date!
Dispersion!
This week was quite interesting, with a number of big moves after quarterly reports. Let’s start with one obvious point - Q1s have been rough! Forget the outlook / guide for a minute. Just looking at Q1 in a vacuum we can say the quarters have objectively been quite bad. One of my favorite metrics to look at is net new ARR added in a quarter. It’s a bit of a swag as not all companies report ARR (and where they don’t I’m calculating ARR as quarterly subscription revenue x4). If we look at the net new ARR added in Q1 vs the quarterly average net new ARR added across the 4 quarters in 2022 (graphed below), you’ll see only 7 companies added more in Q1 ‘23 than their quarerly average across 2022. For many companies the net new ARR added in Q1 was the lowest it’s been in ~2 years.
The one point to call out is this is happening across a backdrop of mass layoffs - so companies have less quota capacity to close net new ARR in Q1 than they had across 2022.
If we cut the data slightly differently and look at the YoY change in net new ARR (Q1 ‘23 net new ARR vs Q1 ‘22 net new ARR) it paints a similar picture
So it’s clear the demand environment in Q1 was bad. But markets are forward looking - what matters more are trends in the demand environment. Are things getting better or worse? This week we heard conflicting points.
Okta and SentinelOne told us the demand environment / macro is getting worse. From SentinelOne: “Macroeconomic pressures continue to impact deal sizes, sales cycles, and pipeline conversion rates. While not entirely new, the impact from these factors was more pronounced in Q1.”
From Okta: “We're seeing increased macro headwinds on our business, most notably with new business across SMB and enterprise. These impacts were felt in varying degrees on a global basis. Similar to Q4, customers are requesting shorter contract term lengths, and our overall business was weighted more towards upsells versus new business. We're also seeing smaller average deal sizes as a result…Given the current macro environment, customers are not expanding seats at the rate they have in recent years, and we believe this trend will persist in this environment.”
On the other hand, Crowstrike and Mongo gave us hope that the demand environment is starting to shift.
From Crowdstrike: “Our strong Q2 pipeline and momentum with large consolidation deals give us confidence in the remainder of the year, including the back half where we expect to return to year-over-year growth in net new ARR” Great news! They expect to start seeing growth again in net new ARR (in Q1 YoY net new ARR fell 20% and hit a 6 quarter low). A return to growing net new ARR is a great sign.
I haven’t listened to Mongo’s earnings call yet, but their guide implied back half strength. While they added only ~$26m of net new ARR in Q1 (down significantly from the last 4 quarters), their guide for Q2 implied closer to ~$130m of net new ARR in Q2! This is a little bit of a swag given their consumption model. However, Mongo typically guides quite conservatively, and the guidance raise (they raised full year guide by 2% which was the second biggest full year raise of the entire software universe) could signal a faster recovery in their consumption.
All of this to say - we’re starting to see macro affect companies differently. Which is great - this leads to dispersion! SentinelOne and Crowdstrike are direct competitors. You wouldn’t expect such a different tone from each.
Are 2023 Numbers De-Risked?
My sense is the market really only cares about one thing right now (putting aside AI hype…) Are forward estimates going up or down? When we look at companies who provided full year guidance on their Q4 ‘22 call, and compare it to updated full year guidance they just gave on their Q1 ‘23 call, we see 3 types of companies. One’s where numbers are going up (Samsara, Mongo, Monday, etc). These companies saw huge jumps post earnings. Then there’s bucket 2 - minor / no change to full year guidance. This represents the majority of the software universe. Then there’s bucket 3 - companies who are reducing full year guides. Amplitude, SentinelOne, Pagerduty, Cloudflare, Snowflake, etc all saw their stocks drop quite a bit post earnings.
Numbers can’t start going up until they stop going down…Now that interest rates don’t appear to be a headwind to valuations (rates have either peaked or are close), business fundamentals come back into focus. Mongo / Crowdstrike gave us a glimmer of hope that the demand environment might start to be a tailwind for numbers to go up. Others like Okta and SentinelOne painted a different picture.
What’s exciting is that dispersion is back. Macro is now impacting companies differently. Differentiated products in markets with tailwinds are starting to see the light at the end of the tunnel, while the rest of the software universe still struggles
Next week I’ll dig in more on the consumption trends of the major consumption companies next week.
Quarterly Reports Summary
Top 10 EV / NTM Revenue Multiples
Top 10 Weekly Share Price Movement
Update on Multiples
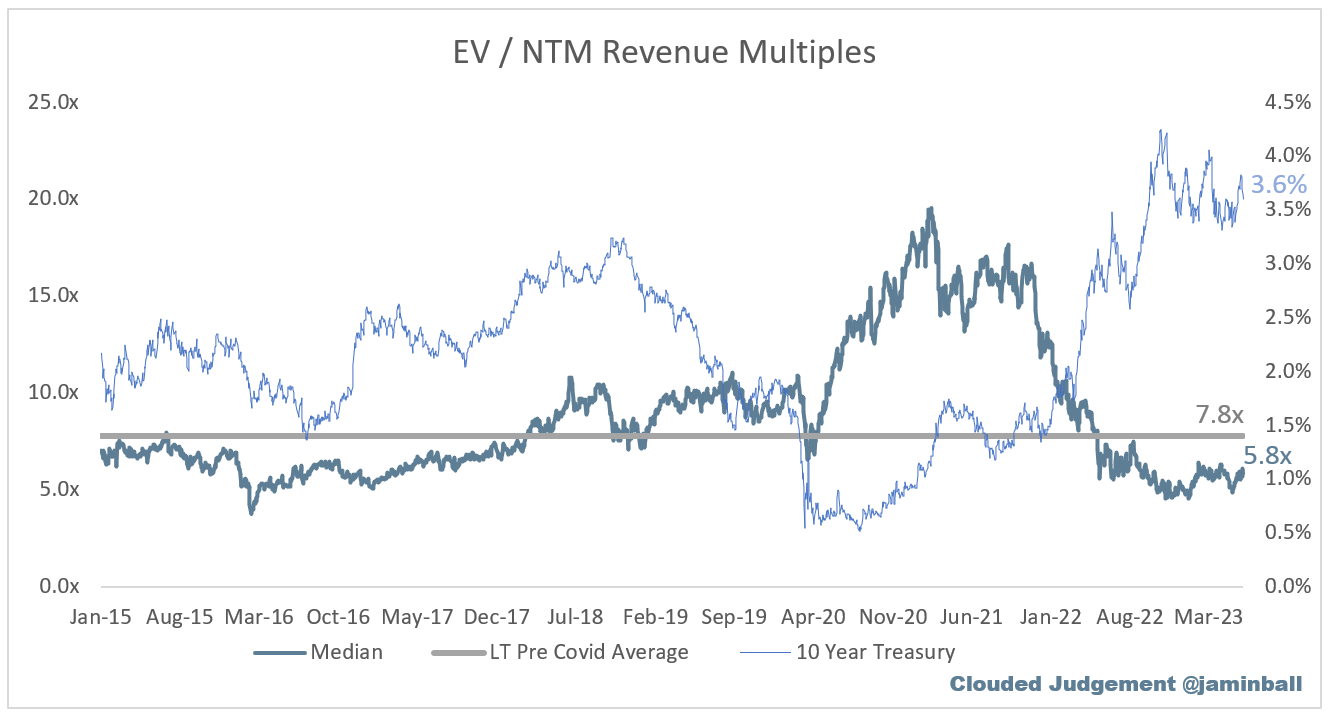
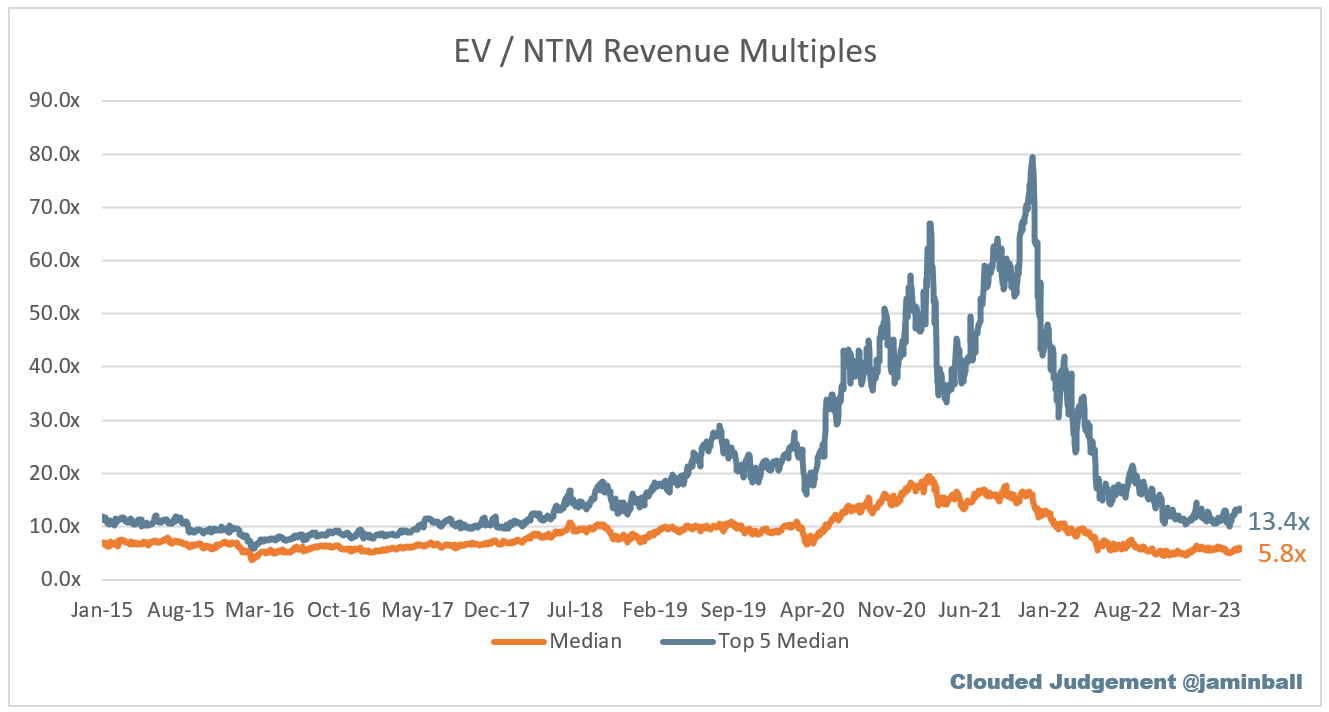
SaaS businesses are generally valued on a multiple of their revenue - in most cases the projected revenue for the next 12 months. Revenue multiples are a shorthand valuation framework. Given most software companies are not profitable, or not generating meaningful FCF, it’s the only metric to compare the entire industry against. Even a DCF is riddled with long term assumptions. The promise of SaaS is that growth in the early years leads to profits in the mature years. Multiples shown below are calculated by taking the Enterprise Value (market cap + debt - cash) / NTM revenue.
Overall Stats:
Overall Median: 5.8x
Top 5 Median: 13.4x
10Y: 3.6%
Bucketed by Growth. In the buckets below I consider high growth >30% projected NTM growth, mid growth 15%-30% and low growth <15%
High Growth Median: 9.4x
Mid Growth Median: 8.4x
Low Growth Median: 3.6x
EV / NTM FCF
Companies with negative NTM FCF are not listed on the chart
Scatter Plot of EV / NTM Rev Multiple vs NTM Rev Growth
How correlated is growth to valuation multiple?
Growth Adjusted EV / NTM Rev
The below chart shows the EV / NTM revenue multiple divided by NTM consensus growth expectations. The goal of this graph is to show how relatively cheap / expensive each stock is relative to their growth expectations
Operating Metrics
Median NTM growth rate: 15%
Median LTM growth rate: 25%
Median Gross Margin: 75%
Median Operating Margin (21%)
Median FCF Margin: 3%
Median Net Retention: 115%
Median CAC Payback: 49 months
Median S&M % Revenue: 46%
Median R&D % Revenue: 27%
Median G&A % Revenue: 18%
Comps Output
Rule of 40 shows rev growth + FCF margin (both LTM and NTM for growth + margins). FCF calculated as Cash Flow from Operations - Capital Expenditures
GM Adjusted Payback is calculated as: (Previous Q S&M) / (Net New ARR in Q x Gross Margin) x 12 . It shows the number of months it takes for a SaaS business to payback their fully burdened CAC on a gross profit basis. Most public companies don’t report net new ARR, so I’m taking an implied ARR metric (quarterly subscription revenue x 4). Net new ARR is simply the ARR of the current quarter, minus the ARR of the previous quarter. Companies that do not disclose subscription rev have been left out of the analysis and are listed as NA.
This post and the information presented are intended for informational purposes only. The views expressed herein are the author’s alone and do not constitute an offer to sell, or a recommendation to purchase, or a solicitation of an offer to buy, any security, nor a recommendation for any investment product or service. While certain information contained herein has been obtained from sources believed to be reliable, neither the author nor any of his employers or their affiliates have independently verified this information, and its accuracy and completeness cannot be guaranteed. Accordingly, no representation or warranty, express or implied, is made as to, and no reliance should be placed on, the fairness, accuracy, timeliness or completeness of this information. The author and all employers and their affiliated persons assume no liability for this information and no obligation to update the information or analysis contained herein in the future.


Great, that's quite helpful - but how to understand SNOW and NET's huge rally after reporting a relatively disappointing results? (SNOW guided down quite a lot…… for twice sequencially;NET also mentioned challenging macro environment. The "AI FOMO" still plays a significant role here?
Great read. Thanks for putting together!