Clouded Judgement 6.23.23 - Atlas Consumption and Q1 Earnings Trends
Every week I’ll provide updates on the latest trends in cloud software companies. Follow along to stay up to date!
MongoDB Atlas Consumption Trends
I loved this chart from Mongo’s investor day. Very clearly depicts the drop off in consumption that started in Q2 of last year. In Q1 consumption picked up - and in their guide for Q2 and rest of year they suggested this may continue. Very interesting trend to monitor, and kudos to the Mongo team for sharing this level of detail
Quarterly Metrics Trends
We’re now through Q1 earnings season. I posted a longer recap that you can find here, but wanted to highlight a few trends around growth, net retention, sales efficiency and FCF margins.
Let’s start with growth. The chart below shows the median YoY growth rate going back to the start of 2020. As you can see, we’ve had a faster deceleration in the median growth rate in the last 2 quarters. Deceleration is normal - especially when the basket of companies I’m using hasn’t added any new high growth IPOs (I’ll add companies to the basket as soon as they go public). However, the rate of change of the decel has definitely picked up in the last 2 quarters.
Moving to net retention. As you can see, net retention also started to fall this quarter. The broader commentary suggests gross churn hasn’t dropped off that much, but expansion revenue has really fallen.
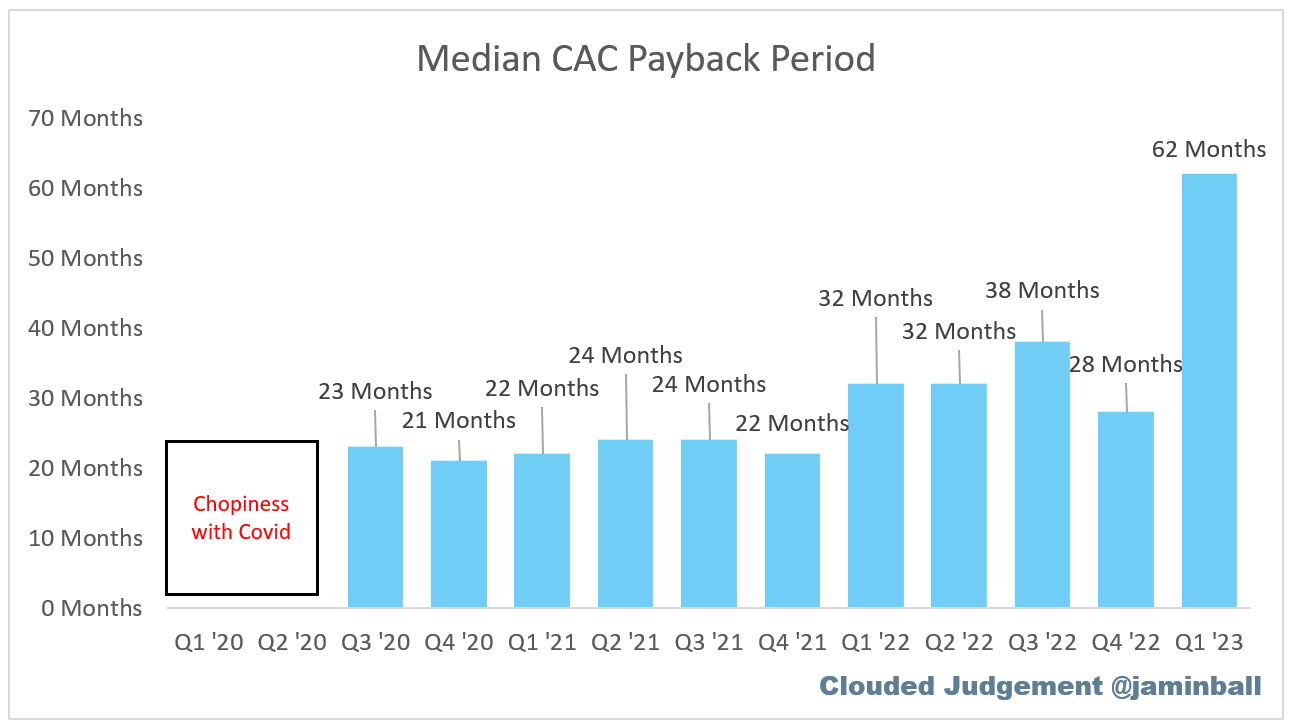
On sales efficiency (I use gross margin adjusted CAC payback), we saw a huge spike in Q1. Not surprising - new bookings have been harder to come buy, and companies haven’t reduced their sales force to the same extent they’ve felt business headwinds.
The bright spot is FCF margins. The median FCF margin has been increasingly steadily over the last few quarters
Top 10 EV / NTM Revenue Multiples
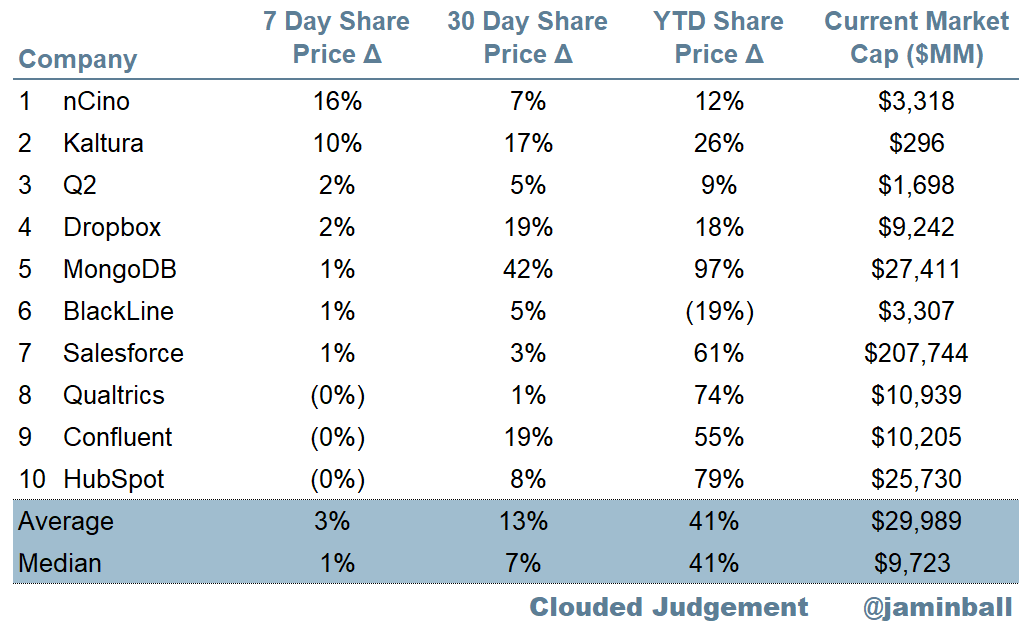
Top 10 Weekly Share Price Movement
Update on Multiples
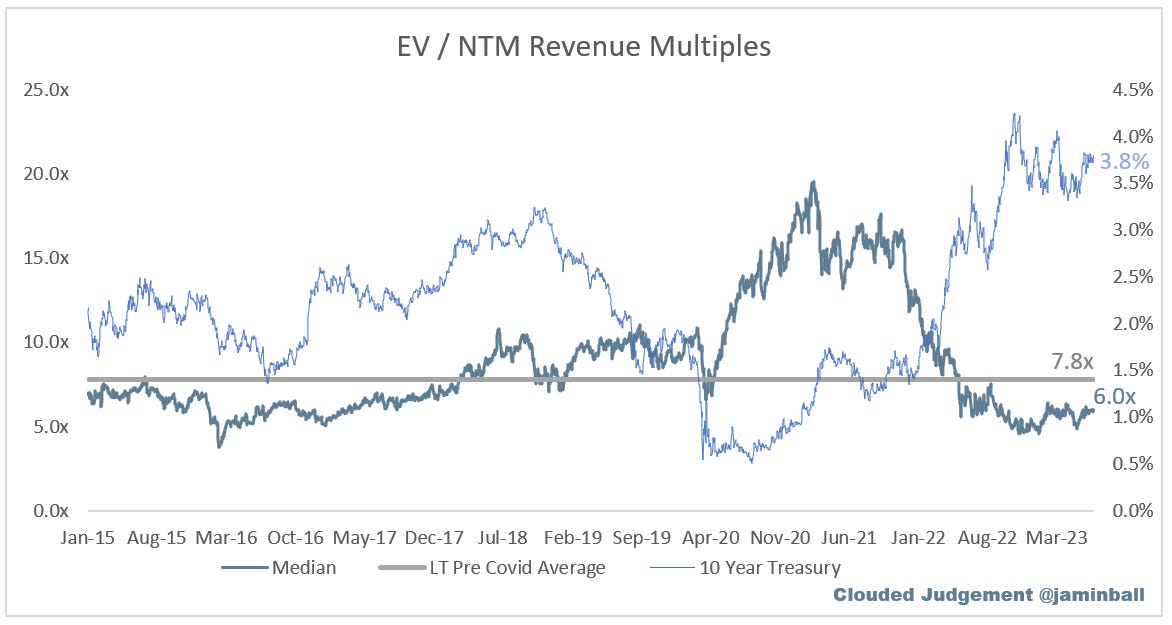
SaaS businesses are generally valued on a multiple of their revenue - in most cases the projected revenue for the next 12 months. Revenue multiples are a shorthand valuation framework. Given most software companies are not profitable, or not generating meaningful FCF, it’s the only metric to compare the entire industry against. Even a DCF is riddled with long term assumptions. The promise of SaaS is that growth in the early years leads to profits in the mature years. Multiples shown below are calculated by taking the Enterprise Value (market cap + debt - cash) / NTM revenue.
Overall Stats:
Overall Median: 6.0x
Top 5 Median: 15.7x
10Y: 3.8%
Bucketed by Growth. In the buckets below I consider high growth >30% projected NTM growth, mid growth 15%-30% and low growth <15%
High Growth Median: 10.1x
Mid Growth Median: 8.5x
Low Growth Median: 3.5x
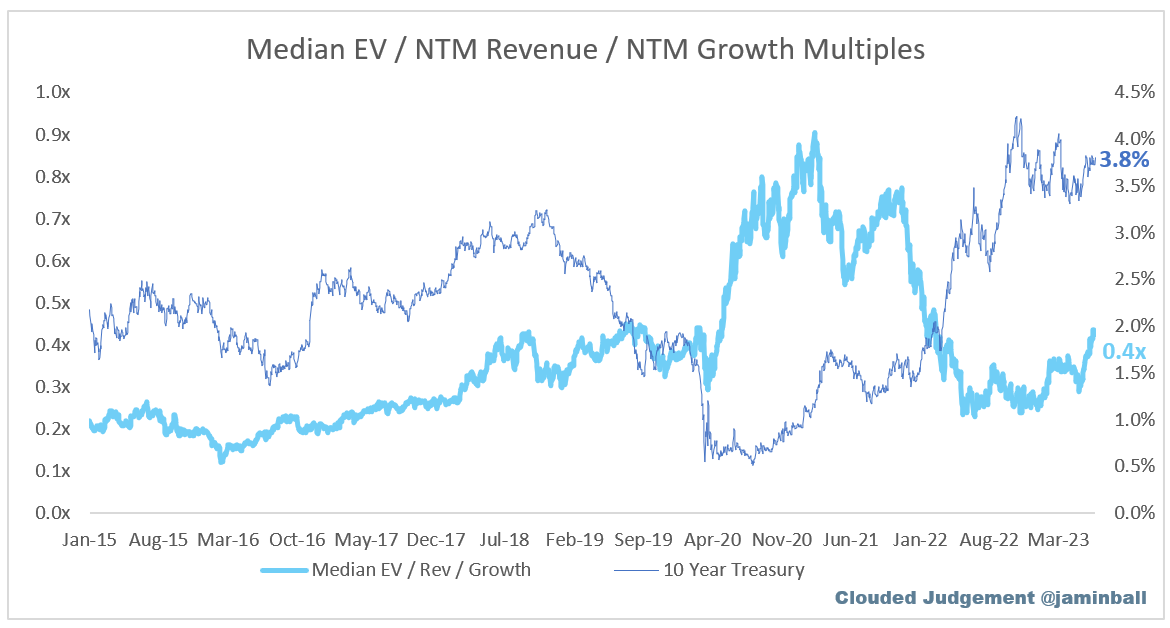
EV / NTM Rev / NTM Growth
The below chart shows the EV / NTM revenue multiple divided by NTM consensus growth expectations. The goal of this graph is to show how relatively cheap / expensive each stock is relative to their growth expectations
EV / NTM FCF
Companies with negative NTM FCF are not listed on the chart
Scatter Plot of EV / NTM Rev Multiple vs NTM Rev Growth
How correlated is growth to valuation multiple?
Operating Metrics
Median NTM growth rate: 15%
Median LTM growth rate: 24%
Median Gross Margin: 75%
Median Operating Margin (20%)
Median FCF Margin: 5%
Median Net Retention: 115%
Median CAC Payback: 57 months
Median S&M % Revenue: 46%
Median R&D % Revenue: 27%
Median G&A % Revenue: 18%
Comps Output
Rule of 40 shows rev growth + FCF margin (both LTM and NTM for growth + margins). FCF calculated as Cash Flow from Operations - Capital Expenditures
GM Adjusted Payback is calculated as: (Previous Q S&M) / (Net New ARR in Q x Gross Margin) x 12 . It shows the number of months it takes for a SaaS business to payback their fully burdened CAC on a gross profit basis. Most public companies don’t report net new ARR, so I’m taking an implied ARR metric (quarterly subscription revenue x 4). Net new ARR is simply the ARR of the current quarter, minus the ARR of the previous quarter. Companies that do not disclose subscription rev have been left out of the analysis and are listed as NA.
This post and the information presented are intended for informational purposes only. The views expressed herein are the author’s alone and do not constitute an offer to sell, or a recommendation to purchase, or a solicitation of an offer to buy, any security, nor a recommendation for any investment product or service. While certain information contained herein has been obtained from sources believed to be reliable, neither the author nor any of his employers or their affiliates have independently verified this information, and its accuracy and completeness cannot be guaranteed. Accordingly, no representation or warranty, express or implied, is made as to, and no reliance should be placed on, the fairness, accuracy, timeliness or completeness of this information. The author and all employers and their affiliated persons assume no liability for this information and no obligation to update the information or analysis contained herein in the future.


Really great job here- any reason why PANW isn’t on this chart? I know they’ve got some on prem components but they’re transitioning quickly into cloud and have a been on a tear lately
Hi, I look forward to your weekly emails. I have been researching cloud computing and AI, and came across this talk with the AWS CEO on Bloomberg, which is very insightful. Hope you can also connect the dots between AI and cloud commuting. Thanks for your weekly insights.
https://www.bloomberg.com/news/videos/2023-06-22/aws-ceo-selipsky-on-the-ai-boom-video