Every week I’ll provide updates on the latest trends in cloud software companies. Follow along to stay up to date!
**Please excuse any typos or repetitiveness, I’m writing this as I watch the Warriors game so very distracted. Go Dubs! **
Consumption Pricing vs SaaS Subscription
Hot topic of the week is consumption pricing vs a more classic subscription model, and which is more resilient in a downturn / recession. This topic was debated even further after Snowflake reported earnings and called out lower than expected usage in a couple digital consumer businesses. Consumption models have recently become more commonplace, and have never been tested in a downturn. The main knock against them is they're less predictable, and more prone to volatility (either up or down).
For those unfamiliar, in the most simple terms a consumption model is one where you pay for software according to resources used (data stored, APIs called, etc). A subscription model is an annual (or multi-year) contract agreed to up front. This may be based on number of seats, or number of modules bought.
One key misconception about consumption models is that they’re equivalent to on-demand pricing. They’re not! Most consumption models come with annual minimums, where money is wired up front (this is why Snowflake’s Q4 and Q1 are seasonally high FCF quarters). Then there is a variable component on top of these minimums. So which model is more resilient?
Most important part of the answer - in a recession it doesn’t matter if you (a vendor) have a consumption or subscription model. What matters is UTILITY. Is your software being USED and is it driving VALUE. In a recession, a CFO will line up all vendor spend, and analyze which software they’re paying for but not using (or using in full). The interesting aspect of consumption pricing is you are by definition using every cent you’re paying for. Now, this doesn’t mean all consumption spend is efficient spend. Take Snowflake - some BI analyst might set up a recurring job that every week pulled user signups and displayed on a chart the demographic breakdown of signups by age. This BI analyst then left their company, but that recurring job kept running (and no one was viewing the output in Looker). With Snowflake’s pricing, running that job used compute (and customer was charged). So while the cost was for software being “used” it wasn’t efficient. In good times, this inefficient spend goes unnoticed. In a downturn, everything is scrutinized.
So what’s my take? I believe consumption is more prone to short term volatility (both up and down), but more durable over the long term. One hidden element of the analysis is I believe the overall quality of companies with consumption based models is higher. With a consumption model, you can’t hide with bloat spend. Consumption models also lends themselves to products with high daily active usage (which I believe leads to higher ROI). However, because consumption models don’t have to be renegotiated to reduce spend, in the short term there’s very little barriers to do so. At the same time, I also believe that most of the consumption spend is efficient spend. With SaaS subscription, you have a lot more “shelf ware” or bloat spend. ie paying for 100 seat license but only really using 70. While this may not immediately get cut, it’s definitely getting cut at the next contract renewal, or companies go back to vendors and threaten to churn entirely. Vendors almost always will then offer a renegotiated contract at a lower rate to avoid the churn.
Morgan Stanley had a great report that outlined some pros / cons of consumption pricing and Subscription pricing.
Quarterly Reports Summary
Top 10 EV / NTM Revenue Multiples
**companies that reported this week (Crowdstrike, Mongo) don’t have updated NTM estimates yet
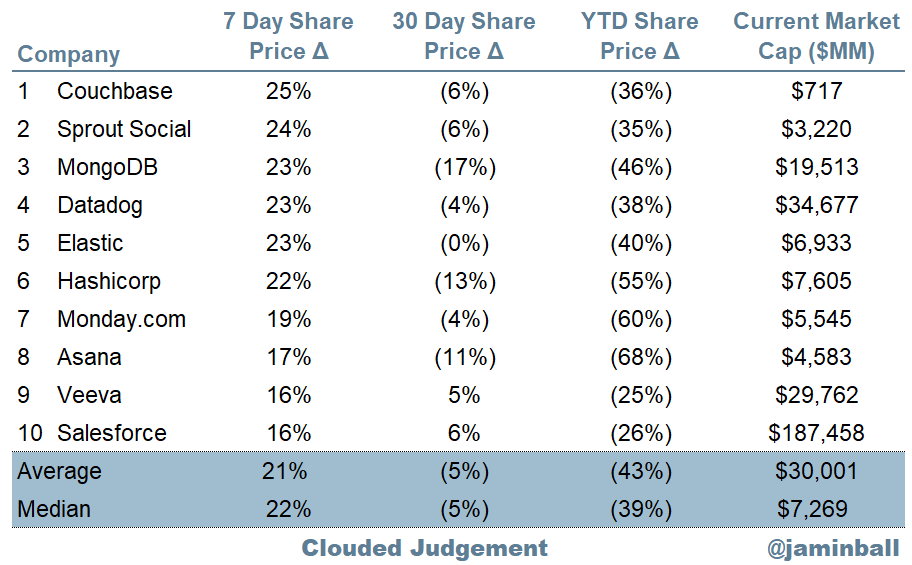
Top 10 Weekly Share Price Movement
Update on Multiples
SaaS businesses are valued on a multiple of their revenue - in most cases the projected revenue for the next 12 months. Multiples shown below are calculated by taking the Enterprise Value (market cap + debt - cash) / NTM revenue.
Overall Stats:
Overall Median: 7.1x
Top 5 Median: 18.1x
3 Month Trailing Average: 8.1x
1 Year Trailing Average: 12.6x
Bucketed by Growth. In the buckets below I consider high growth >30% projected NTM growth, mid growth 15%-30% and low growth <15%
High Growth Median: 9.2x
Mid Growth Median: 7.1x
Low Growth Median: 3.8x
Scatter Plot of EV / NTM Rev Multiple vs NTM Rev Growth
How correlated is growth to valuation multiple?
Growth Adjusted EV / NTM Rev
The below chart shows the EV / NTM revenue multiple divided by NTM consensus growth expectations. The goal of this graph is to show how relatively cheap / expensive each stock is relative to their growth expectations
Operating Metrics
Median NTM growth rate: 25%
Median LTM growth rate: 32%
Median Gross Margin: 74%
Median Operating Margin (24%)
Median FCF Margin: 3%
Median Net Retention: 120%
Median CAC Payback: 32 months
Median S&M % Revenue: 46%
Median R&D % Revenue: 27%
Median G&A % Revenue: 20%
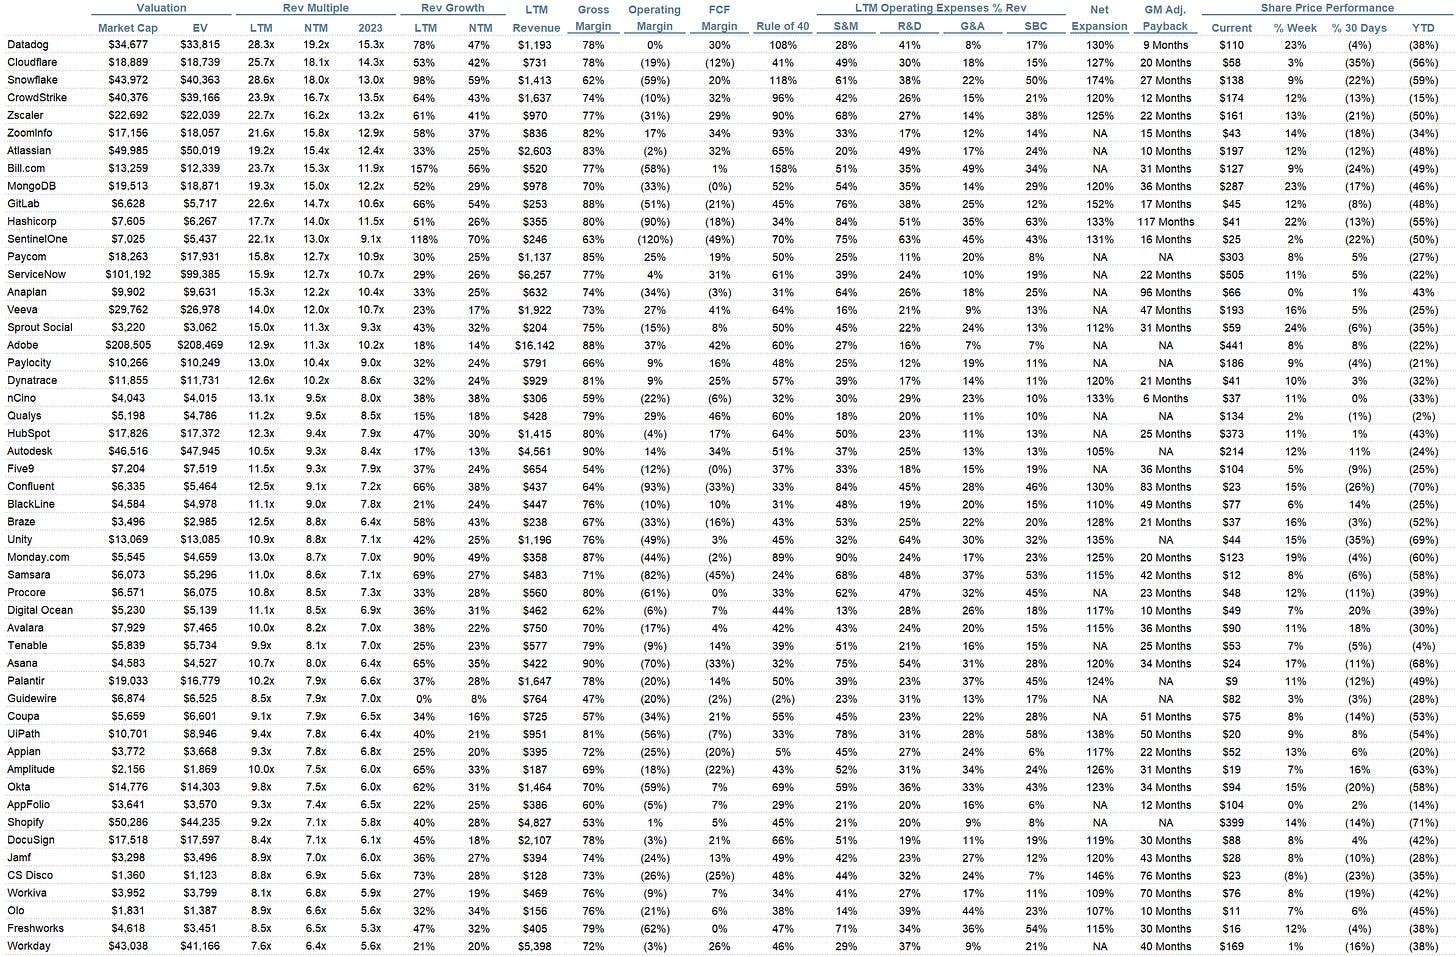
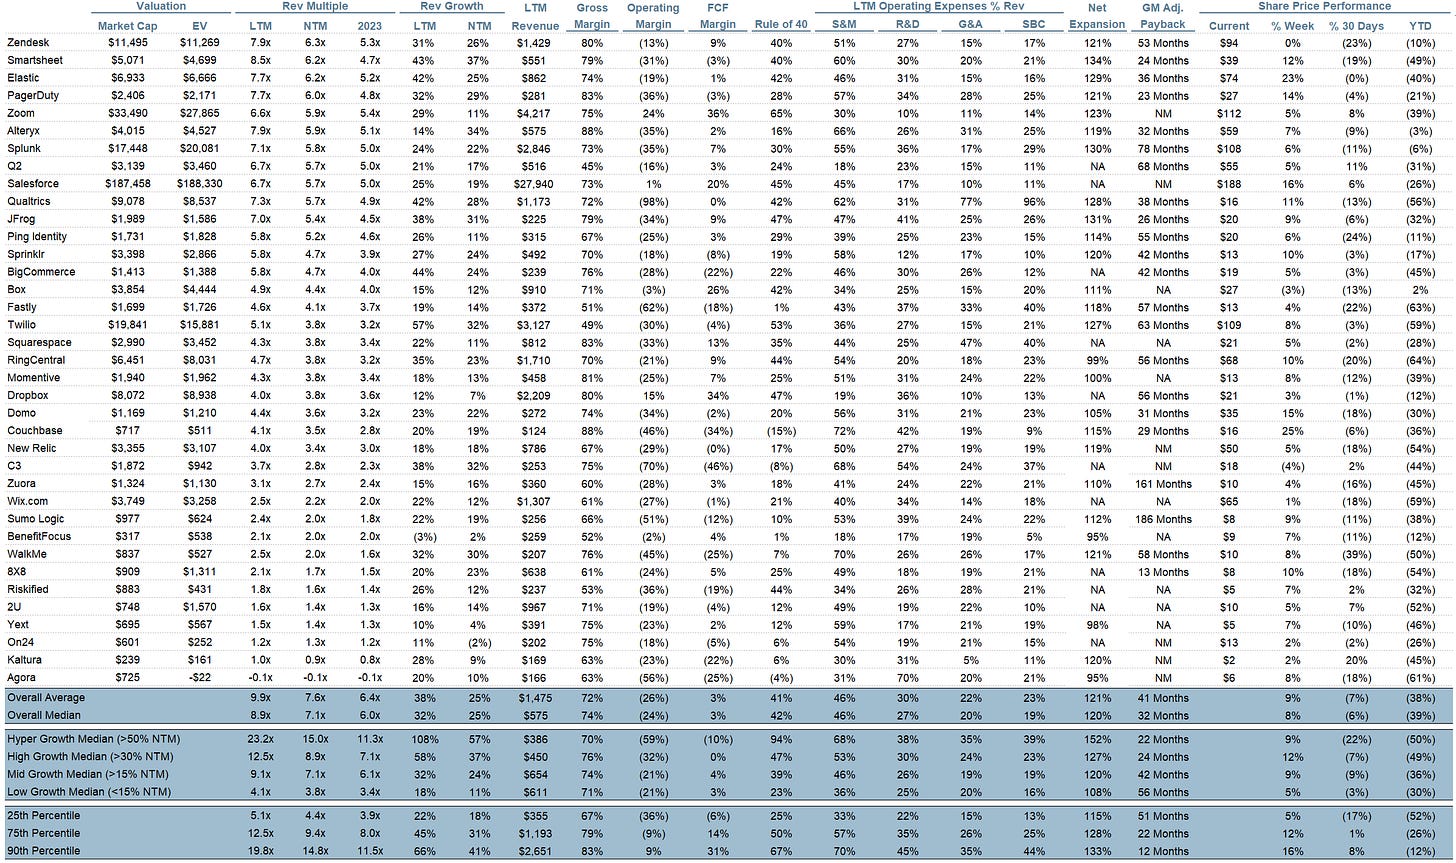
Comps Output
Rule of 40 shows LTM growth rate + LTM FCF Margin. FCF calculated as Cash Flow from Operations - Capital Expenditures
GM Adjusted Payback is calculated as: (Previous Q S&M) / (Net New ARR in Q x Gross Margin) x 12 . It shows the number of months it takes for a SaaS business to payback their fully burdened CAC on a gross profit basis. Most public companies don’t report net new ARR, so I’m taking an implied ARR metric (quarterly subscription revenue x 4). Net new ARR is simply the ARR of the current quarter, minus the ARR of the previous quarter. Companies that do not disclose subscription rev have been left out of the analysis and are listed as NA.
This post and the information presented are intended for informational purposes only. The views expressed herein are the author’s alone and do not constitute an offer to sell, or a recommendation to purchase, or a solicitation of an offer to buy, any security, nor a recommendation for any investment product or service. While certain information contained herein has been obtained from sources believed to be reliable, neither the author nor any of his employers or their affiliates have independently verified this information, and its accuracy and completeness cannot be guaranteed. Accordingly, no representation or warranty, express or implied, is made as to, and no reliance should be placed on, the fairness, accuracy, timeliness or completeness of this information. The author and all employers and their affiliated persons assume no liability for this information and no obligation to update the information or analysis contained herein in the future.


Fantastic read. Thanks for distilling.
I think one aspect of this I've seen misunderstood is the impact to the bottom line. As you say in your post, typically the "money is wired up front" so Snowflake has this money in the bank when the contract is signed. However, Snowflake can't recognize this money until the customer actually uses the service and spends the credits their money bought them. But the important part of this is the "contract" part. Let's say in the worst case a customer didn't consume their contract and didn't want to renew (rare at 174% NRR). Snowflake would still eventually recognize the remainder of the credits at the end of the contract. However, this is rare. As long as customers renew for the same amount or more, any unused credits would roll over to the new contract if the initial estimate turned out to be a little high.
Reflective of the points that Morgan Stanley Research were making, compare Snowflake NPS and Dresner Customer Satisfaction Scores with that of vendors who routinely oversell customers features and seats that go unused--in some cases, forever. There is a reason why customers like Snowflake so much and this is one of them.