


Clouded Judgement 6.6.25 - How to Spot ERR

Every week I’ll provide updates on the latest trends in cloud software companies. Follow along to stay up to date!
How to Spot ERR
Last March (crazy it’s already been a year since I wrote this post!) I wrote an article about ERR vs ARR. Here’s a quick summary of that post. ARR (annual recurring revenue) is a hallmark SaaS metric rooted in predictability. Customers sign multi-year contracts, churn and expansion are stable, and revenue can be confidently modeled. That predictability underpins why investors find “comfort” in SaaS models. However, many companies misuse ARR and count forms of non-recurring revenue as ARR, confusing the metric. This “misuse of ARR” trend has accelerated in the age of AI, as business models have evolved (into more usage/success-based vs. seat-based), and everyone is tinkering with new AI products. This has led to a new form of ARR I’m calling ERR — experimental run rate revenue. ERR is not as predictable. It’s not as stable. It can explode upward or crash downward.
It’s very important for founders to truly understand their own revenue base and differentiate between ARR and ERR. Of course, the answer will often be “we have both.” But understanding the mix shift is critical. Hiring decisions, spend planning, fundraising, etc., are generally based on some top-level revenue plan. And if that revenue plan is wrong (because you thought you had sticky, stable ARR but actually had ERR that evaporated overnight), then many of the operational decisions you made around hiring, spending, fundraising, etc., will also be wrong. You could end up with an upside-down P&L, burning way more money than you expected, or a valuation in a fundraise that now leaves you with heroic performance to grow into.
So how can you spot ERR vs. ARR? This is a question I get a lot. Below are some common examples I see of ERR. And it’s worth calling out that the concept of ERR is really born out of the business model shift to consumption/outcome-based pricing, where there is less “lock-in.”
Pilots. Everyone knows what a pilot/trial is, but the context I’m using here is slightly different. Many companies build out functionality they want to trial with a subset of users. It’s hard to know which AI features will become consumer staples, so you try a lot and stick with what works. Roll it out, see if it picks up adoption, and then kill it if the ROI isn’t there—or roll it out more fully if the ROI is there. All of the solutions they bought to build that functionality could be canned if they decide not to roll out that feature. Last year, McDonald’s canceled their AI drive-thru solution. Any vendor they used as part of that solution saw their revenue evaporate. So what should founders do? Look at your customer base and figure out which ones are deploying your solution in a “test” end use case vs. something they’re fully committed to.
“I needed this functionality yesterday.” Very often, when I’m doing diligence on a product and ask customers why they went with a specific vendor, the answer I get is, “My boss told me I needed to ship this product yesterday, so I grabbed the first thing I could to ship it as fast as I could.” This could be infrastructure (dev tools, databases, etc.) or applications. The challenge here is there was little evaluation of alternatives. The follow-up question I ask is, “The vendors you chose to go with—are you wedded to them for the long haul?” And more often than not, the answer is, “No, we needed something to get the product out the door, and we’ll evaluate the tech stack/alternatives once we know we want to commit to the functionality.”
Undefined ROI. This one comes up a lot. When I’m doing diligence and ask a customer, “Why did you go with vendor X?” very often the answer is, “My boss told me I needed to infuse AI into our workflow, so I bought them.” The ROI is fuzzy, and it’s very unclear whether that vendor will survive over the long term. IBM recently released a study saying that, of the companies surveyed, only 25% of AI initiatives have delivered expected ROI over the last few years… It’s maybe ironic that the vendor McDonald’s used in their AI drive-thru (which was canceled) was IBM. For founders—make sure you know how your customers (and particularly your largest customers) define success/ROI from your product. And make sure you’re getting them there!
Budget Source. I always ask where the budget came from for specific vendor purchases. If it came from a well-defined, existing budget, I feel great. If it was some sort of catch-all, amorphous budget, I get nervous. Founders—make sure you know where the budget is coming from!
The Contract. What type of contract obligations are built in? Is it pure consumption, or committed usage plus overages? Is there an auto-renewing agreement? Is it purely pay-as-you-go? Is there no minimum spend? These are questions that can lead to ERR.
Champion Risk. ERR is often concentrated in situations where one internal champion is experimenting solo. If your product isn’t embedded in a broader workflow or adopted across teams, it can disappear the moment that person changes roles, leaves, or deprioritizes the project.
Integrations. Integrations are the classic SaaS moat. Look at Salesforce—if you wanted to replace Salesforce, you’d also have to replace and update every workflow that touches a Salesforce system. Good luck. If your product is being used as a bolt-on or sidecar and not integrated into the core data pipeline, production environment, or operational workflows, it’s easier to rip out. ERR often lives on the edges.
Tourist Customers. When buyers are engaging because “everyone is doing it” (AI, LLMs, etc.), they often don’t have a long-term plan. These hype-driven purchases can inflate revenue in the short term but vanish once the novelty fades or leadership attention shifts elsewhere. If the buyer can’t clearly articulate their long-term plan for the use case, it’s probably ERR.
Easy Come, Easy Go. How long did it take to integrate the product? This one is a double-edged sword. You want it to be quick to integrate, but that also means it’s generally easier to rip out.
Renewal Cycles. This one takes more time, but digging into whether customers have been through a renewal cycle (or not) is important. If they have, I take a lot more comfort in the durability of the revenue.
There are many more bullets I could add to the list. At the end of the day, there’s no one-size-fits-all rule for ARR vs. ERR. But looking at all of the above signals in parallel can help. I’d categorize these into the following buckets:
Behavioral signals (e.g., urgency, lack of commitment)
Organizational signals (e.g., who bought it, where the budget came from)
Technical signals (e.g., is it integrated, does it hold state?)
Commercial signals (e.g., contract terms, pricing power, renewals)
Quarterly Reports Summary

Top 10 EV / NTM Revenue Multiples

Top 10 Weekly Share Price Movement

Update on Multiples
SaaS businesses are generally valued on a multiple of their revenue - in most cases the projected revenue for the next 12 months. Revenue multiples are a shorthand valuation framework. Given most software companies are not profitable, or not generating meaningful FCF, it’s the only metric to compare the entire industry against. Even a DCF is riddled with long term assumptions. The promise of SaaS is that growth in the early years leads to profits in the mature years. Multiples shown below are calculated by taking the Enterprise Value (market cap + debt - cash) / NTM revenue.
Overall Stats:
Overall Median: 5.7x
Top 5 Median: 22.2x
10Y: 4.4%


Bucketed by Growth. In the buckets below I consider high growth >25% projected NTM growth, mid growth 15%-25% and low growth <15%
High Growth Median: 21.8x
Mid Growth Median: 9.4x
Low Growth Median: 4.1x


EV / NTM Rev / NTM Growth
The below chart shows the EV / NTM revenue multiple divided by NTM consensus growth expectations. So a company trading at 20x NTM revenue that is projected to grow 100% would be trading at 0.2x. The goal of this graph is to show how relatively cheap / expensive each stock is relative to their growth expectations


EV / NTM FCF
The line chart shows the median of all companies with a FCF multiple >0x and <100x. I created this subset to show companies where FCF is a relevant valuation metric.

Companies with negative NTM FCF are not listed on the chart

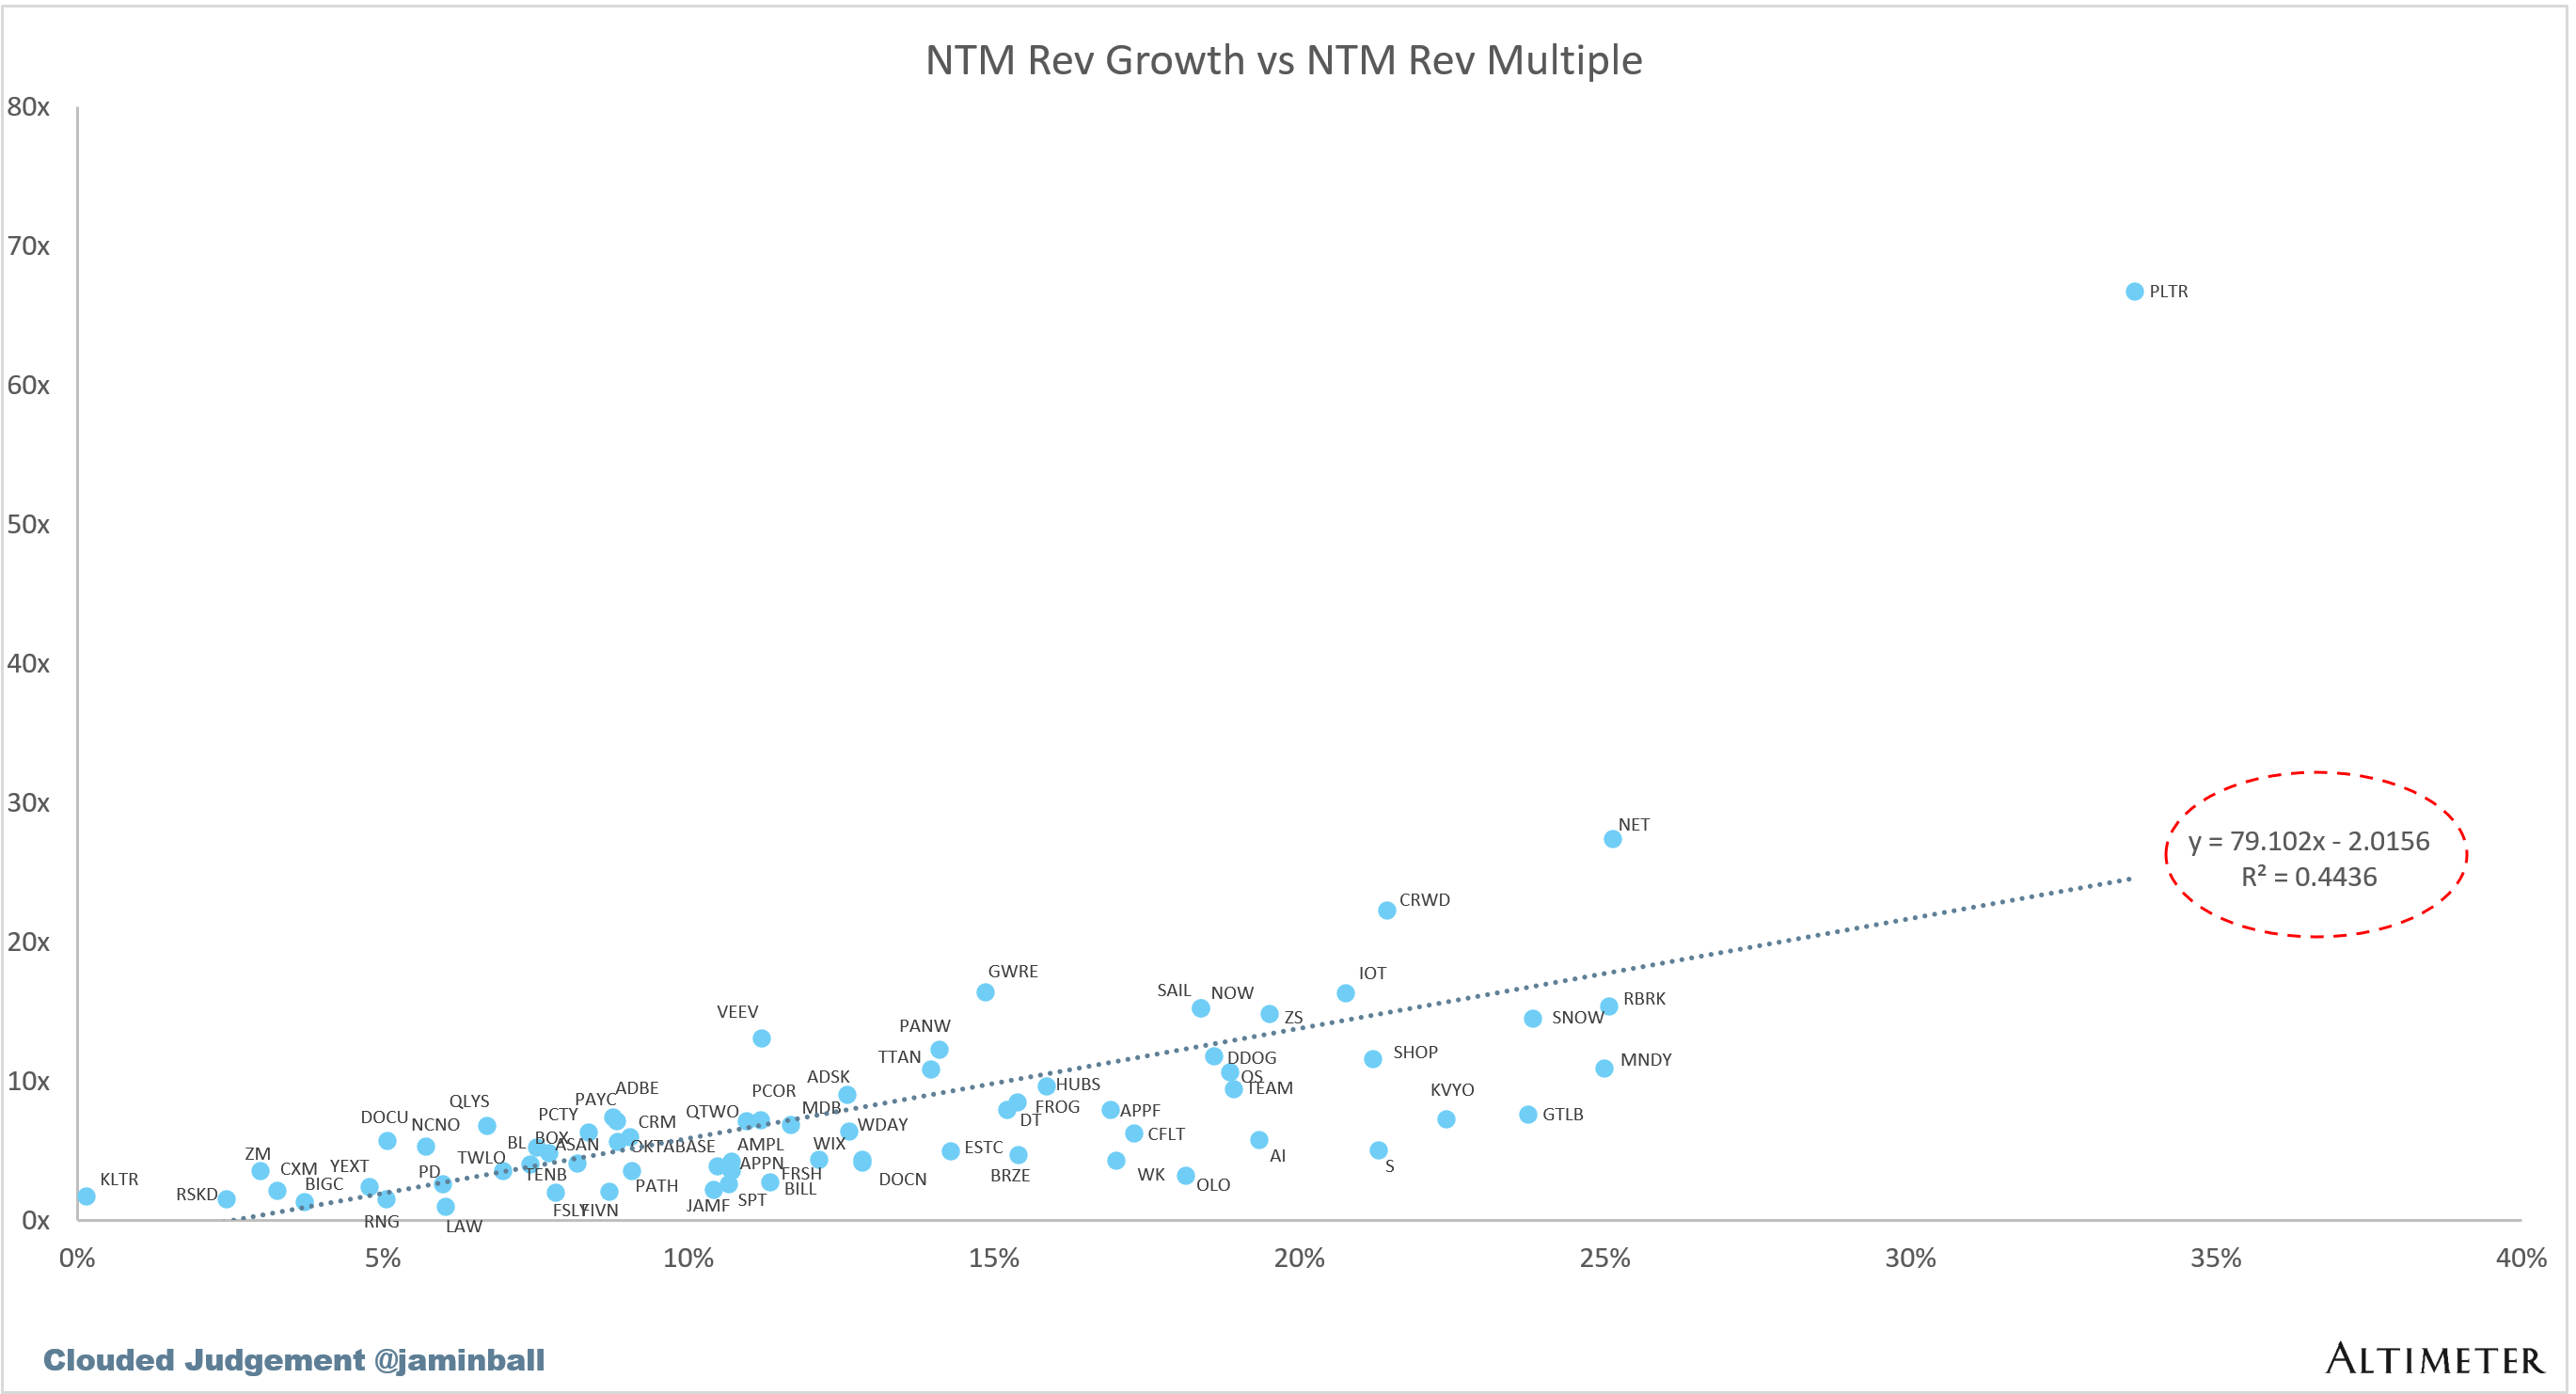
Scatter Plot of EV / NTM Rev Multiple vs NTM Rev Growth
How correlated is growth to valuation multiple?
Operating Metrics
Median NTM growth rate: 11%
Median LTM growth rate: 14%
Median Gross Margin: 76%
Median Operating Margin (5%)
Median FCF Margin: 18%
Median Net Retention: 108%
Median CAC Payback: 72 months
Median S&M % Revenue: 38%
Median R&D % Revenue: 24%
Median G&A % Revenue: 16%
Comps Output
Rule of 40 shows rev growth + FCF margin (both LTM and NTM for growth + margins). FCF calculated as Cash Flow from Operations - Capital Expenditures
GM Adjusted Payback is calculated as: (Previous Q S&M) / (Net New ARR in Q x Gross Margin) x 12 . It shows the number of months it takes for a SaaS business to payback their fully burdened CAC on a gross profit basis. Most public companies don’t report net new ARR, so I’m taking an implied ARR metric (quarterly subscription revenue x 4). Net new ARR is simply the ARR of the current quarter, minus the ARR of the previous quarter. Companies that do not disclose subscription rev have been left out of the analysis and are listed as NA.


Sources used in this post include Bloomberg, Pitchbook and company filings
The information presented in this newsletter is the opinion of the author and does not necessarily reflect the view of any other person or entity, including Altimeter Capital Management, LP ("Altimeter"). The information provided is believed to be from reliable sources but no liability is accepted for any inaccuracies. This is for information purposes and should not be construed as an investment recommendation. Past performance is no guarantee of future performance. Altimeter is an investment adviser registered with the U.S. Securities and Exchange Commission. Registration does not imply a certain level of skill or training. Altimeter and its clients trade in public securities and have made and/or may make investments in or investment decisions relating to the companies referenced herein. The views expressed herein are those of the author and not of Altimeter or its clients, which reserve the right to make investment decisions or engage in trading activity that would be (or could be construed as) consistent and/or inconsistent with the views expressed herein.
This post and the information presented are intended for informational purposes only. The views expressed herein are the author’s alone and do not constitute an offer to sell, or a recommendation to purchase, or a solicitation of an offer to buy, any security, nor a recommendation for any investment product or service. While certain information contained herein has been obtained from sources believed to be reliable, neither the author nor any of his employers or their affiliates have independently verified this information, and its accuracy and completeness cannot be guaranteed. Accordingly, no representation or warranty, express or implied, is made as to, and no reliance should be placed on, the fairness, accuracy, timeliness or completeness of this information. The author and all employers and their affiliated persons assume no liability for this information and no obligation to update the information or analysis contained herein in the future.
Really digging how you broke down ERR vs ARR—super helpful for founders trying to keep their eyes on the real revenue game.