Clouded Judgement 6.9.23 - Recap of Consumption Trends in Q1 '23
Every week I’ll provide updates on the latest trends in cloud software companies. Follow along to stay up to date!
Consumption Trends
We’re now through earning season. Let’s take a look back at the 6 main consumption players in software and how they preformed. Is there any incremental signal on consumption trends reversing? Will we see re-acceleration soon? In general the consumption headwinds started last Q3, and really kicked into gear by Q4.
If I had to summarize my sentiment on consumption software trends it’d be this - headwinds are not intensifying, but they’re also not abating. This suggests that we’re at least getting closer to the bottom (but to be clear we’re still well below pre-headwind consumption levels). Expansion revenue is still declining (we see this in falling net retention rates), but gross retention remains strong. New customer growth seems to be picking up. Coming out of earning season I’m slightly more optimistic about a back half acceleration (August or later) than I was coming in.
The Good
Mongo: Very Positive - Is The Bottom Behind Them?
Very healthy new business (new customer) acquisition. Highest number of new customer additions, and record number of new workloads acquired from existing customers
Consumption in Q1 was ahead of their expectations, but behind where it was before the headwinds started last year
Guide was strong, implying accelerating revenue growth in Q2
Important to call out - Mongo’s consumption trends will be different than Snowflake. Their consumption is driven by usage of applications built on top of Mongo. Usage on Snowflake is driven by queries run on Snowflake
Azure: Neutral Tone With Strength in AI
Overall I’d characterize Azure’s quarter as a net positive. Last quarter their tone was quite negative with respect to macro headwinds, but this quarter they were a lot more measured. They were also more constructive on cloud optimizations bottoming. Some quotes: “what we're seeing now is the new workloads start in addition to highly intense optimization' and the CFO added 'at some point, workloads just can't be optimized much further.”
They’re also seeing some real strength in AI Services. They guided to 26-27% growth in Azure in Q2 (with 1% coming from AI). Fears of a low 20’s guide
Datadog: Some Positive Signs as Trends Don’t Worsen, but Not Getting Better
New logo acquisition picking up, with slightly better growth from existing customer than expected (but still slightly lower trends than Q2 and Q3 last year)
They did call out usage growth better in March than January and Feb. And trends in April were broadly consistent with what they saw in Q1 (so not getting worse)
They did see more weakness in their larger customers and the consumer discretionary vertical (eCommerce and food delivery)
Confluent: Similar Sentiment to Datadog.
Overall similar to Datadog. Another data point that optimization headwinds are not getting worse, but not necessarily getting better yet. They did call out sequential growth in Confluent Cloud every quarter this year which was a big positive
Still seeing elongated deal cycles and less expansion revenue
The Bad
AWS: Headwinds Getting Worse
Their quarter ended in March, but on the earnings call they called out weakening growth in April. They grew 16% in the quarter, but 11% in April
AWS user base is more skewed towards startups and smaller companies
I do think we could start to see accelerating rev growth in August, primarily due to the lapping of tougher comps
Snowflake: Larger Customer Headwinds Intensify
Snowflake actually saw stronger consumption in Feb / March, but then things really slowed down in April
The weakness was primarily driven by larger customers (similar headwind that Datadog saw). This was a reversal from last quarter where Snowflake saw strength in large customers, and weakness in smaller customers. The driver of the weakness was larger customers reducing their data retention policy (ie storing 3 years of data vs 5)
SMB in APJ region was also a weakness
They reduced full year guide to 34% YoY growth (prior guide from last quarter was 40%)
Bright spot was North American Enterprise region, and query growth grew 57% YoY (rev growth was 50%)
Overall, Mongo increased their full year guide, Datadog and Confluent kept there’s essentially constant, and Snowflake reduced their full year guide.
Quarterly Reports Summary
Top 10 EV / NTM Revenue Multiples
Top 10 Weekly Share Price Movement
Update on Multiples
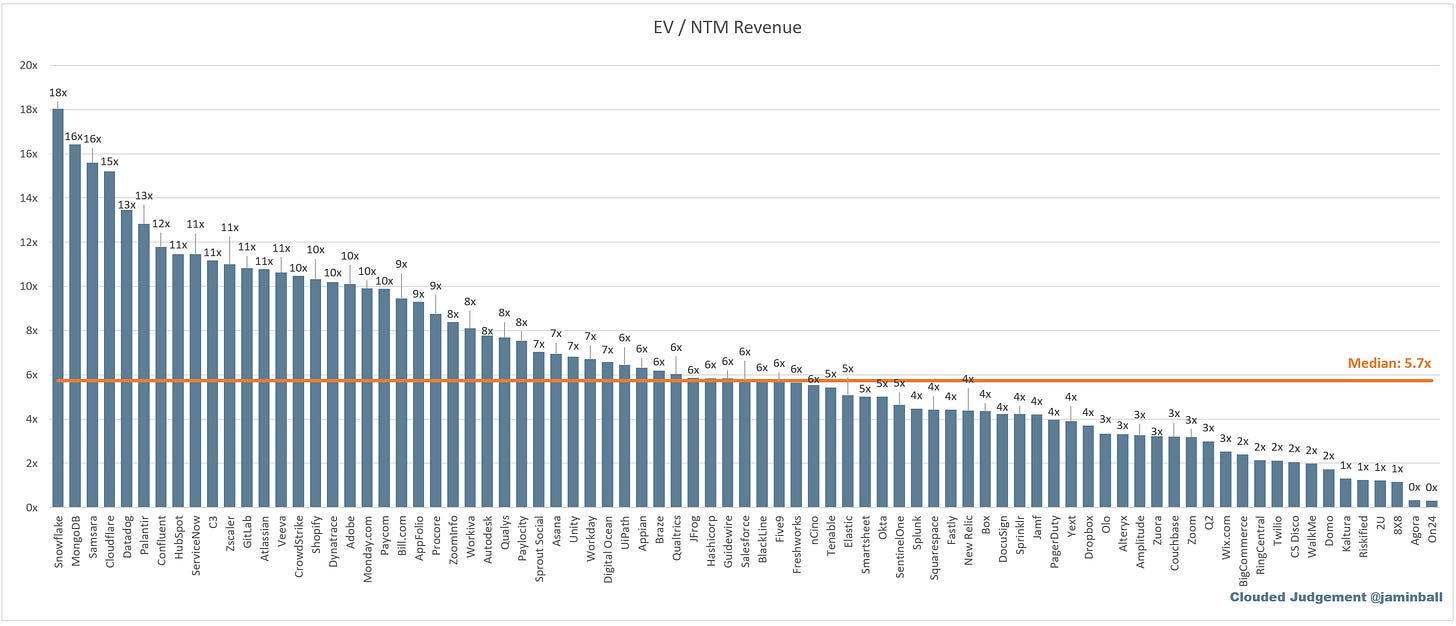
SaaS businesses are generally valued on a multiple of their revenue - in most cases the projected revenue for the next 12 months. Revenue multiples are a shorthand valuation framework. Given most software companies are not profitable, or not generating meaningful FCF, it’s the only metric to compare the entire industry against. Even a DCF is riddled with long term assumptions. The promise of SaaS is that growth in the early years leads to profits in the mature years. Multiples shown below are calculated by taking the Enterprise Value (market cap + debt - cash) / NTM revenue.
Overall Stats:
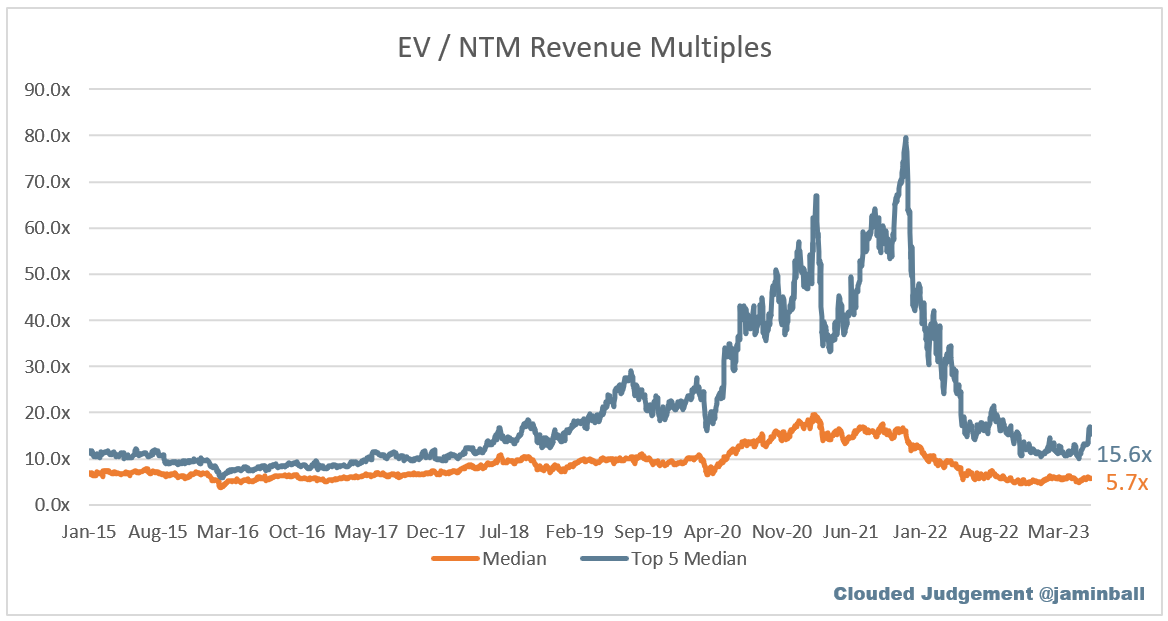
Overall Median: 5.7x
Top 5 Median: 15.6x
10Y: 3.7%
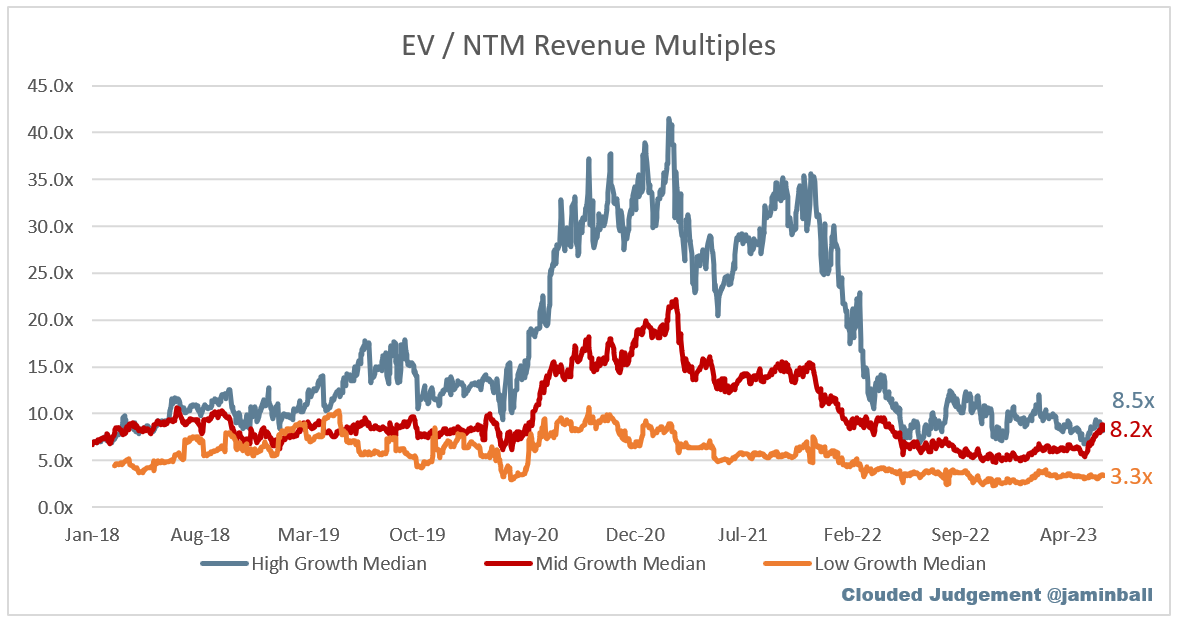
Bucketed by Growth. In the buckets below I consider high growth >30% projected NTM growth, mid growth 15%-30% and low growth <15%
High Growth Median: 8.5x
Mid Growth Median: 8.2x
Low Growth Median: 3.3x
EV / NTM FCF
Companies with negative NTM FCF are not listed on the chart
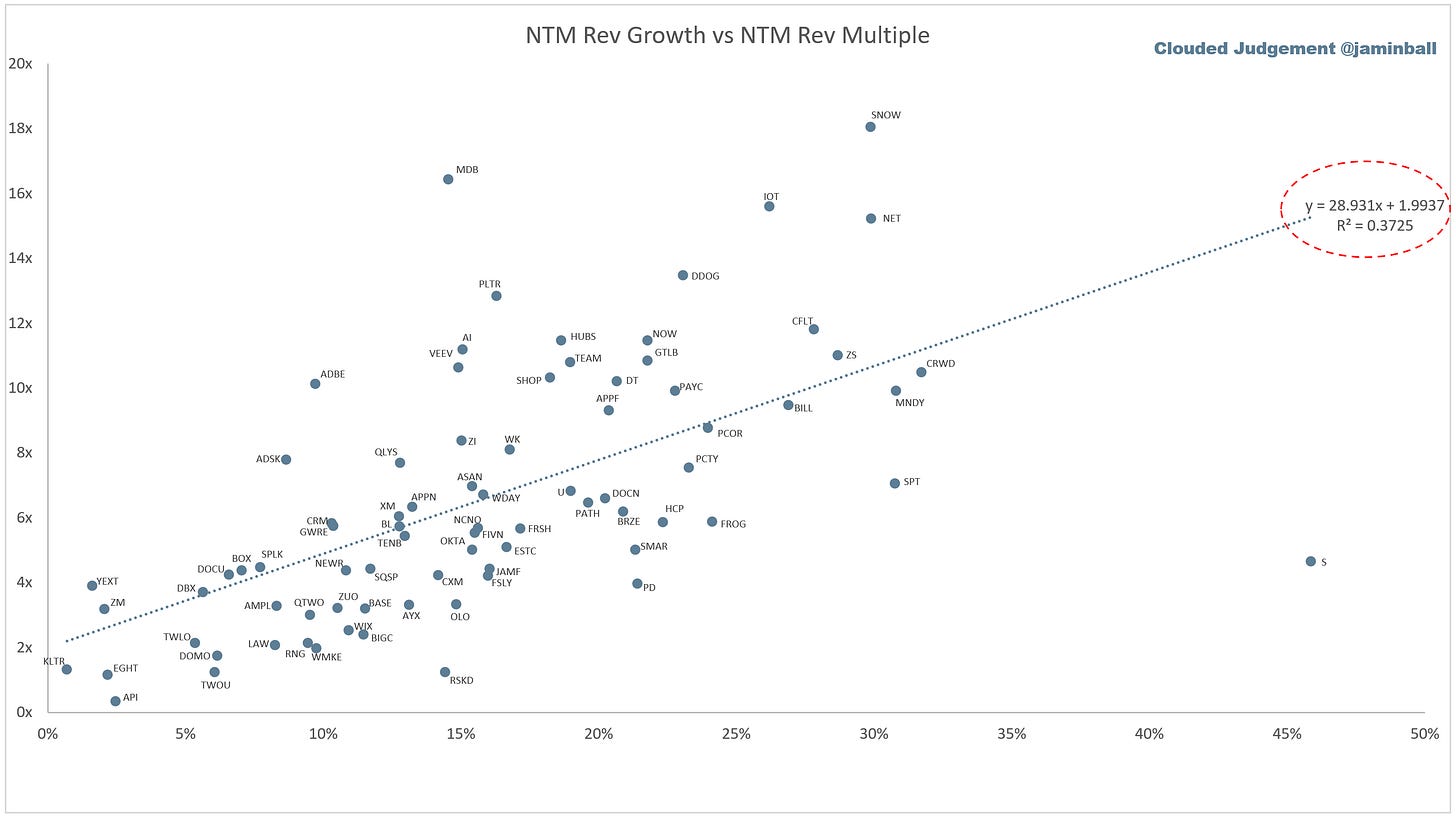
Scatter Plot of EV / NTM Rev Multiple vs NTM Rev Growth
How correlated is growth to valuation multiple?
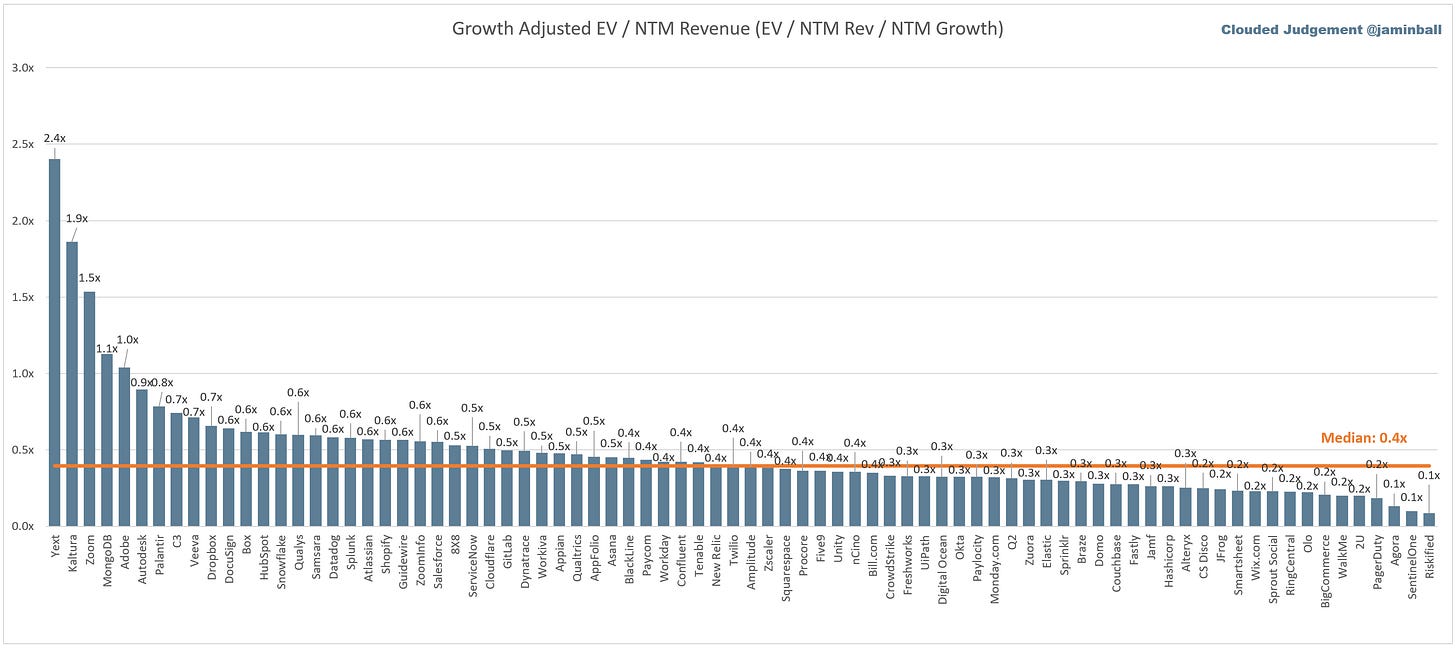
Growth Adjusted EV / NTM Rev
The below chart shows the EV / NTM revenue multiple divided by NTM consensus growth expectations. The goal of this graph is to show how relatively cheap / expensive each stock is relative to their growth expectations
Operating Metrics
Median NTM growth rate: 15%
Median LTM growth rate: 24%
Median Gross Margin: 75%
Median Operating Margin (21%)
Median FCF Margin: 3%
Median Net Retention: 115%
Median CAC Payback: 57 months
Median S&M % Revenue: 46%
Median R&D % Revenue: 27%
Median G&A % Revenue: 18%
Comps Output
Rule of 40 shows rev growth + FCF margin (both LTM and NTM for growth + margins). FCF calculated as Cash Flow from Operations - Capital Expenditures
GM Adjusted Payback is calculated as: (Previous Q S&M) / (Net New ARR in Q x Gross Margin) x 12 . It shows the number of months it takes for a SaaS business to payback their fully burdened CAC on a gross profit basis. Most public companies don’t report net new ARR, so I’m taking an implied ARR metric (quarterly subscription revenue x 4). Net new ARR is simply the ARR of the current quarter, minus the ARR of the previous quarter. Companies that do not disclose subscription rev have been left out of the analysis and are listed as NA.
This post and the information presented are intended for informational purposes only. The views expressed herein are the author’s alone and do not constitute an offer to sell, or a recommendation to purchase, or a solicitation of an offer to buy, any security, nor a recommendation for any investment product or service. While certain information contained herein has been obtained from sources believed to be reliable, neither the author nor any of his employers or their affiliates have independently verified this information, and its accuracy and completeness cannot be guaranteed. Accordingly, no representation or warranty, express or implied, is made as to, and no reliance should be placed on, the fairness, accuracy, timeliness or completeness of this information. The author and all employers and their affiliated persons assume no liability for this information and no obligation to update the information or analysis contained herein in the future.





Regarding Snowflake consumption, you said "[u]sage on Snowflake is driven by queries run on Snowflake" rather than applications. Three things:
1) Snowflake has a nascent but growing applications business and a well defined Native Application Framework. Last fiscal Snowflake announced 971 Powered by Snowflake companies / applications.
2) Snowflake announced hybrid tables last year which is a feature that provides OLTP type tables in the core platform, and as that feature goes GA, I'd expect Snowflake to increase its footprint in operational applications.
3) At the end of the day, applications are two things: 1) compute running the logic and providing a GUI and 2) queries reading/writing to a database. Snowflake demonstrated hosting Streamlit applications natively last year for (1) and (2) is already happening.