


Clouded Judgement 7.11.25 - Market Musings

Every week I’ll provide updates on the latest trends in cloud software companies. Follow along to stay up to date!
Random Market Musings
The last few posts have been more focused on AI developments, so I wanted to take some time this week to give a broader macro update.
It’s hard to believe, but the Nasdaq and the S&P 500 are both sitting at fresh all time highs. They are up ~7% year to date after a WILD ride this year. Remember early April when the Nasdaq was off nearly 20%?? Since then it has ripped ~30%+. The S&P performance has followed the same roller coaster.
It seems like we have climbed a new wall of worry every month. Election drama. Liberation Day. Middle East flare ups with Israel / Iran. Endless hot takes on deficits, growth, jobs, and inflation. Yet the market keeps grinding higher.
Even the nerd fight over AI scaling has calmed down for the moment. I still think there is a mountain of compute demand waiting to show up, but for now the debate is quiet. Look no further than the Grok 4 release from this week for another data point on scaling laws continuing to hold…
So what could derail this move?
Rates have crept higher the last couple of weeks. Here is why:
Inflation chatter is loud again. Traders expect next Tuesday core CPI to print about 0.3% month on month, the hottest since January. Copper popped after the White House floated a fifty percent tariff which added to the noise.
Fed minutes sounded cautious. Several governors want more proof that tariff related price pressure is fading, so the first rate reduction has slipped from July to the fall.
The labor market refuses to break. Jobless claims just hit a seven week low and wages are still running a bit above 4%. Cooling, yes, but not enough for the Fed to panic.
The good news: the 10Y Treasury yield is up only about fifteen basis points from late June and is still well below the peak from January. This wall of worry feels smaller than the ones we already cleared.
What could keep the party going?
Earnings season starts next week. I don’t really see a reason why guidance would be weak? AI powered margin improvement stories are also everywhere. Decent prints could add fuel.
The Fed is neutral right now. One softer CPI print and a cut in September is back on the table.
Positioning is light. Equity inflows are modest and the VIX sits in the mid teens. There is cash on the sidelines.
AI is a structural tailwind. Every call will feature a story about automation boosting productivity or opening new revenue.
Bottom line: We started the year with a long list of worries and knocked them off one by one. Indexes are at highs but nobody feels euphoric (maybe it does and I just don’t feel it). If inflation does not rerun the story from two years ago and earnings cooperate, the setup seems really constructive (in my opinion). That is my two cents. Maybe we’ll look back on this post as the top :)
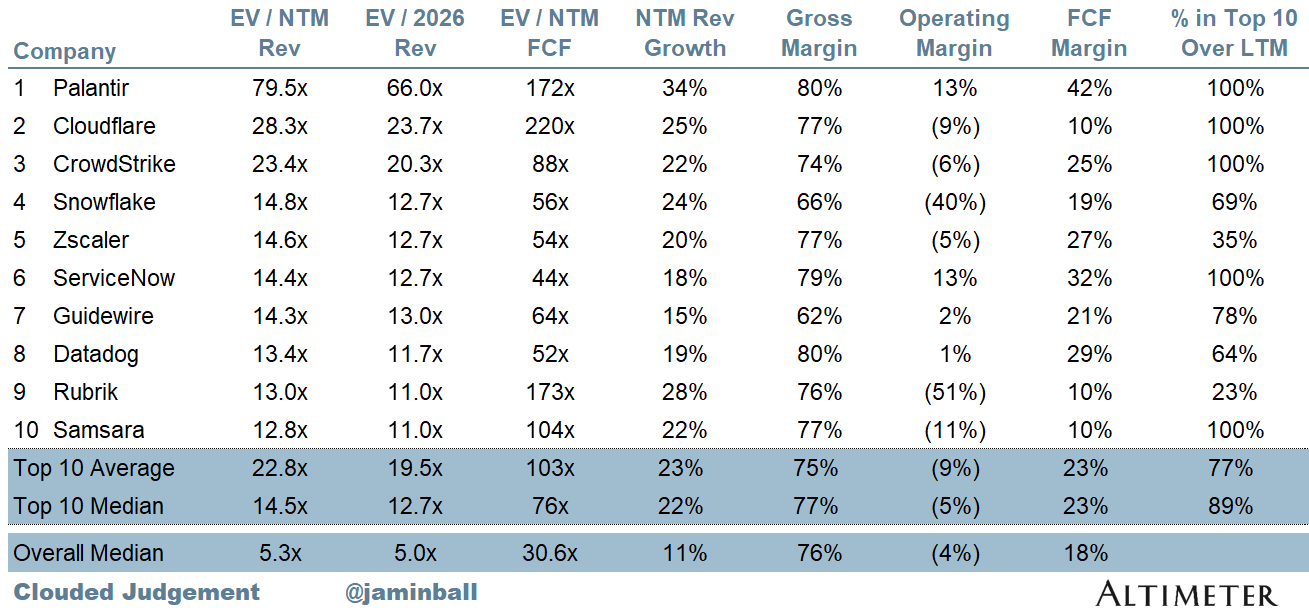
Top 10 EV / NTM Revenue Multiples
Top 10 Weekly Share Price Movement

Update on Multiples
SaaS businesses are generally valued on a multiple of their revenue - in most cases the projected revenue for the next 12 months. Revenue multiples are a shorthand valuation framework. Given most software companies are not profitable, or not generating meaningful FCF, it’s the only metric to compare the entire industry against. Even a DCF is riddled with long term assumptions. The promise of SaaS is that growth in the early years leads to profits in the mature years. Multiples shown below are calculated by taking the Enterprise Value (market cap + debt - cash) / NTM revenue.
Overall Stats:
Overall Median: 5.3x
Top 5 Median: 23.4x
10Y: 4.4%


Bucketed by Growth. In the buckets below I consider high growth >25% projected NTM growth, mid growth 15%-25% and low growth <15%
High Growth Median: 20.6x
Mid Growth Median: 8.8x
Low Growth Median: 4.1x


EV / NTM Rev / NTM Growth
The below chart shows the EV / NTM revenue multiple divided by NTM consensus growth expectations. So a company trading at 20x NTM revenue that is projected to grow 100% would be trading at 0.2x. The goal of this graph is to show how relatively cheap / expensive each stock is relative to its growth expectations.


EV / NTM FCF
The line chart shows the median of all companies with a FCF multiple >0x and <100x. I created this subset to show companies where FCF is a relevant valuation metric.

Companies with negative NTM FCF are not listed on the chart

Scatter Plot of EV / NTM Rev Multiple vs NTM Rev Growth
How correlated is growth to valuation multiple?

Operating Metrics
Median NTM growth rate: 11%
Median LTM growth rate: 14%
Median Gross Margin: 76%
Median Operating Margin (4%)
Median FCF Margin: 18%
Median Net Retention: 108%
Median CAC Payback: 72 months
Median S&M % Revenue: 38%
Median R&D % Revenue: 24%
Median G&A % Revenue: 16%
Comps Output
Rule of 40 shows rev growth + FCF margin (both LTM and NTM for growth + margins). FCF calculated as Cash Flow from Operations - Capital Expenditures
GM Adjusted Payback is calculated as: (Previous Q S&M) / (Net New ARR in Q x Gross Margin) x 12. It shows the number of months it takes for a SaaS business to pay back its fully burdened CAC on a gross profit basis. Most public companies don’t report net new ARR, so I’m taking an implied ARR metric (quarterly subscription revenue x 4). Net new ARR is simply the ARR of the current quarter, minus the ARR of the previous quarter. Companies that do not disclose subscription rev have been left out of the analysis and are listed as NA.


Sources used in this post include Bloomberg, Pitchbook and company filings
The information presented in this newsletter is the opinion of the author and does not necessarily reflect the view of any other person or entity, including Altimeter Capital Management, LP ("Altimeter"). The information provided is believed to be from reliable sources but no liability is accepted for any inaccuracies. This is for information purposes and should not be construed as an investment recommendation. Past performance is no guarantee of future performance. Altimeter is an investment adviser registered with the U.S. Securities and Exchange Commission. Registration does not imply a certain level of skill or training. Altimeter and its clients trade in public securities and have made and/or may make investments in or investment decisions relating to the companies referenced herein. The views expressed herein are those of the author and not of Altimeter or its clients, which reserve the right to make investment decisions or engage in trading activity that would be (or could be construed as) consistent and/or inconsistent with the views expressed herein.
This post and the information presented are intended for informational purposes only. The views expressed herein are the author’s alone and do not constitute an offer to sell, or a recommendation to purchase, or a solicitation of an offer to buy, any security, nor a recommendation for any investment product or service. While certain information contained herein has been obtained from sources believed to be reliable, neither the author nor any of his employers or their affiliates have independently verified this information, and its accuracy and completeness cannot be guaranteed. Accordingly, no representation or warranty, express or implied, is made as to, and no reliance should be placed on, the fairness, accuracy, timeliness or completeness of this information. The author and all employers and their affiliated persons assume no liability for this information and no obligation to update the information or analysis contained herein in the future.