Clouded Judgement 7.1.22
Every week I’ll provide updates on the latest trends in cloud software companies. Follow along to stay up to date!
When “Overearning” Ends
There’s been a lot of talk lately about earnings revisions. In the most simple terms, earnings revisions means companies revise down their forward estimates given a change in outlook. Currently, the risk is that a recession leads to negative earnings revisions. While this is definitely a risk, the bigger risk to businesses is if companies who “overlearned” over the last 18 months revert to the mean.
What does this mean? There are many different trendlines that exist for different businesses or industries. These trendlines could be something like eCommerce penetration, or something more financial like the overall profit margins for the retail sector. Over 2020 and 2021 a lot of these trendlines broke significantly from historical norms. Take eCommerce penetration. Generally every year a certain % of retail spend moved from offline to online. And this trend was fairly linear. During Covid, that trendline spiked dramatically! What does this mean? Demand for eCommerce products spiked despite no change in eCommerce businesses marketing or promotions. People simply wanted to buy more goods online. From a business standpoint it meant that topline (revenue) started scaling much faster than OpEx. Roll all of this up and you have a business vastly outperforming on revenue expectations, while simultaneously expanding margins significantly. For the most part, these companies then started to scale OpEx to meet the wall of demand. What’s happening now? Many trendlines (like eCommerce penetration) are starting to revert back to their historical trendline. Unfortunately, businesses now are being hit with a double whammy - demand is slowing so topline growth is missing expectations. At the same time OpEx scaled in preparation for continued strong demand. When demand slows OpEx starts going up while revenue comes down. This leads to compressing margins, and revenue revisions downward. Both at the same time is a dangerous combo…
Unfortunately there are many industries where it’s becoming apparent they “over earned” in 2020 / 2021. And the mean reversion is painful. Retail businesses feel this as inventory starts accumulating in warehouses with no consumer demand to purchase.
In general I think most modern cloud software is “safe” from this. There is a risk digital transformations accelerated cloud software adoption over the last 2 years, and then a recession slows demand (as companies ramped OpEx to meet the previously scaling demand), but I think these risks are overblown. Maybe the exceptions are the obvious “Covid winners” who experienced massive pull forward. But even still, my base case is digital transformations don’t slow down in a recession. If anything, I think they’re more likely to accelerate than slow down. Companies will be under even more pressure to drive efficiencies and cut costs, and fortunately most modern cloud software does exactly that (especially compared to the legacy solutions they’re replacing)
Top 10 EV / NTM Revenue Multiples
Top 10 Weekly Share Price Movement
Update on Multiples
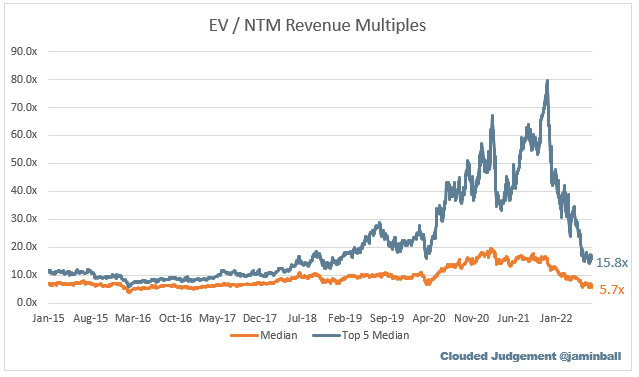
SaaS businesses are valued on a multiple of their revenue - in most cases the projected revenue for the next 12 months. Multiples shown below are calculated by taking the Enterprise Value (market cap + debt - cash) / NTM revenue.
Overall Stats:
Overall Median: 5.7x
Top 5 Median: 15.8x
10Y: 3.0%
Bucketed by Growth. In the buckets below I consider high growth >30% projected NTM growth, mid growth 15%-30% and low growth <15%
High Growth Median: 7.9x
Mid Growth Median: 5.9x
Low Growth Median: 3.6x
Scatter Plot of EV / NTM Rev Multiple vs NTM Rev Growth
How correlated is growth to valuation multiple?
Growth Adjusted EV / NTM Rev
The below chart shows the EV / NTM revenue multiple divided by NTM consensus growth expectations. The goal of this graph is to show how relatively cheap / expensive each stock is relative to their growth expectations
Operating Metrics
Median NTM growth rate: 24%
Median LTM growth rate: 32%
Median Gross Margin: 74%
Median Operating Margin (25%)
Median FCF Margin: 3%
Median Net Retention: 120%
Median CAC Payback: 34 months
Median S&M % Revenue: 46%
Median R&D % Revenue: 27%
Median G&A % Revenue: 20%
Comps Output
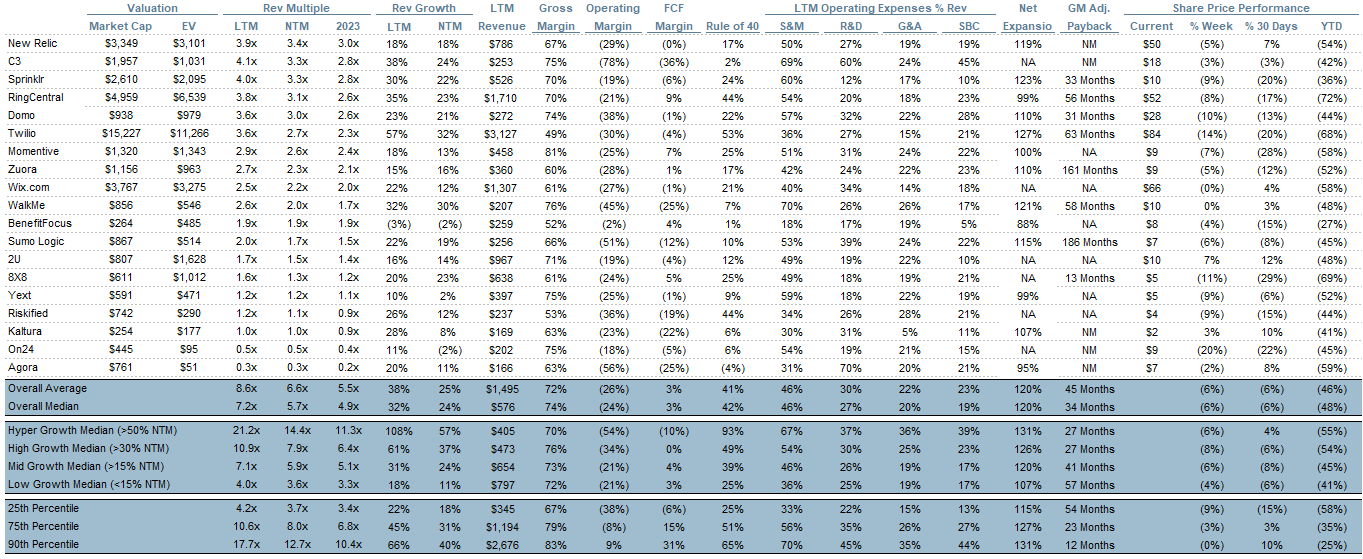
Rule of 40 shows LTM growth rate + LTM FCF Margin. FCF calculated as Cash Flow from Operations - Capital Expenditures
GM Adjusted Payback is calculated as: (Previous Q S&M) / (Net New ARR in Q x Gross Margin) x 12 . It shows the number of months it takes for a SaaS business to payback their fully burdened CAC on a gross profit basis. Most public companies don’t report net new ARR, so I’m taking an implied ARR metric (quarterly subscription revenue x 4). Net new ARR is simply the ARR of the current quarter, minus the ARR of the previous quarter. Companies that do not disclose subscription rev have been left out of the analysis and are listed as NA.
This post and the information presented are intended for informational purposes only. The views expressed herein are the author’s alone and do not constitute an offer to sell, or a recommendation to purchase, or a solicitation of an offer to buy, any security, nor a recommendation for any investment product or service. While certain information contained herein has been obtained from sources believed to be reliable, neither the author nor any of his employers or their affiliates have independently verified this information, and its accuracy and completeness cannot be guaranteed. Accordingly, no representation or warranty, express or implied, is made as to, and no reliance should be placed on, the fairness, accuracy, timeliness or completeness of this information. The author and all employers and their affiliated persons assume no liability for this information and no obligation to update the information or analysis contained herein in the future.


