Clouded Judgement 7.14.23 - Metrics Required to IPO (IPO Window Opening?)
Every week I’ll provide updates on the latest trends in cloud software companies. Follow along to stay up to date!
Inflation Update
The week we got the June CPI (ie inflation) data. Here’s where things shock out:
Headline Inflation: 3.0% YoY (3.1% consensus) and 0.2% MoM (0.3% consensus)
Core Inflation: 4.8% YoY (5.0% consensus) and 0.2% MoM (0.3% consensus)
Overall, inflation came in lighter than expected. This was a positive data point that adds more credibility to a potential soft landing. If inflation continues to cool like this we’ll be at the Fed’s 2% target before long. Further, real rates (rates less inflation) start becoming increasingly restrictive as inflation falls. The Fed has been very clear they plan to keep rates higher for longer, but at a certain point maintaining ~3%+ real rates starts to become a bit unnecessary. The faster inflation falls, the faster we may see rate cuts. So far the economy seems to be holding on (while some leading indicators don’t look great), labor market is strong, and inflation is cooling. The right ingredients!
Software IPO Backlog
We haven’t seen a software IPO since the end of 2021, which gets us to 18 months and counting since our last software IPO. This is quite the IPO drought! To put the 18 months in perspective, the last coupe software IPO “droughts” each lasted ~6 months.
First we had the Covid drought at the start of 2020. Bill.com went public in December 2019, and the next software IPO was ZoomInfo in June 2020
In late 2018 / early 2019 we had about a 6 month window of no software IPOs (this was around the China trade war fears). PagerDuty / Zoom opened up the IPO window in the Spring of 2019.
The first half of 2016 also gave us a ~6 month software IPO drought. In late 2015 the Fed rose interest rates for the first time since the financial crisis, and 2016 was an election year (where Trump was elected). Both of these factors created uncertainty in the markets, causing the drought. After no IPOs to start the year Twilio ended up opening the software IPO market in the summer of 2016.
All of these droughts were ~6 months. Given we’re currently at ~18 months, we’re in a severe drought! In 2021 we had ~16 software IPOs. In 2020 we had ~10 software IPOs (with a 6 month window of no IPOs during the start of the year). 2019 saw ~15 and 2018 ~17 (these are all rough figures for US based IPOs). The point I’m trying to make is that in normal times we would have had close to 25 companies go public during this current drought. All of these companies need to go public at some point. The question is, what volume of new equity issuance can the market absorb all at once? There may be a mad dash to go public before this happens.
I went back and looked at the last ~6 years of data on software IPOs to answer the question “what does it take to go public?” I looked at 3 key metrics: LTM Revenue, Revenue Growth and LTM FCF Margins. Here are the median stats for a set of ~50 software IPOs from 2018 to today. This can also act as a guide for younger startups who have ambitions to go public one day (these should be your goals).
Median LTM Revenue: $198M
Median Quarterly YoY Growth Rate: 49% (this is the revenue in the most recent quarter before IPO compared to the quarterly revenue 1 year prior)
Median Net New ARR added in IPO Quarter: $22M
Median FCF Margin: (11%)
And below are the charts for each. My guess is there are quite a few private companies who have IPO scale (ie >$200m LTM revenue).
Top 10 EV / NTM Revenue Multiples
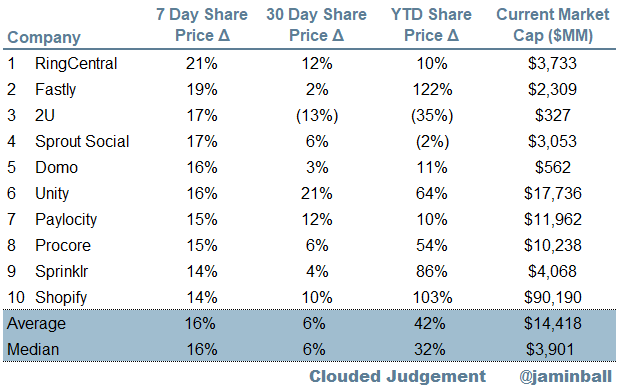
Top 10 Weekly Share Price Movement
Update on Multiples
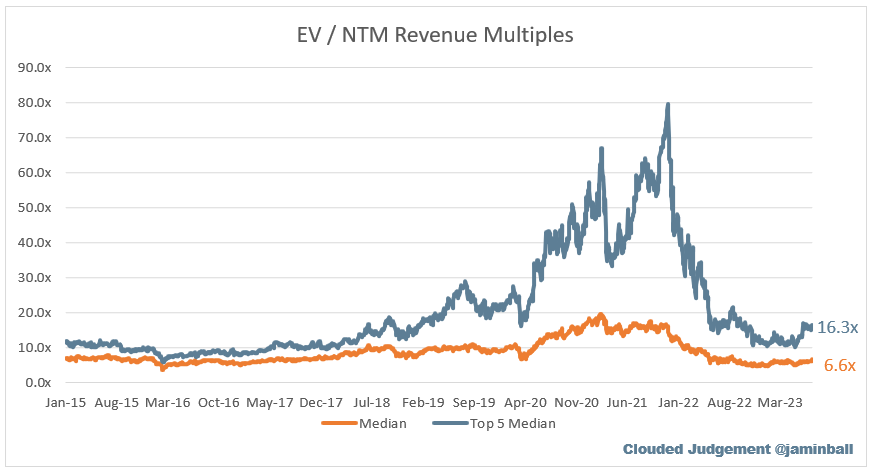
SaaS businesses are generally valued on a multiple of their revenue - in most cases the projected revenue for the next 12 months. Revenue multiples are a shorthand valuation framework. Given most software companies are not profitable, or not generating meaningful FCF, it’s the only metric to compare the entire industry against. Even a DCF is riddled with long term assumptions. The promise of SaaS is that growth in the early years leads to profits in the mature years. Multiples shown below are calculated by taking the Enterprise Value (market cap + debt - cash) / NTM revenue.
Overall Stats:
Overall Median: 6.6x
Top 5 Median: 14.2x
10Y: 3.3%
Bucketed by Growth. In the buckets below I consider high growth >30% projected NTM growth, mid growth 15%-30% and low growth <15%
High Growth Median: 10.3x
Mid Growth Median: 9.6x
Low Growth Median: 3.5x
EV / NTM Rev / NTM Growth
The below chart shows the EV / NTM revenue multiple divided by NTM consensus growth expectations. So a company trading at 20x NTM revenue that is projected to grow 100% would be trading at 0.2x. The goal of this graph is to show how relatively cheap / expensive each stock is relative to their growth expectations
EV / NTM FCF
Companies with negative NTM FCF are not listed on the chart
Scatter Plot of EV / NTM Rev Multiple vs NTM Rev Growth
How correlated is growth to valuation multiple?
Operating Metrics
Median NTM growth rate: 15%
Median LTM growth rate: 24%
Median Gross Margin: 75%
Median Operating Margin (20%)
Median FCF Margin: 5%
Median Net Retention: 115%
Median CAC Payback: 57 months
Median S&M % Revenue: 46%
Median R&D % Revenue: 27%
Median G&A % Revenue: 18%
Comps Output
Rule of 40 shows rev growth + FCF margin (both LTM and NTM for growth + margins). FCF calculated as Cash Flow from Operations - Capital Expenditures
GM Adjusted Payback is calculated as: (Previous Q S&M) / (Net New ARR in Q x Gross Margin) x 12 . It shows the number of months it takes for a SaaS business to payback their fully burdened CAC on a gross profit basis. Most public companies don’t report net new ARR, so I’m taking an implied ARR metric (quarterly subscription revenue x 4). Net new ARR is simply the ARR of the current quarter, minus the ARR of the previous quarter. Companies that do not disclose subscription rev have been left out of the analysis and are listed as NA.
This post and the information presented are intended for informational purposes only. The views expressed herein are the author’s alone and do not constitute an offer to sell, or a recommendation to purchase, or a solicitation of an offer to buy, any security, nor a recommendation for any investment product or service. While certain information contained herein has been obtained from sources believed to be reliable, neither the author nor any of his employers or their affiliates have independently verified this information, and its accuracy and completeness cannot be guaranteed. Accordingly, no representation or warranty, express or implied, is made as to, and no reliance should be placed on, the fairness, accuracy, timeliness or completeness of this information. The author and all employers and their affiliated persons assume no liability for this information and no obligation to update the information or analysis contained herein in the future.


These statistics offer valuable insights into the IPO trends in the software industry over recent years.
The median revenue, YoY growth rate, ARR addition, and FCF margin present a sort of roadmap for startups aiming to go public, demonstrating the typical financial health and growth rate of successful software IPOs.
Looking at these stats, a few key points spring to mind:
Revenue Strength: The median LTM revenue figure indicates the substantial revenue base that these companies have managed to build before going public. It's a testament to their business models' efficacy, their value propositions, and their market reach.
Growth Trajectory: The high median quarterly YoY growth rate reveals a healthy and robust expansion pace. This growth can be attributed to product innovation, market penetration, or even exploring new markets.
ARR Addition: The median net new ARR added underscores these companies' ability to secure recurring revenue, a critical factor for software companies and particularly attractive to investors.
FCF Margin: The negative median FCF margin is not unusual for high-growth tech companies that are investing heavily in growth and scaling up their operations.
The evolution of the software industry, reflected in these stats, aligns with the visionary philosophy of Steve Jobs, who believed in pushing boundaries and disrupting markets.
Similarly, the data-intensive nature of this analysis mirrors my own inclination as a data engineer, always seeking to derive meaningful insights from raw numbers.
Focusing on this snippet:
> I went back and looked at the last ~6 years of data on software IPOs to answer the question “what does it take to go public?” I looked at 3 key metrics: LTM Revenue, Revenue Growth and LTM FCF Margins. Here are the median stats for a set of ~50 software IPOs from 2018 to today. This can also act as a guide for younger startups who have ambitions to go public one day (these should be your goals).
> Median LTM Revenue: $198M
> Median Quarterly YoY Growth Rate: 49% (this is the revenue in the most recent quarter before IPO compared to the quarterly revenue 1 year prior)
> Median Net New ARR added in IPO Quarter: $22M
> Median FCF Margin: (11%)
Someone asked me this a month ago, and my gut instinct was a profitable company with 100M ARR and good fundamental unit economics. It's funny now I was wrong on 2/3 of these points.
However, @jamin, I wonder this: if you looked at the *last 6 years* of IPOs, isn't that during a period when the public markets preferred growth over profitability? Would the answer look different now (namely, a positive FCF margin?)
As always, great post :)