Clouded Judgement 7.15.22
Every week I’ll provide updates on the latest trends in cloud software companies. Follow along to stay up to date!
Earnings Revisions - What Might They Look Like?
I’ve talked about it before, but the current big “risk” to software companies is earnings revisions (which haven’t happened yet). Many might disagree, but I think there’s an investible framework for where the 10Y will end up by end of year. My current view is it settles ~3.5% +/-, and won’t need to go much higher. Again, many people will disagree with me on this point :)
While rates will always be the biggest “risk,” the other big risk is earnings revisions - what happens if we hit a recession, budgets get frozen, sales cycles elongate, extra scrutiny around new spend, etc. In this scenario current revenue estimates for 2023 are too high, and should get revised down (again, this hasn’t happened yet). I’ve written about this before, but I think we are headed to earnings revisions and that will generate downward pressure on stocks. At the same time, I think many software companies will prove to be more resilient and won’t slow as much as earnings revisions initially predict. One very recent example we can turn to is Datadog in 2020. What happened at the start of Covid was very different than what we may see in an upcoming recession. The world was quite literally falling apart, businesses were shutting down, unemployment skyrocketed, and almost every business did what they could to ensure survival. This generally meant widespread and immediate budget freezes and smaller budgets. Do I think we get something as extreme coming up? No, but we could get a flavor of it.
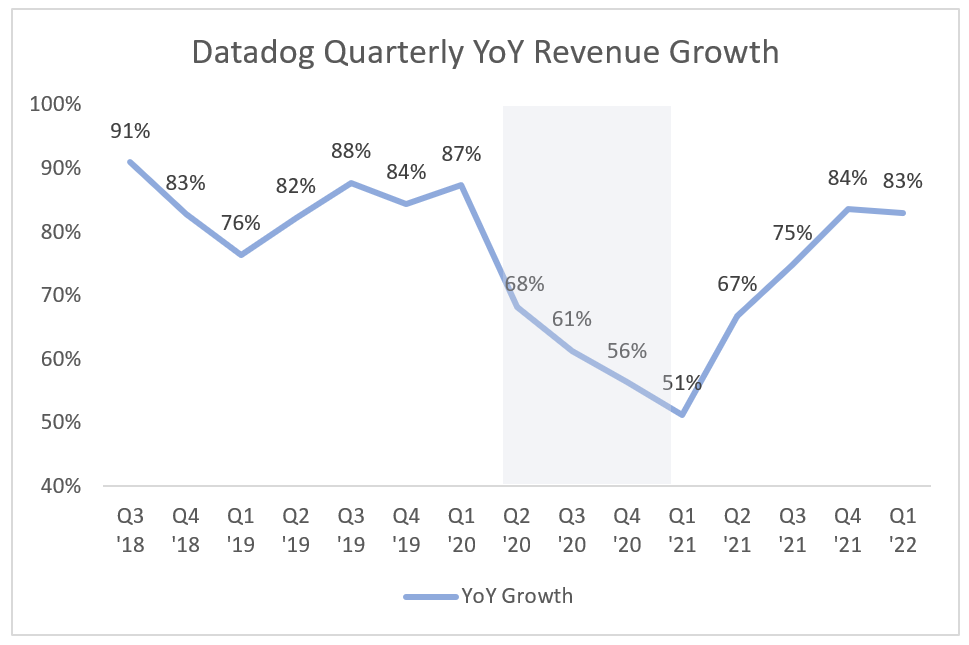
People might not remember, but Datadog’s growth really slowed quite quickly at the onset of Covid. We got a taste for what may happen in an extreme example of budget freezes / procurement slow downs. Towards the end of 2020 the narrative around Datadog was “observability is a crowded market, too many players, maybe Datadog isn’t that special after all.” The chart below shows their quarterly YoY growth. The shaded area was the start of Covid and the effect it had on their revenue growth
Again, I don’t think we’ll see something as sharp and extreme as what happened in 2020 with Covid (in terms of an immediate response). But in a down market / recession I think it’s inevitable we’ll get a flavor of it which means growth should slow some (and the range for how much growth will slow depends on the quality / end market for each software company). I’m using Datadog as an example here because I’ve long thought of them as one of the best cloud software companies. Growth, sales efficiency, FCF margins, market leadership position and TAM are all best in class for Datadog. And despite this, they still saw a slowdown. The point being - no one is truly immune to a market slowdown. Yes, digital transformations are still going on. And yes, cloud software is a way to drive efficiency and cut costs. However, in the immediate aftermath of a recession, it feels inevitable these projects will be put on pause, or at least slowed while all companies get their bearings and understand the depth of what’s to come. In that window, I think everyone will be effected. If I had to guess (and it’s really anyone’s guess at this point) of what an upcoming recession would look like I’d say it wouldn’t nearly be as sharp of a decline initially, but will last much longer
For best in class software, maybe a slowdown just means 2023 figures are reiterated for the next couple quarters and not raised. Generally, 2023 estimates would go up every quarter (beat and raise model), so simply reiterating 2023 is somewhat of a “miss.” It’s hard to know. But again, at a minimum I think we’ll see a quarter or two of lower than expected results. And this will result in revisions. The big question - has that already been priced in? Hard to say. We’ve seen companies in other industries lower guidance to little effect in their stock (ie it was priced in). Hard to say for software. I think an element of it has been priced in, but not fully yet. Below is a chart that shows the change in 2023 consensus revenue estimates for a basket of software companies from January to today. A positive percentage means the estimates have gone up. So for nCino, the 2023 revenue estimates today are 23% higher than where they were in January. As you can see, the median revision is positive 2.3%. To me, this implies we haven’t seen earnings revisions yet. You can definitely argue that in a “normal” world a beat-and-raise model like software should be up more than 2.3% after 2 quarters. And this is valid, and consistent with what we’ve seen - strong quarters with weaker guidance. So the outlook isn’t changing much. If / when we start to see misses, then estimates will come down. If we run a similar analysis for internet companies, the median 2023 estimate change is roughly negative 10% (meaning we have seen revisions in internet).
I know this post comes off more bearish than most of my writing. The big unknown is the magnitude of the revisions. For the best businesses, I don’t think we’ll see very big revisions, but there is a trickle down effect from a recession that will undoubtedly hit software in some capacity. A balancing factor is we probably see margins improve as companies cut costs (and I think the magnitude of cost cuts will be greater than the magnitude of negative revisions). Hard to say what the net impact to stocks will be, but generally when numbers come down stocks come down.
Top 10 EV / NTM Revenue Multiples
Top 10 Weekly Share Price Movement
Update on Multiples
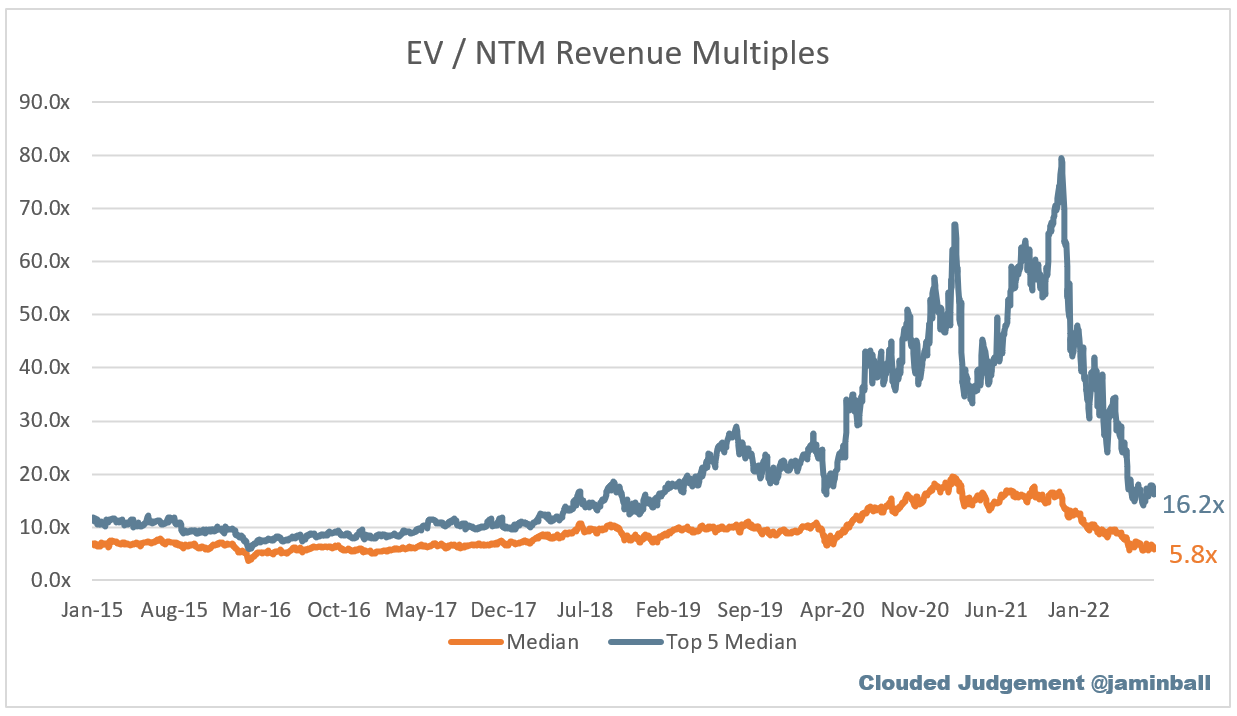
SaaS businesses are valued on a multiple of their revenue - in most cases the projected revenue for the next 12 months. Multiples shown below are calculated by taking the Enterprise Value (market cap + debt - cash) / NTM revenue.
Overall Stats:
Overall Median: 5.8x
Top 5 Median: 16.2x
10Y: 3.0%
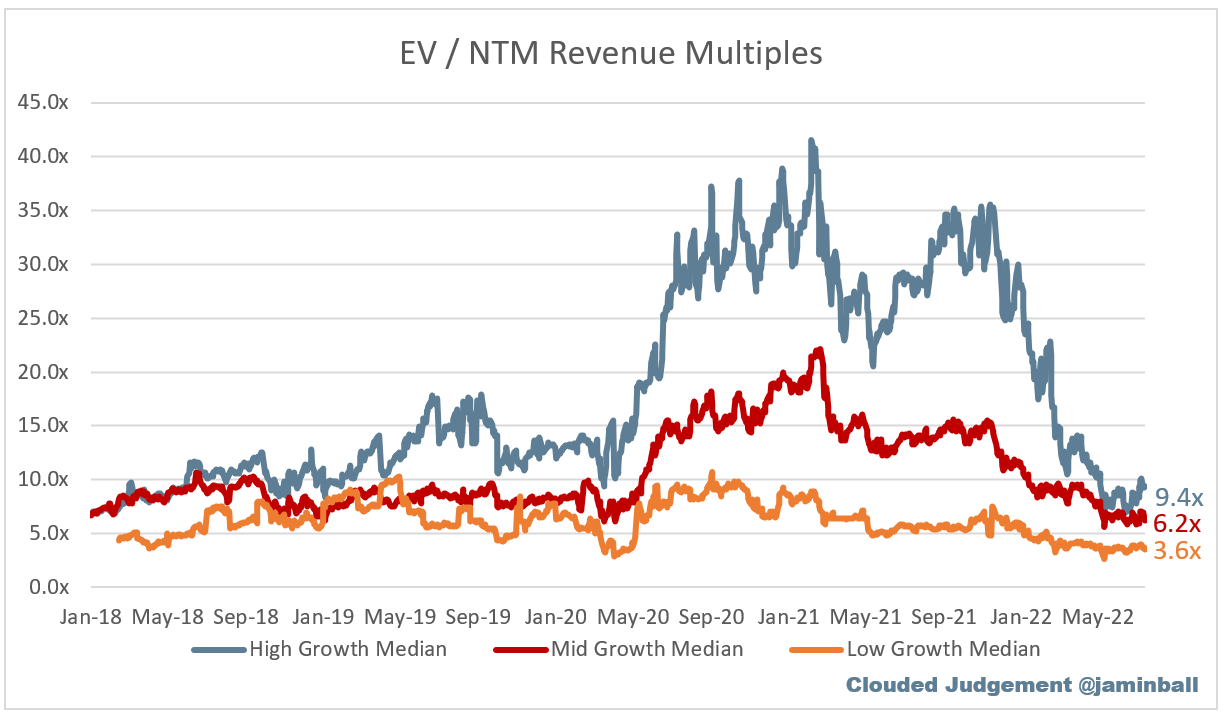
Bucketed by Growth. In the buckets below I consider high growth >30% projected NTM growth, mid growth 15%-30% and low growth <15%
High Growth Median: 9.4x
Mid Growth Median: 6.2x
Low Growth Median: 3.6x
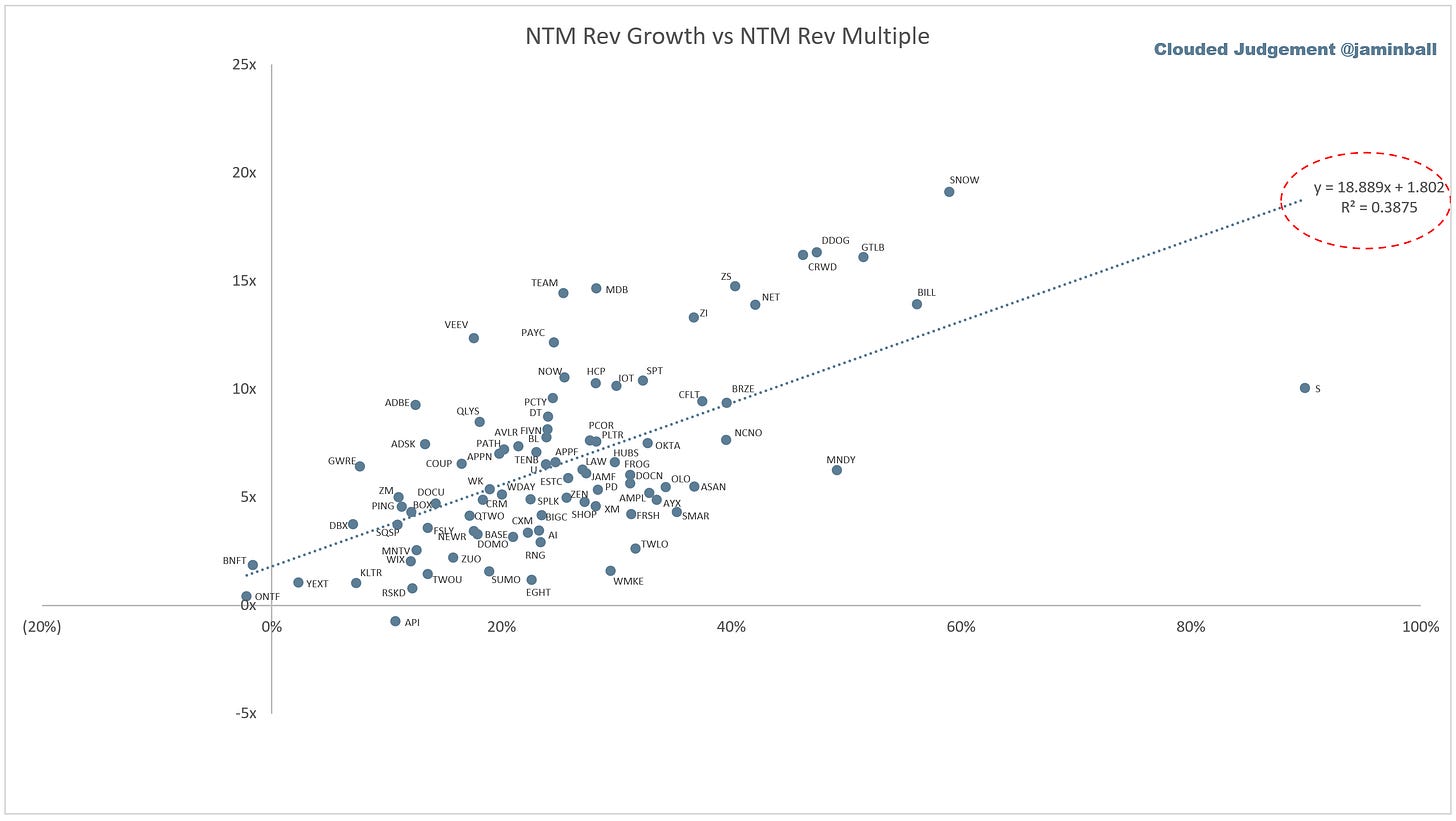
Scatter Plot of EV / NTM Rev Multiple vs NTM Rev Growth
How correlated is growth to valuation multiple?
Growth Adjusted EV / NTM Rev
The below chart shows the EV / NTM revenue multiple divided by NTM consensus growth expectations. The goal of this graph is to show how relatively cheap / expensive each stock is relative to their growth expectations
Operating Metrics
Median NTM growth rate: 24%
Median LTM growth rate: 32%
Median Gross Margin: 74%
Median Operating Margin (25%)
Median FCF Margin: 3%
Median Net Retention: 120%
Median CAC Payback: 34 months
Median S&M % Revenue: 46%
Median R&D % Revenue: 27%
Median G&A % Revenue: 20%
Comps Output
Rule of 40 shows LTM growth rate + LTM FCF Margin. FCF calculated as Cash Flow from Operations - Capital Expenditures
GM Adjusted Payback is calculated as: (Previous Q S&M) / (Net New ARR in Q x Gross Margin) x 12 . It shows the number of months it takes for a SaaS business to payback their fully burdened CAC on a gross profit basis. Most public companies don’t report net new ARR, so I’m taking an implied ARR metric (quarterly subscription revenue x 4). Net new ARR is simply the ARR of the current quarter, minus the ARR of the previous quarter. Companies that do not disclose subscription rev have been left out of the analysis and are listed as NA.
This post and the information presented are intended for informational purposes only. The views expressed herein are the author’s alone and do not constitute an offer to sell, or a recommendation to purchase, or a solicitation of an offer to buy, any security, nor a recommendation for any investment product or service. While certain information contained herein has been obtained from sources believed to be reliable, neither the author nor any of his employers or their affiliates have independently verified this information, and its accuracy and completeness cannot be guaranteed. Accordingly, no representation or warranty, express or implied, is made as to, and no reliance should be placed on, the fairness, accuracy, timeliness or completeness of this information. The author and all employers and their affiliated persons assume no liability for this information and no obligation to update the information or analysis contained herein in the future.


Jamin - I am curious as to the best matric at our disposal today that we can use to estimate when will negative FCFs turn into positive. Is there anything within your table that you can point to? I love investing in DDOG and on board w/you 100%, but they're waaay beyond the inflection point on FCF and I don't want to pay 15x NTM revs. nCino is also a fast grower, gets a lower multiple (I get way) and has negative FCF which MAY turn positive. Is there a way to get my hands around this "MAY" from looking at your table? Analyst reports that I have access to do not cover nCino :(. Thank you.
Just curious, why do you think Twilio is so undervalued compared to its peers? It is much more established and much better off financially (IMO) than most other companies on this list. Anyone have any idea?