Clouded Judgement - 7.17.20
For the first time in a number of weeks, SaaS multiples did not hit another all-time high, and in fact came down. Read more about the SaaS pullback from this week below!
Highlight of the Week - nCino IPO
nCino priced their IPO at $31 / share on Monday raising $250M (they upsized the offering to 8.065M shares) and giving them an initial market cap of ~$3B. The stock then opened at $71 (129% pop), and traded up to $82 giving it a market cap of ~$7.6B. It is now trading at $71 giving it a market cap of $6.9B and an implied forward revenue multiple of ~32x (assuming 35% forward growth). Even though the limited float (something I talk about here) plays into these huge pops, the process of having people set IPO prices, then markets set trading prices is creating a huge disconnect.
Some highlights of the IPO process itself:
It was ~50x oversubscribed (the total demand from institutional investors’ orders was 50x greater than what was being offered by the company)
97% of institutional investors who had a 1:1 meeting as part of the roadshow put in an offer
This level of over-subscription, and “conversion rate” of meetings makes me think the price was set too low…Easy to drum up that kind of demand for an under-priced offering!
Bonus Highlight of the Week - Morgan Stanley CIO Survey
There were many takeaways from the excellent Morgan Stanley quarterly survey, but the one that stood out to me the most was the graph of applications being run in the cloud. Currently we’re only at 25%. The takeaway for me was that we’re still in the early innings of SaaS / Cloud. There’s still A TON of runway left. Chart below:

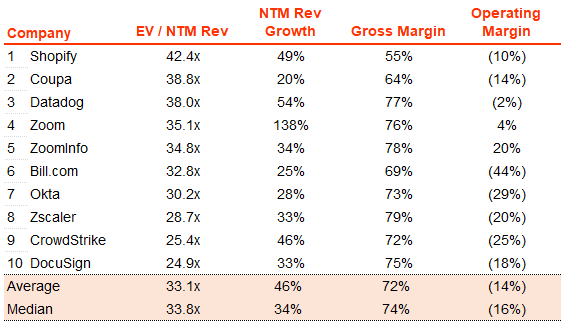
Top 10 EV / NTM Revenue Multiples

Top 10 Weekly Share Price Gains

Update on Multiples
SaaS businesses are valued on a multiple of their revenue - in most cases the projected revenue for the next 12 months. Multiples shown below are calculated by taking the Enterprise Value (market cap + debt - cash) / NTM revenue. In the buckets below I consider high growth >30% projected NTM growth, mid growth 15%-30% and low growth <15%
Overall Stats:
Overall Median: 12.9x
Top 5 Median: 38.0x
3 Month Trailing Average: 11.6x
1 Year Trailing Average: 10.5x


Bucketed by Growth:
High Growth Median: 24.3x
Mid Growth Median: 13.0x
Low Growth Median: 8.6x


Operating Metrics
Median NTM growth rate: 21%
Median LTM growth rate: 34%
Median Gross Margin: 73%
Median Operating Margin (15%)
Median Net Retention: 117%
Median CAC Payback: 28 months
News
SurveyMonkey announced they were named among the best companies for women to advance by Parity.org. You can find the full list here
A Twilio Study found that Covid-19 has accelerated companies digital communications strategy by 6 years. Full report can be found here
Gmail is integrating Chat, Rooms and Meet to move more into the productivity space
Zoom launched Zoom for Home - a new category of software experiences and hardware devices to support remote work use cases
Google announced a $10B “Digitization Fund” for India
Twilio acquired Electric Imp. Electric Imp makes it easier for businesses to securely connect their IoT devices with their data centers and third-party services.
Comps Output
Rule of 40 shows LTM growth rate + LTM GAAP Operating Margin


