
Clouded Judgement 7.17.26 - Open Weights, Closed Prices?

Every week I’ll provide updates on the latest trends in cloud software companies. Follow along to stay up to date!
Open Weights, Closed Prices?
There’s a new open weights model out this week many are talking about - Kimi K3. It’s not technically open weights YET, but on their launch blog they said" “The full model weights will be released by July 27, 2026.” At first pass, what stood out initially is the size of the model. K3 is a 2.8 trillion parameter MoE (16 of 896 experts active per token), which makes it the largest open model ever released (I think this is true, but haven’t fully fact checked everywhere). It’s ahead of DeepSeek V4-Pro at 1.6T (which I believe was the largest before K3). It has a 1M token context window, native multimodality, and seems to be built for agentic work. A lot of the launch materials / demos focused more on things like long-horizon coding, demos where it navigated massive repos, multi-hour autonomous runs, etc. On benchmarks (Moonshot's own numbers, so take with grain of salt, the technical report isn't out yet, and you never really know what the “details” behind how benchmarks were run are), K3 beats Opus 4.8 on the majority of published evals, (but still falls behind Fable 5 and GPT 5.6 Sol). My TLDR - Kimi K3 is arguably the best open model released, sitting roughly one generation behind the frontier.
The other thing that stood out to me is the pricing. Historically, open weight models have come out and been a fraction of the pricing of frontier models. Looking at GLM 5.2, that model was $1.40 per 1m input tokens and $4.40 per 1m output tokens. Using a 80% / 20% input / output ratio (which many benchmraks standardize to), the “blended” cost of GLM 5.2 is $2 per 1m tokens. This compared to Opus 4.8 at $9 and GPT 5.5 of $10.
Kimi K3 pricing is $3 per 1m input tokens, and $15 per 1m output tokens. Blended price of $5.40. This is starting to get MUCH closer to “frontier” pricing vs “open weights” pricing. I think there’s an interesting question here - is this the trend of future open weights models? Will their pricing start to converge to frontier pricing? What happens if the price gap between open weights and frontier models starts?
There’s also another part of the pricing discussion I’ve discussed earlier. How token efficient are the models? GLM 5.2 was much cheaper, but it was way less token efficient. So for the same prompt it would use more tokens than a frontier model (by 2-3x). So the “headline” price understated the actual price to serve. I haven’t seen an analysis yet on the token efficiency of Kimi K3, but there’s a good chance when you factor in token efficiency the pricing is even closer to an Opus 4.8 or GPT 5.5.
BUT - there’s another (maybe even bigger) pricing consideration with Kimi K3. Everything I just described is API pricing (which for a closed model is all that matters). But K3 is (about to be) open weights and historically, that meant the API price was just one option. If you don’t like the pricing from Kimi, you can simply download the weights and run the model yourself (or go to someone like Baseten).
With a closed model, you just have to pay whatever the lab charges, and the price includes their margin. You don’t have an alternative. With an open model, the free license itself was partially what made it “cheap”: you could download the weights and skip paying anyone's margin at all, or the inference providers could all serve the same model and compete on price / performance.
Maybe said another way, open weights were a cost lever and the “license” was the discount. At 2.8T parameters, that math on that “lever” doesn’t exist to the same extent (or at all). The model was trained at MXFP4, so the weights alone are ~1.4TB. Meaning 10+ H200s just to load it, before you touch the KV cache on a 1M context window (napkin math so don’t hold me to it). Moonshot is pretty up front about this as well. Their own launch blog recommends “supernode configurations with 64 or more accelerators.” The company releasing the weights is also saying that you need a 64+ GPU supernode to run them well. Which get’s into the next “hidden cost” - it’s as much a capex question as a self hosting one (and if you’re not self hosting, someone else like Baseten will, and they will have to run it on a larger compute footprint).
One force that historically factored into open model pricing (anyone can serve it) is much weaker when “anyone” means “anyone with a supernode and a serving stack tuned for a brand new attention architecture.” What we don’t know is what happens when they open the weights on July 27 - will 3rd party model servers undercut the $5.40 blended pricing? Will they be able to? We don’t really know the true margins on Kimi K3, so it’s harder to comment on the true pricing until we’ve had a bit more price discovery from those serving the models. A 2.8T model probably has a structurally higher serving floor than a 1T model no matter is serving it. The K2-era 10x discount existed (partially) because those models were both smaller AND served at thin margins. K3 only gives you the second one. For two years “open” and “cheap” were used interchangeably, but they were never the same thing. They were certainly correlated, because open models happened to be small enough that anyone could serve them. K3 is the first open model big enough to break that correlation. Which brings me back to the initial point - what is the true cost of open weights models, and how are they trending.
All of this to say - it’s very easy to make the big claim that “open weight models are going to kill the frontier! They’re way cheaper but just as performant!” However, there’s usually a lot more than meets the eye on these surface level arguments (however trendy they are to say on Twitter!)
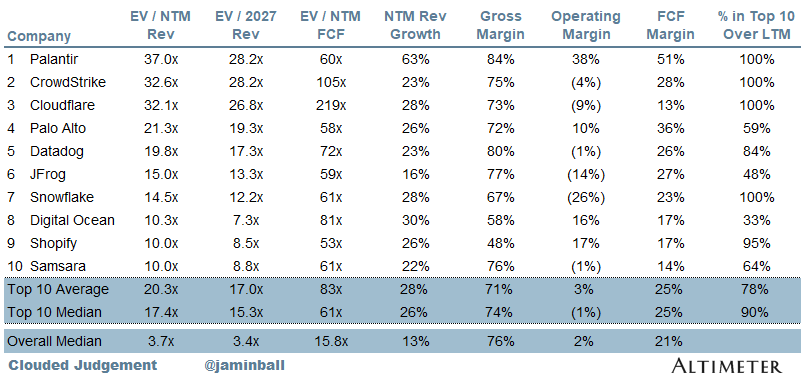
Top 10 EV / NTM Revenue Multiples
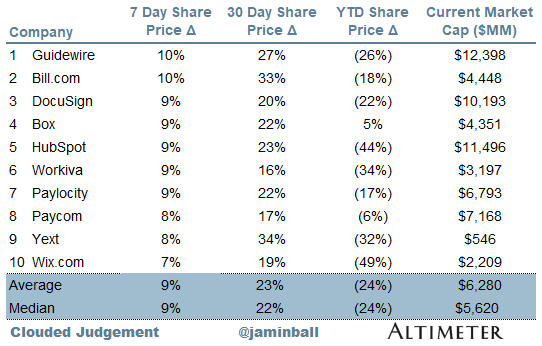
Top 10 Weekly Share Price Movement
Update on Multiples
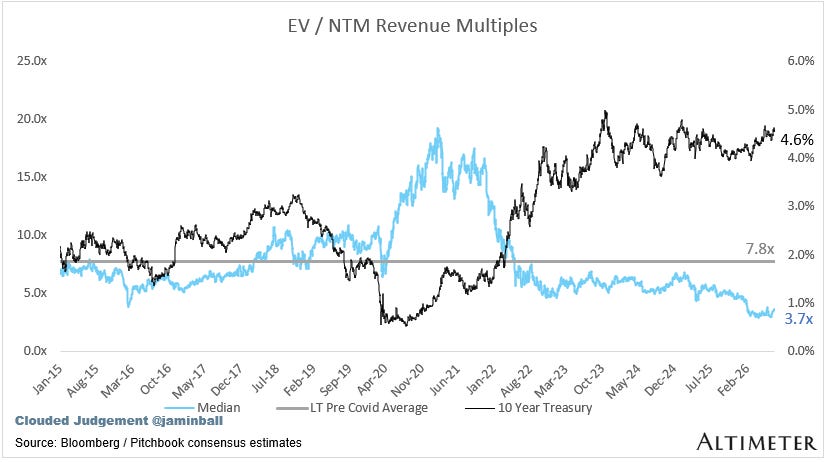
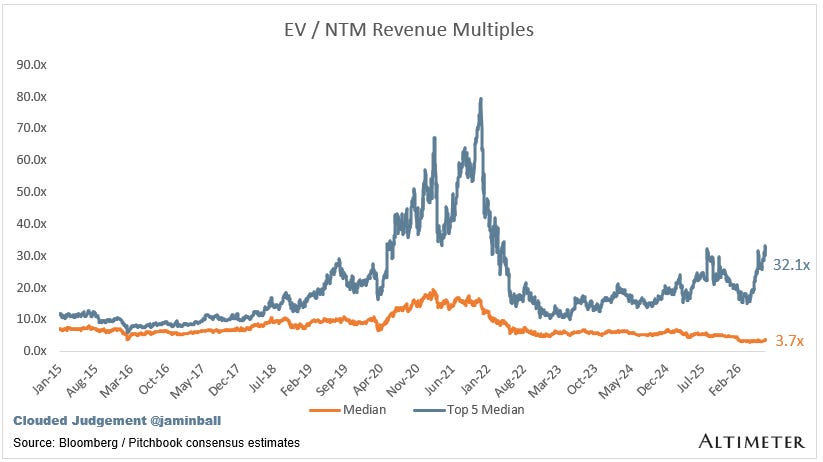
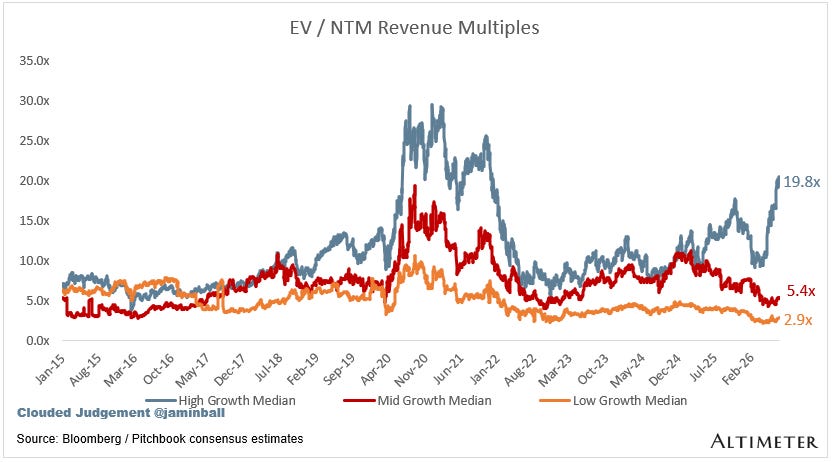
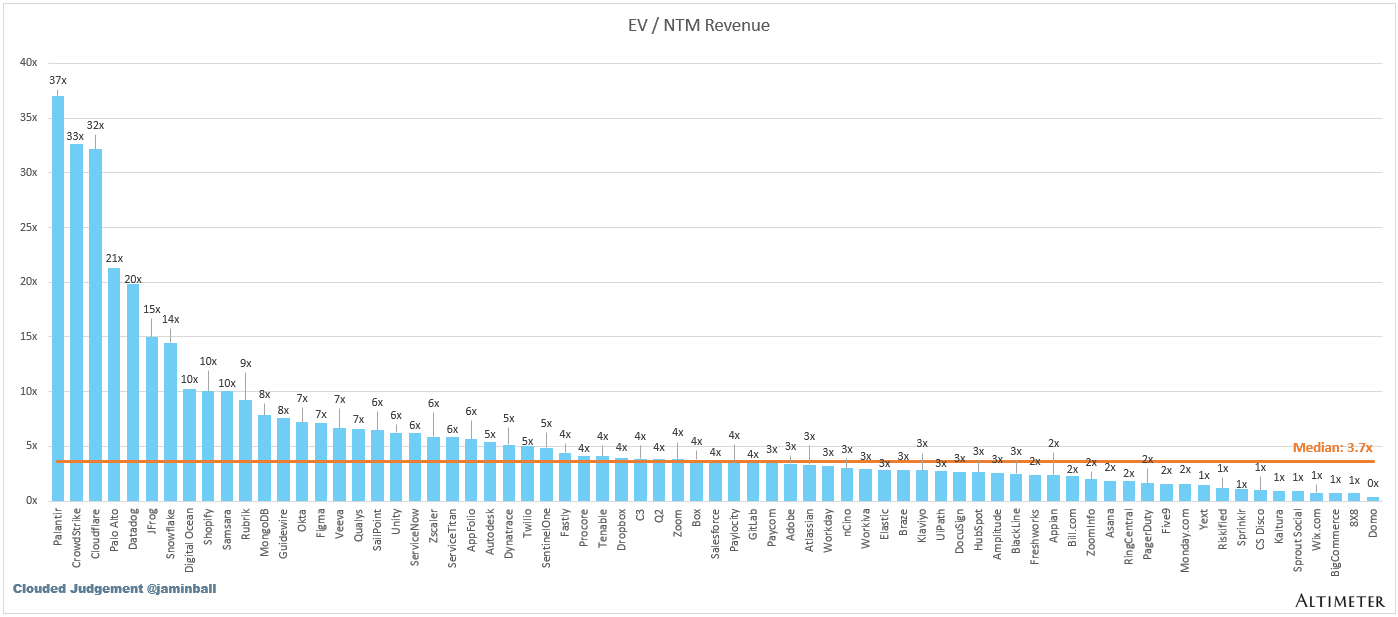
SaaS businesses are generally valued on a multiple of their revenue - in most cases the projected revenue for the next 12 months. Revenue multiples are a shorthand valuation framework. Given most software companies are not profitable, or not generating meaningful FCF, it’s the only metric to compare the entire industry against. Even a DCF is riddled with long term assumptions. The promise of SaaS is that growth in the early years leads to profits in the mature years. Multiples shown below are calculated by taking the Enterprise Value (market cap + debt - cash) / NTM revenue.
Overall Stats:
Overall Median: 3.7x
Top 5 Median: 32.1x
10Y: 4.6%
Bucketed by Growth. In the buckets below I consider high growth >22% projected NTM growth, mid growth 15%-22% and low growth <15%. I had to adjusted the cut off for “high growth.” If 22% feels a bit arbitrary, it’s because it is…I just picked a cutoff where there were ~10 companies that fit into the high growth bucket so the sample size was more statistically significant
High Growth Median: 19.8x
Mid Growth Median: 5.4x
Low Growth Median: 2.9x
EV / NTM Rev / NTM Growth
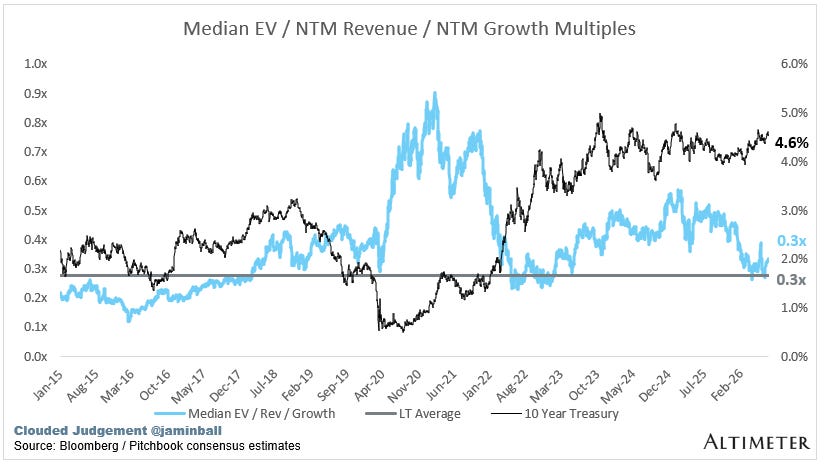
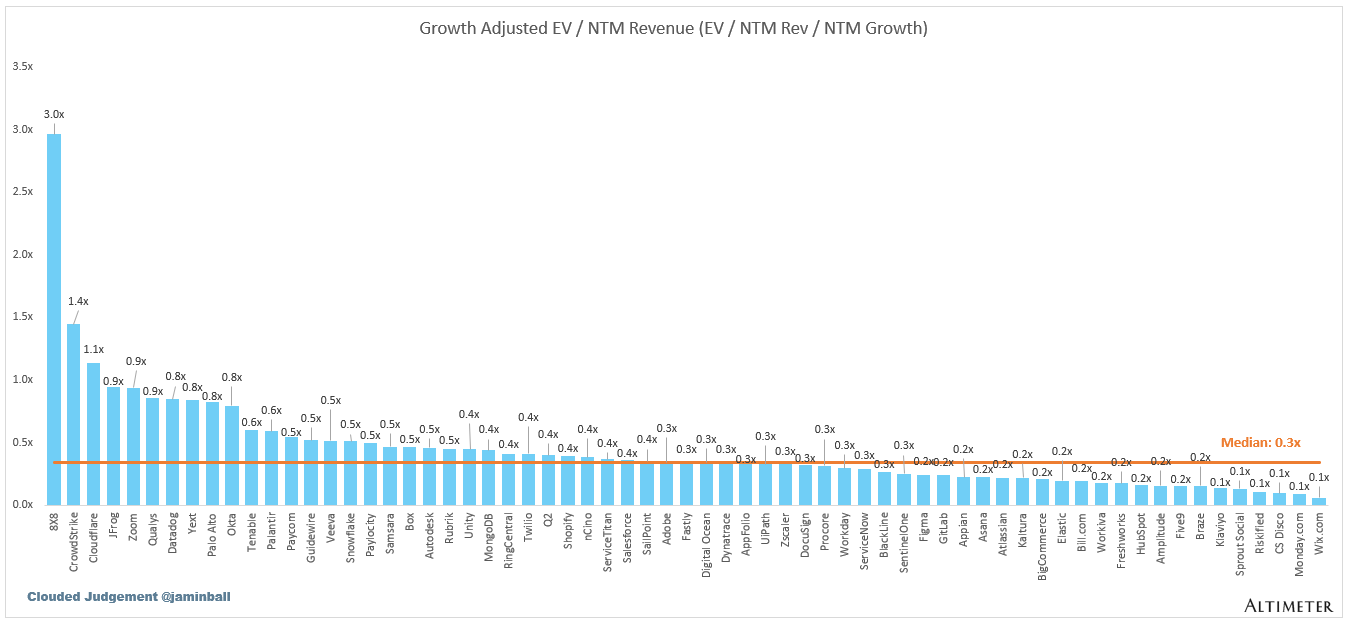
The below chart shows the EV / NTM revenue multiple divided by NTM consensus growth expectations. So a company trading at 20x NTM revenue that is projected to grow 100% would be trading at 0.2x. The goal of this graph is to show how relatively cheap / expensive each stock is relative to its growth expectations.
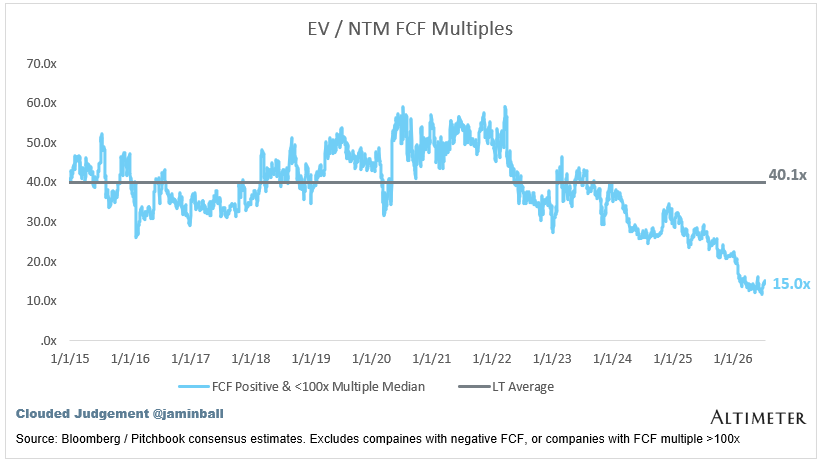
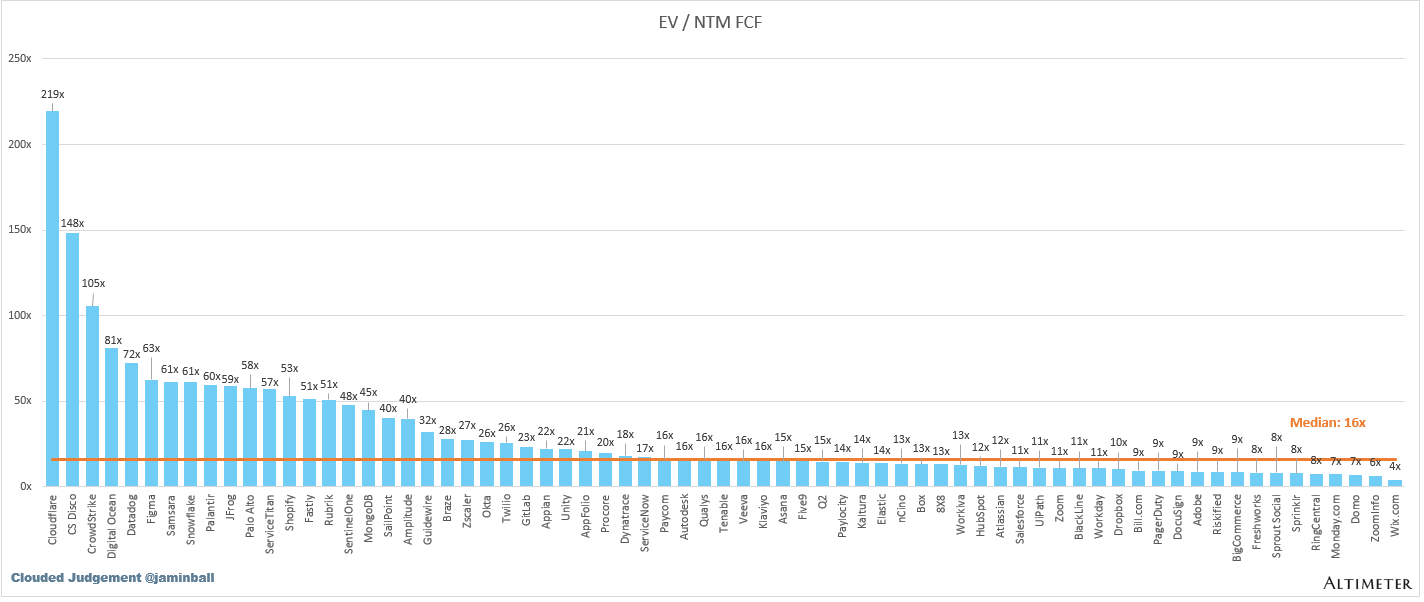
EV / NTM FCF
The line chart shows the median of all companies with a FCF multiple >0x and <100x. I created this subset to show companies where FCF is a relevant valuation metric.
Companies with negative NTM FCF are not listed on the chart
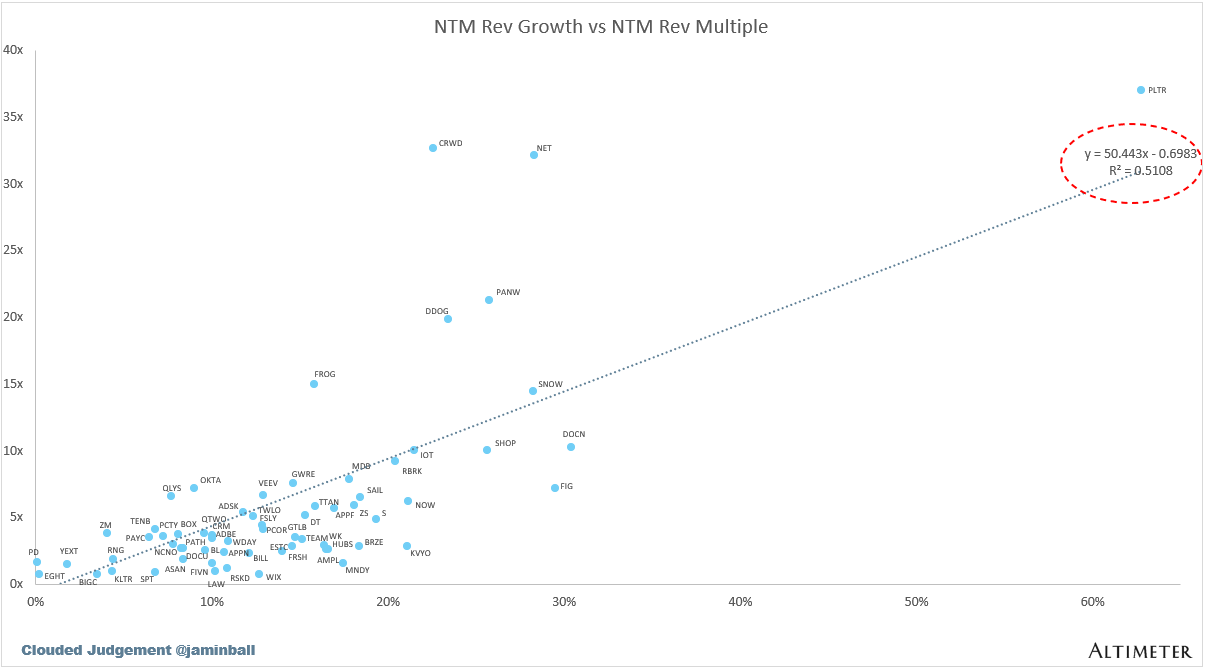
Scatter Plot of EV / NTM Rev Multiple vs NTM Rev Growth
How correlated is growth to valuation multiple?
Operating Metrics
Median NTM growth rate: 13%
Median LTM growth rate: 16%
Median Gross Margin: 76%
Median Operating Margin 2%
Median FCF Margin: 21%
Median Net Retention: 110%
Median CAC Payback: 44 months
Median S&M % Revenue: 34%
Median R&D % Revenue: 23%
Median G&A % Revenue: 13%
Comps Output
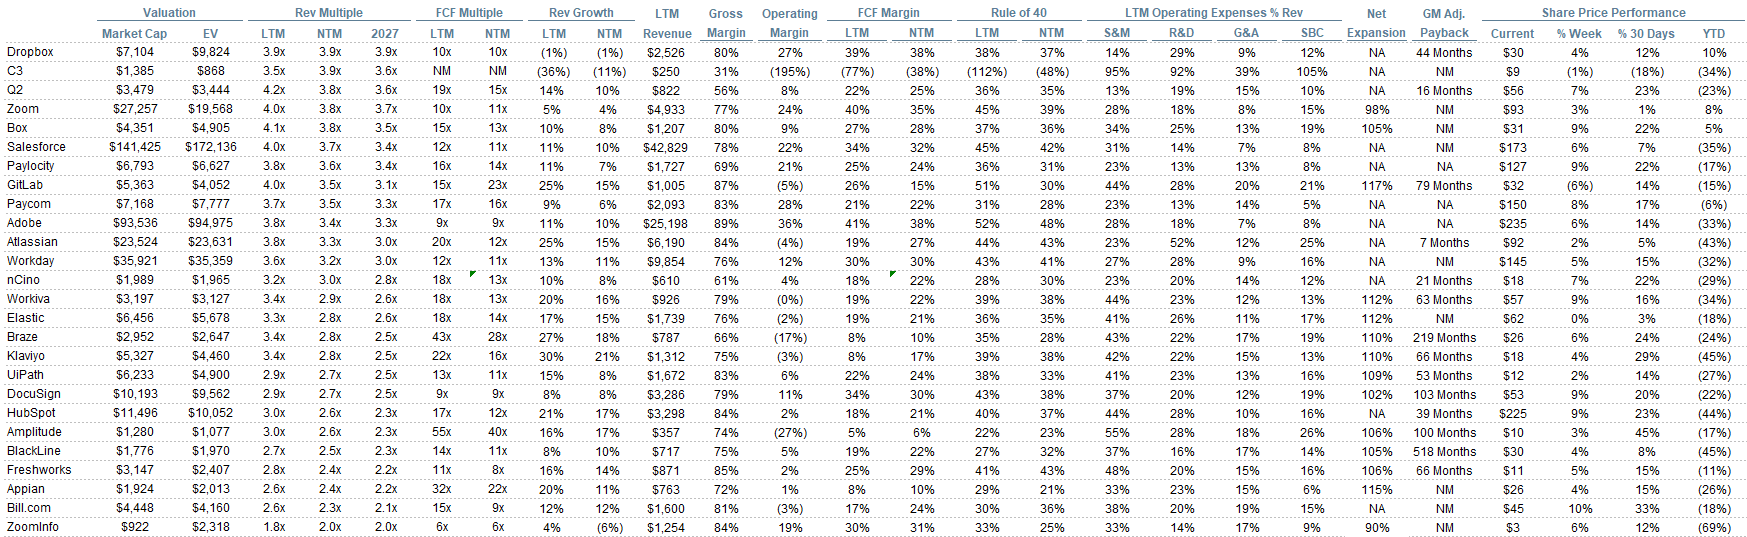
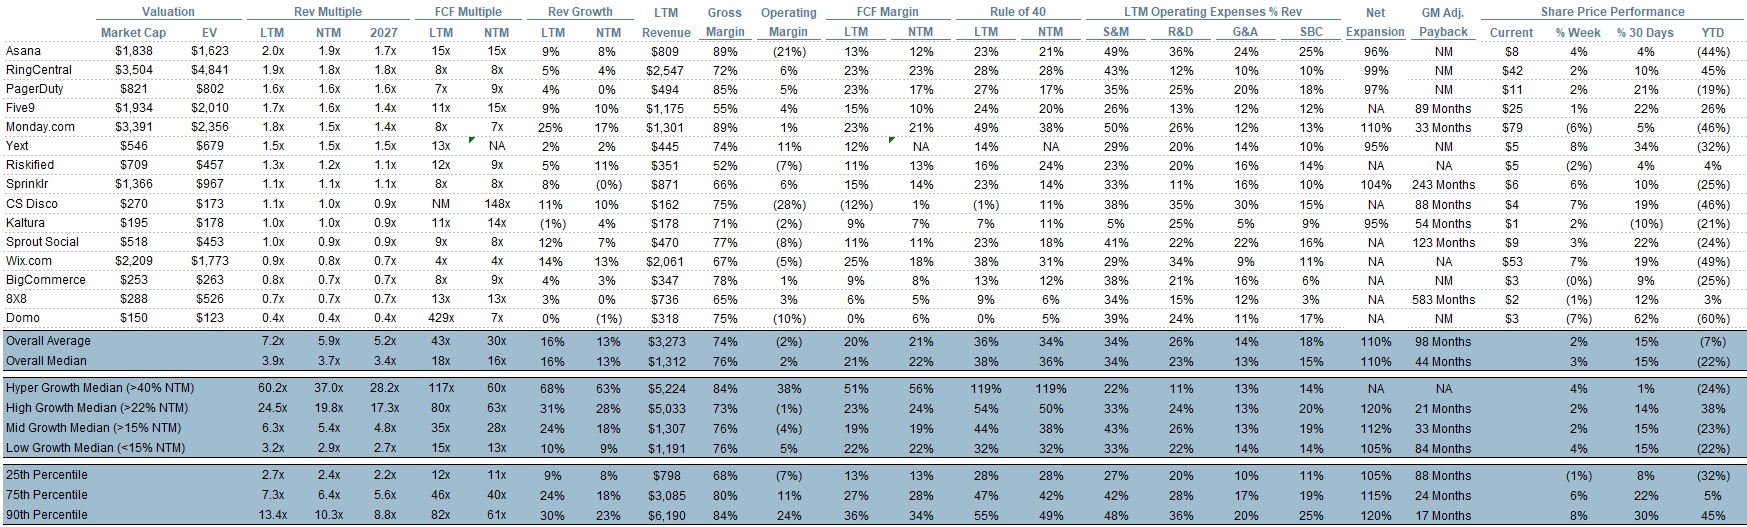
Rule of 40 shows rev growth + FCF margin (both LTM and NTM for growth + margins). FCF calculated as Cash Flow from Operations - Capital Expenditures
GM Adjusted Payback is calculated as: (Previous Q S&M) / (Net New ARR in Q x Gross Margin) x 12. It shows the number of months it takes for a SaaS business to pay back its fully burdened CAC on a gross profit basis. Most public companies don’t report net new ARR, so I’m taking an implied ARR metric (quarterly subscription revenue x 4). Net new ARR is simply the ARR of the current quarter, minus the ARR of the previous quarter. Companies that do not disclose subscription rev have been left out of the analysis and are listed as NA.
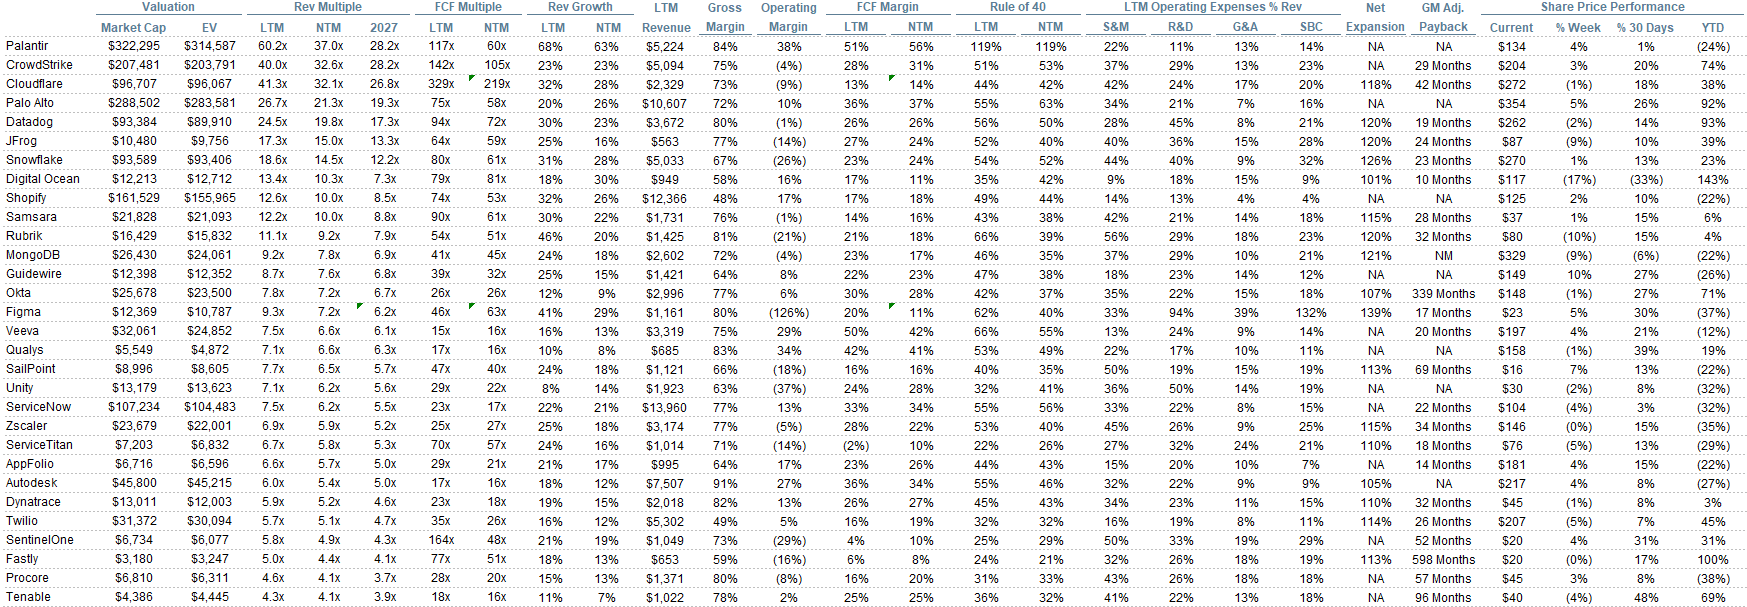
Sources used in this post include Bloomberg, Pitchbook and company filings
The information presented in this newsletter is the opinion of the author and does not necessarily reflect the view of any other person or entity, including Altimeter Capital Management, LP (”Altimeter”). The information provided is believed to be from reliable sources but no liability is accepted for any inaccuracies. This is for information purposes and should not be construed as an investment recommendation. Past performance is no guarantee of future performance. Altimeter is an investment adviser registered with the U.S. Securities and Exchange Commission. Registration does not imply a certain level of skill or training. Altimeter and its clients trade in public securities and have made and/or may make investments in or investment decisions relating to the companies referenced herein. The views expressed herein are those of the author and not of Altimeter or its clients, which reserve the right to make investment decisions or engage in trading activity that would be (or could be construed as) consistent and/or inconsistent with the views expressed herein.
This post and the information presented are intended for informational purposes only. The views expressed herein are the author’s alone and do not constitute an offer to sell, or a recommendation to purchase, or a solicitation of an offer to buy, any security, nor a recommendation for any investment product or service. While certain information contained herein has been obtained from sources believed to be reliable, neither the author nor any of his employers or their affiliates have independently verified this information, and its accuracy and completeness cannot be guaranteed. Accordingly, no representation or warranty, express or implied, is made as to, and no reliance should be placed on, the fairness, accuracy, timeliness or completeness of this information. The author and all employers and their affiliated persons assume no liability for this information and no obligation to update the information or analysis contained herein in the future.