
Clouded Judgement 7.18.25 - The Return of the Point Solution

Every week I’ll provide updates on the latest trends in cloud software companies. Follow along to stay up to date!
The Return of the Point Solution
Different type of post this week. Instead of macro commentary, market commentary or some specific piece of AI commentary, I thought I’d treat this weeks post more as a personal journal entry. Something I’ve been thinking about a lot recently that I’d like to revisit in 3-5 years.
As an investor, I’m always hunting for the “next big platform.” “Who’s the next Datadog. The next Crowdstrike.” The challenge is, if you rewind the clock back to the early days of Datadog, they were anything but the next big platform! They were a dinky little point solution operating in a small niche of the observability space that New Relic / AppDynamics should have crushed. The APM space was much larger, more established, and cloud infrastructure monitoring was more niche (where Datadog played). In the early days of Datadog, of course New Relic was just “going to do infra monitoring.” Datadog was destined to be New Relic road kill….
Well, we all know how that played out! The next platform (Datadog) started off as a point solution, ruthlessly out executed startup competitors as well as incumbents who had distribution and attempted to “bundle them,” and ultimately became the next big platform themselves (one who was larger than the initial platforms who tried to kill them). There are so many similar stories coming out of AWS ReInvent every year. They’d announce a ton of new products on stage, and the initial reaction was always “Wow! They just killed X, Y, Z startup!”
Now, there is a ton of survivorship bias baked in here…For every Datadog there are probably 10+ companies in the observability space that become roadkill, and 100+ others in other categories who never broke free from the shackles of the incumbent. So what is it about these “upcoming platforms” that make them so great? That’s what makes investing so fun today - it’s trying to spot them! And two characteristics I keep coming back to is relentless passion by the founders, and decisive execution by the team. The best companies just move at a different speed (because they have to…), and have founders who are apex predators.
I bring this up, because now more than ever (maybe an order of magnitude more) I find myself meeting with companies that have the following characteristics:
They’re early, but growing insanely fast. Much faster than any companies I met during the SaaS era. But also unclear on the durability of that revenue
They have more competition from other startups than in prior waves
They have an obvious incumbent who “should” eat their lunch (and sometimes that incumbent is an AI native company). Just look at Claude Code - they only went GA a couple months ago! And they’re already a super formidable threat to anyone building something in the broader software development lifecycle space
My decision matrix then becomes: Will this category support an independent company (ie will the company survive the incumbent bundle attacks) and which company will be the winner in the space. Today, I think I will overindex on “this category will become a larger players roadkill.” And I’m writing out this post so I can look back and tell myself “I told you so.” The next platforms are hiding in plain sight as point solutions. Finding the right strategic real estate to entrench yourself, building excellence in your trench, and then methodically expanding will lead to even larger platforms than the ones that were built in the 2010-2015 time frame. And that time frame was a GREAT time to start a business. This is by no means an exhaustive list, but Databricks, Stripe, Datadog, Snowflake, Crowdstrike, Confluent, Zscaler, etc were all founded in that window. What was the significance of that window? It was ~4 years after AWS was launched and the public cloud started to take off. Turns out, 5-10 years post the “cloud launch “was the golden era of cloud investing. Well, ChatGPT was launched in 2022…I think we’re just about to hit the golden era of AI investing, with the creation of some of the largest software platforms we’ll ever see.
For startups - it’s easy to get caught up in the noise. Who else are you competing with. What larger player just launched a competing product and is trying to bundle you away. Tune all that out. Only thing that will matter is your relentless execution. Can you build a beautiful product experience, own a niche, and then EARN the right to expand. Trying to expand too early into a platform can be dangerous. Nail your wedge, build a world class and differentiated product, and the rest will be followers.
Final point - I also think this post is an evolution of the “GPT Wrappers” debate… Lots of things start off as wrappers, or point solutions, and then grow up quickly in the blink of an eye.
Top 10 EV / NTM Revenue Multiples

Top 10 Weekly Share Price Movement

Update on Multiples
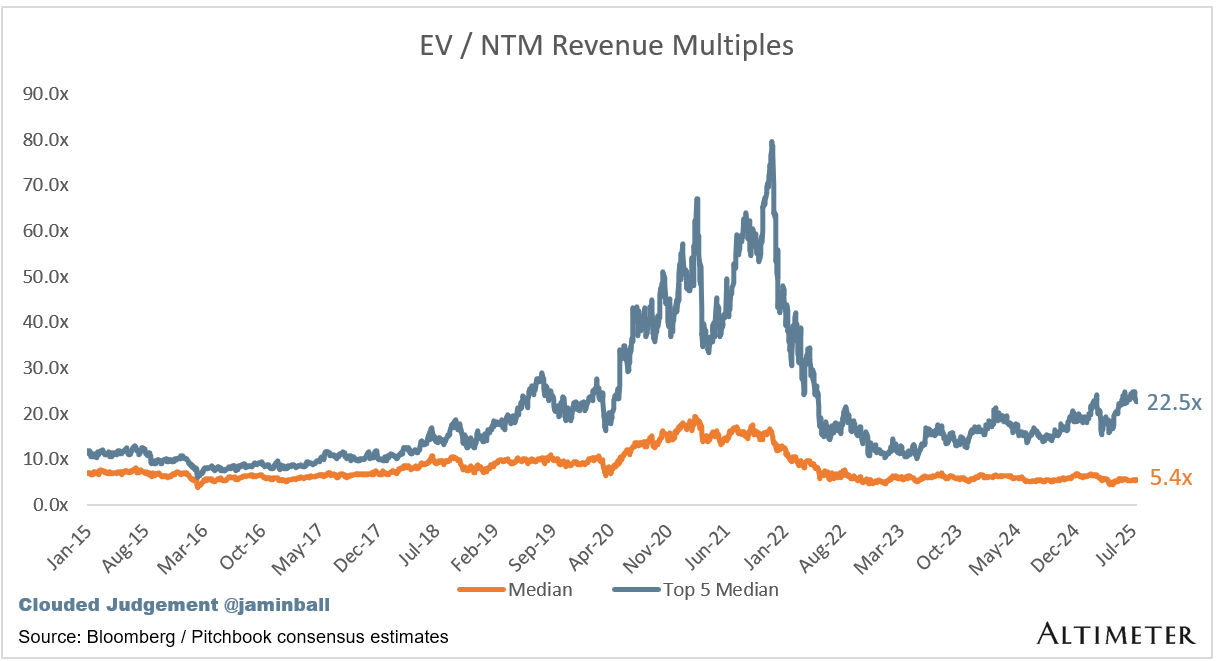
SaaS businesses are generally valued on a multiple of their revenue - in most cases the projected revenue for the next 12 months. Revenue multiples are a shorthand valuation framework. Given most software companies are not profitable, or not generating meaningful FCF, it’s the only metric to compare the entire industry against. Even a DCF is riddled with long term assumptions. The promise of SaaS is that growth in the early years leads to profits in the mature years. Multiples shown below are calculated by taking the Enterprise Value (market cap + debt - cash) / NTM revenue.
Overall Stats:
Overall Median: 5.4x
Top 5 Median: 22.5x
10Y: 4.5%

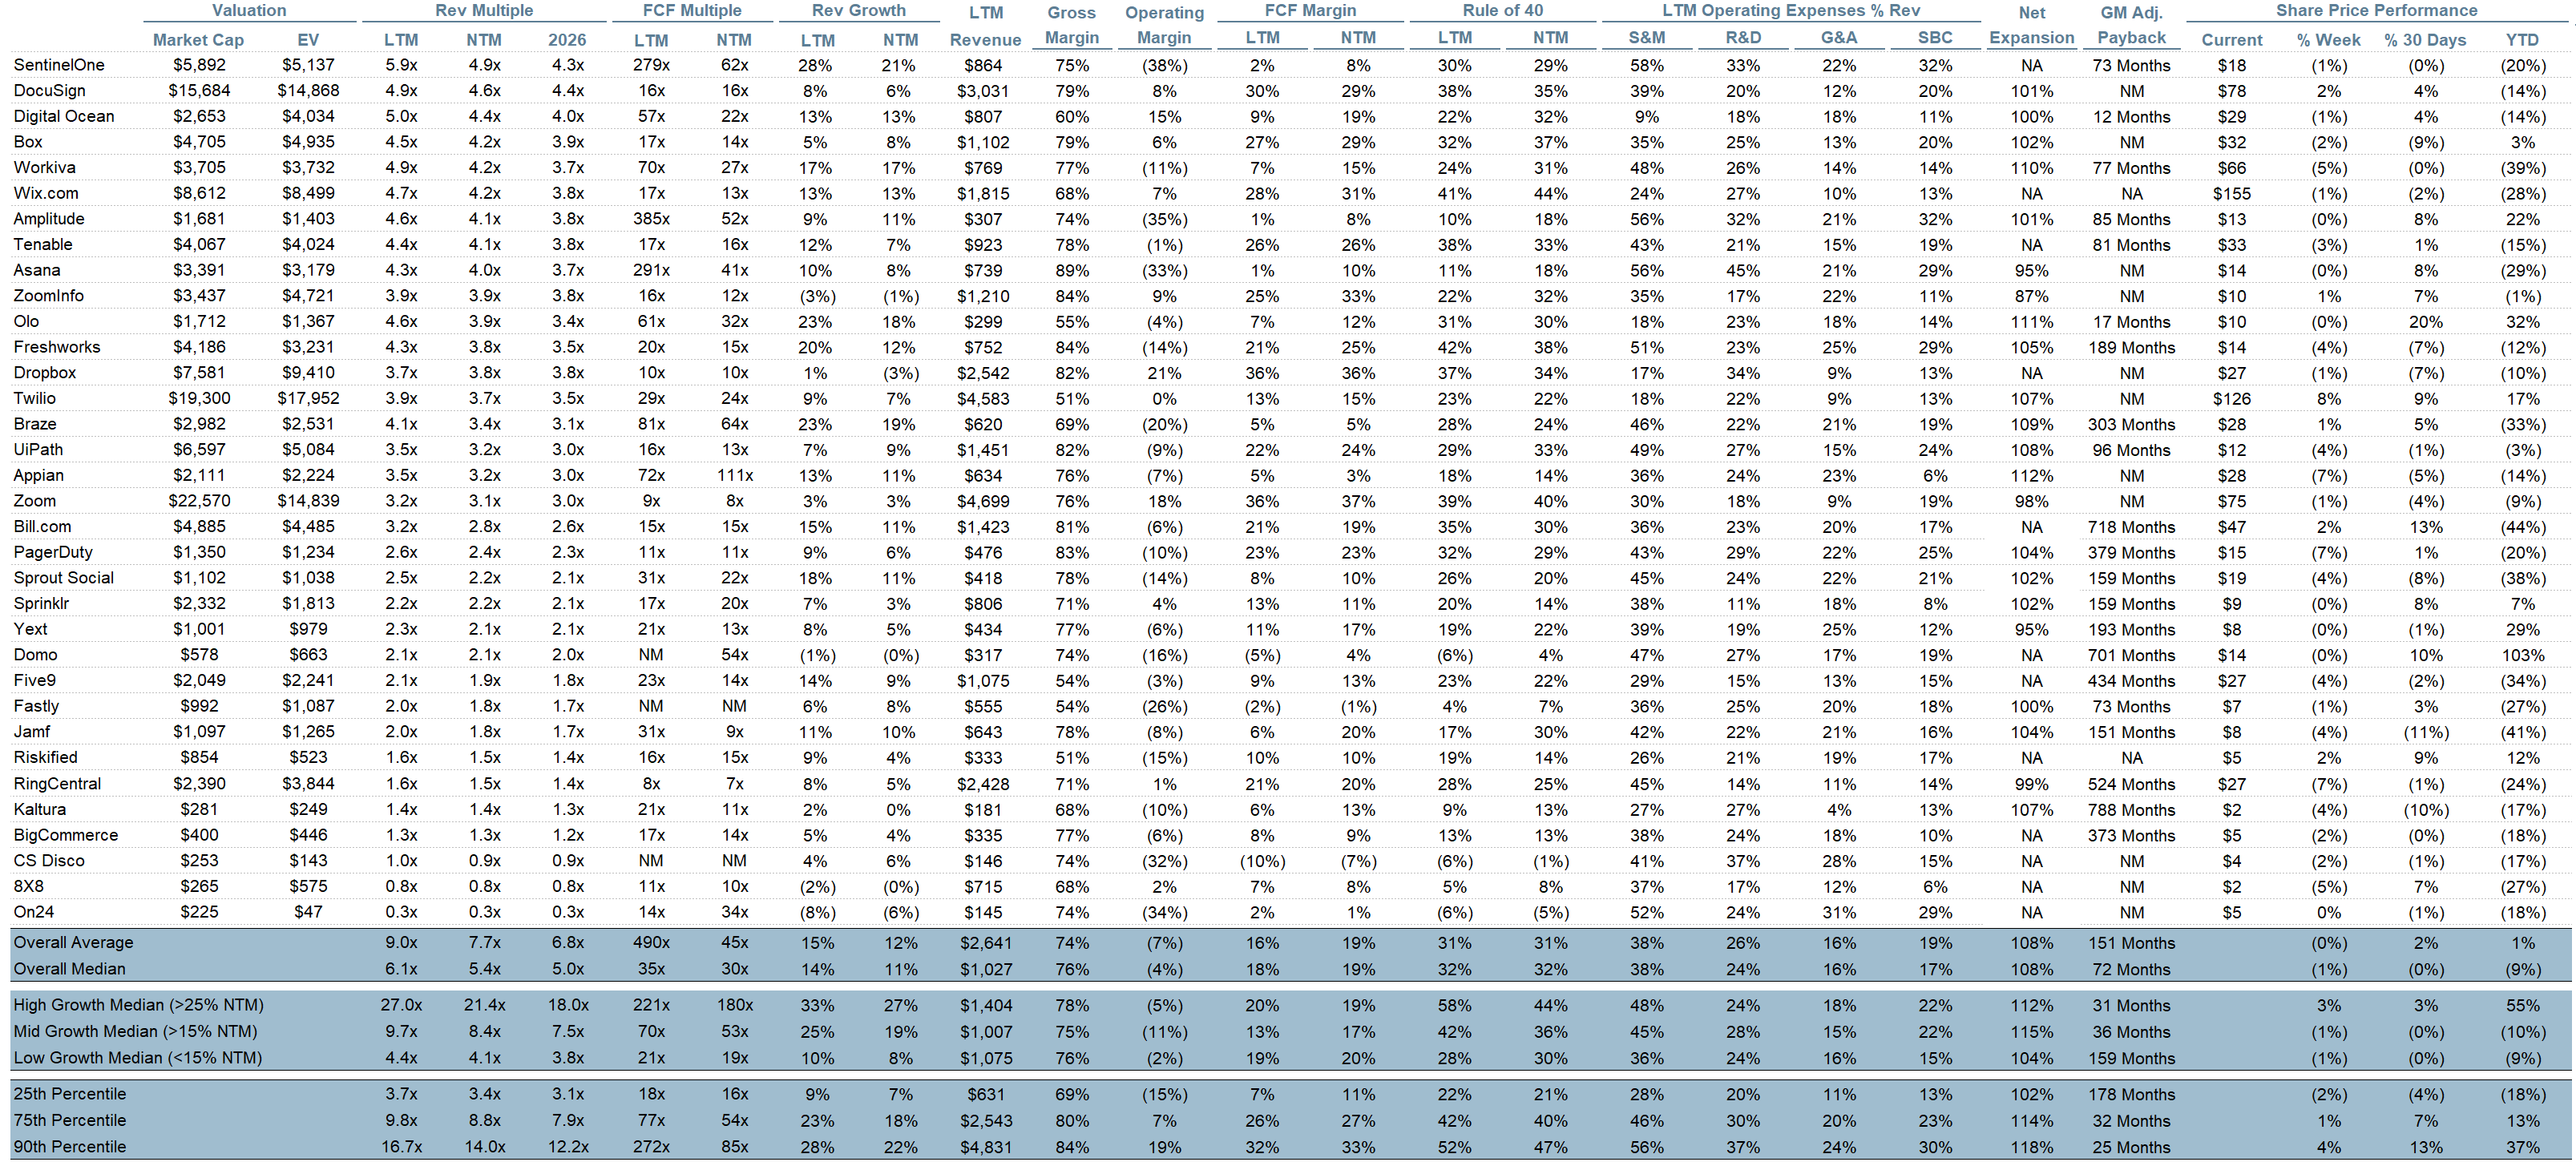
Bucketed by Growth. In the buckets below I consider high growth >25% projected NTM growth, mid growth 15%-25% and low growth <15%
High Growth Median: 21.4x
Mid Growth Median: 8.4x
Low Growth Median: 4.1x


EV / NTM Rev / NTM Growth
The below chart shows the EV / NTM revenue multiple divided by NTM consensus growth expectations. So a company trading at 20x NTM revenue that is projected to grow 100% would be trading at 0.2x. The goal of this graph is to show how relatively cheap / expensive each stock is relative to its growth expectations.


EV / NTM FCF
The line chart shows the median of all companies with a FCF multiple >0x and <100x. I created this subset to show companies where FCF is a relevant valuation metric.

Companies with negative NTM FCF are not listed on the chart

Scatter Plot of EV / NTM Rev Multiple vs NTM Rev Growth
How correlated is growth to valuation multiple?

Operating Metrics
Median NTM growth rate: 11%
Median LTM growth rate: 14%
Median Gross Margin: 76%
Median Operating Margin (4%)
Median FCF Margin: 18%
Median Net Retention: 108%
Median CAC Payback: 72 months
Median S&M % Revenue: 38%
Median R&D % Revenue: 24%
Median G&A % Revenue: 16%
Comps Output
Rule of 40 shows rev growth + FCF margin (both LTM and NTM for growth + margins). FCF calculated as Cash Flow from Operations - Capital Expenditures
GM Adjusted Payback is calculated as: (Previous Q S&M) / (Net New ARR in Q x Gross Margin) x 12. It shows the number of months it takes for a SaaS business to pay back its fully burdened CAC on a gross profit basis. Most public companies don’t report net new ARR, so I’m taking an implied ARR metric (quarterly subscription revenue x 4). Net new ARR is simply the ARR of the current quarter, minus the ARR of the previous quarter. Companies that do not disclose subscription rev have been left out of the analysis and are listed as NA.

Sources used in this post include Bloomberg, Pitchbook and company filings
The information presented in this newsletter is the opinion of the author and does not necessarily reflect the view of any other person or entity, including Altimeter Capital Management, LP ("Altimeter"). The information provided is believed to be from reliable sources but no liability is accepted for any inaccuracies. This is for information purposes and should not be construed as an investment recommendation. Past performance is no guarantee of future performance. Altimeter is an investment adviser registered with the U.S. Securities and Exchange Commission. Registration does not imply a certain level of skill or training. Altimeter and its clients trade in public securities and have made and/or may make investments in or investment decisions relating to the companies referenced herein. The views expressed herein are those of the author and not of Altimeter or its clients, which reserve the right to make investment decisions or engage in trading activity that would be (or could be construed as) consistent and/or inconsistent with the views expressed herein.
This post and the information presented are intended for informational purposes only. The views expressed herein are the author’s alone and do not constitute an offer to sell, or a recommendation to purchase, or a solicitation of an offer to buy, any security, nor a recommendation for any investment product or service. While certain information contained herein has been obtained from sources believed to be reliable, neither the author nor any of his employers or their affiliates have independently verified this information, and its accuracy and completeness cannot be guaranteed. Accordingly, no representation or warranty, express or implied, is made as to, and no reliance should be placed on, the fairness, accuracy, timeliness or completeness of this information. The author and all employers and their affiliated persons assume no liability for this information and no obligation to update the information or analysis contained herein in the future.
thanks for sharing the "journal entry" fascinating analysis. in my experience, leadership and company culture is often overlooked but core to success. I would love to see and follow the "matrix" of companies you identify
Great post - appreciate the perspective and it pointed me in the right direction. Now I can take your examples like DataDog and research how they did. t\