
Clouded Judgement 7.24.26 - The World Isn’t Zero Sum

Every week I’ll provide updates on the latest trends in cloud software companies. Follow along to stay up to date!
The World Isn’t Zero Sum
I debated the title for this article a lot. The other option was “The World Isn’t Binary.” I’m still not exactly sure which title better describes this article, but I’ve found the principal of living with a positive sum mentality more impactful in my life so I went with that title. Anyway..on to the post!
There are no shortage of big debates right now in AI. Open vs closed models. Nvidia vs custom silicon. Will chips have value after 5 years. Will AI kill software. God model vs fleet of specialized models. Are we in an AI capex bubble or not. Model layer vs application layer. Will models commoditize. The list goes on! These were just a few that came to mind…
I won’t address all of these today, but the answer for most is “you’re not thinking big enough.” I’m clearly a hyper-optimistic person, I like to view the world through this lens! But I genuinely think these questions do a disservice to the moment we’re in. I don’t mean to invalidate the questions, they are smart questions, BUT in an early exponential moment I think it’s easy to “reduce” the moment to these simple questions that often seem zero sum in nature. When the size of the prize is expanding this quickly, the answer often turns out to be “everybody won.”
Let’s look at the current open vs closed model debate (or really the “Are Anthropic and OpenAI screwed as low cost open weight models take over” question). The TLDR of my perspective is that there will be both a massive market for closed frontier models AND open weight models. Does one come at the expense of the other? Of course. If open weight models didn’t exist, more dollars would accrue to the frontier labs. BUT - the total spend on models won’t stay static…If it did, sure the mix shift of frontier to open would shift towards more open over time (given the starting point today on frontier closed is such a high relative percentage). But, the topline isn’t static. It’s growing exponentially. So as more tokens start shifting to open weight models, the absolute dollar spend on frontier will still grow significantly (even exponentially). I hate to reduce it down to a cliche, but the size of the pie is growing much faster than mix shift is changing.
Same debate for Nvidia vs challengers or custom silicon. Will we have more custom ASICS, or new chips from upstarts like Etched, Positron, MatX, Fractile, d-Matrix, etc? Of course. Will the mix shift of today look less “Nvidia heavy” in the future? Probably. Nvidia is just such a massive percentage today. But do I think Nvidia will continue to grow meaningfully for a while? I do!
So the answer to both of these questions isn’t one winner one looser, it’s “many winners.” And I think in the early days of an exponential it’s easy to reduce questions down to “who wins and who looses” when the real answer is “both can win.”
Quarterly Reports Summary

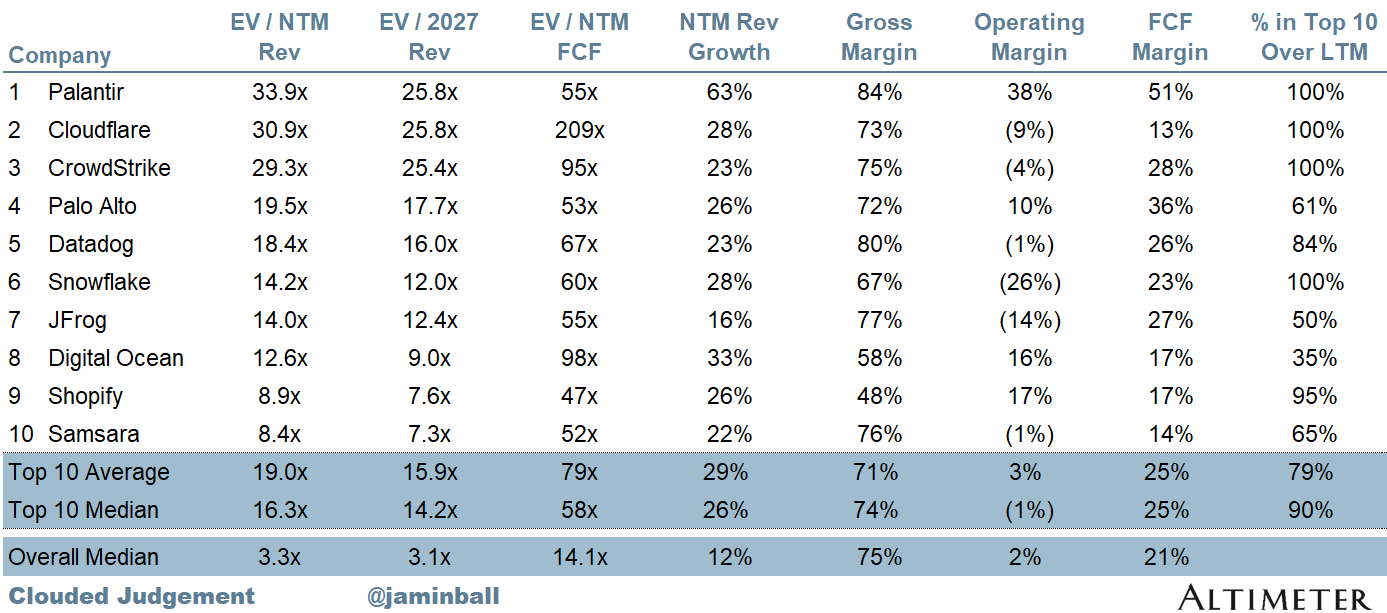
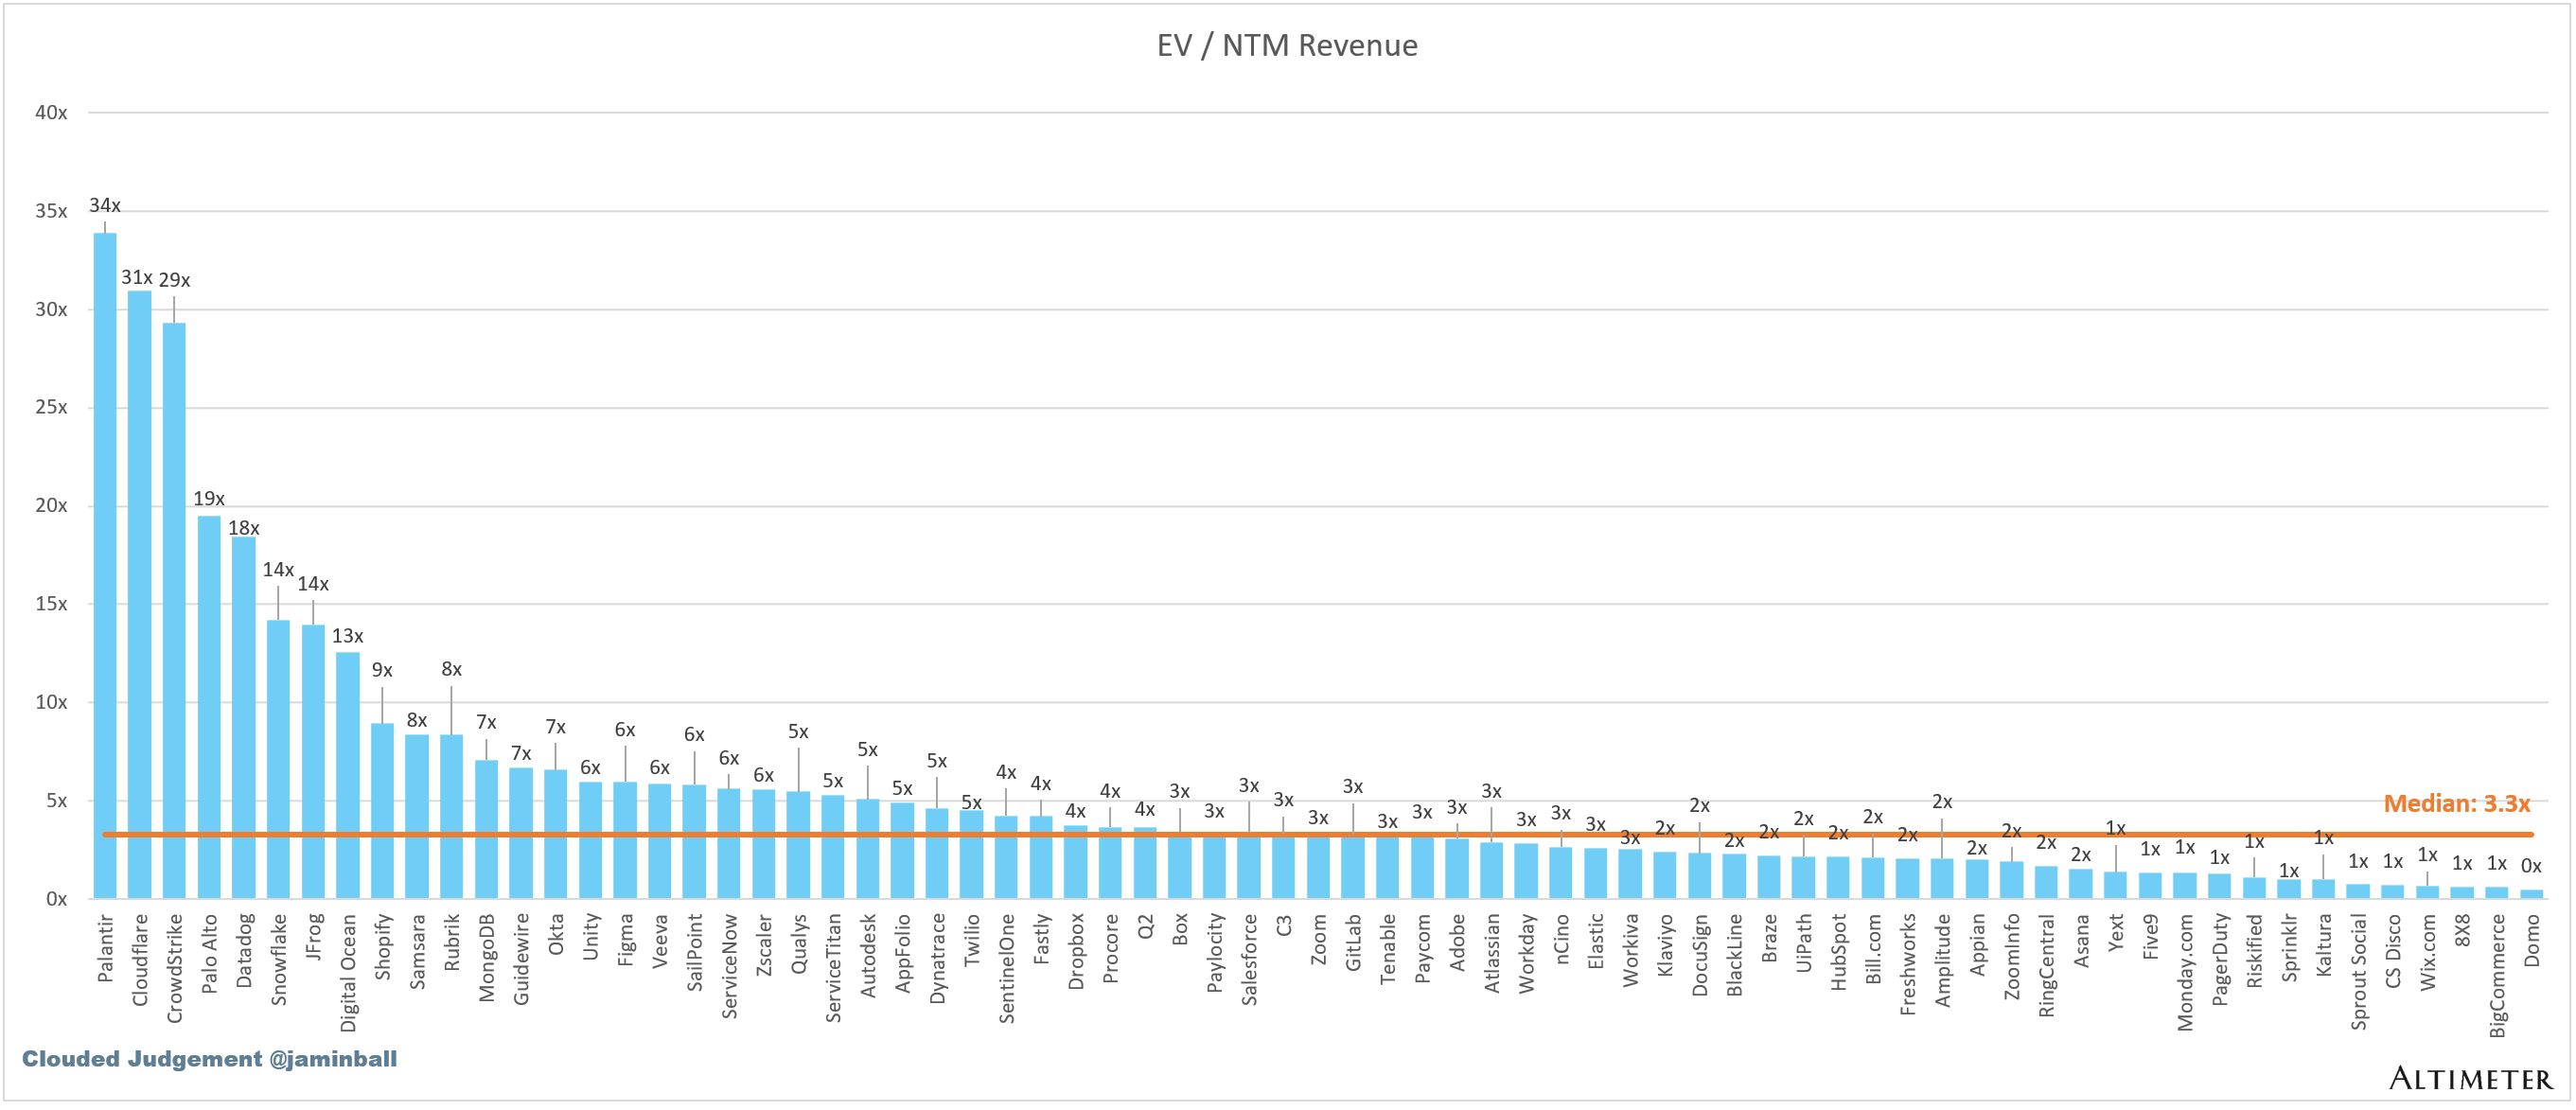
Top 10 EV / NTM Revenue Multiples
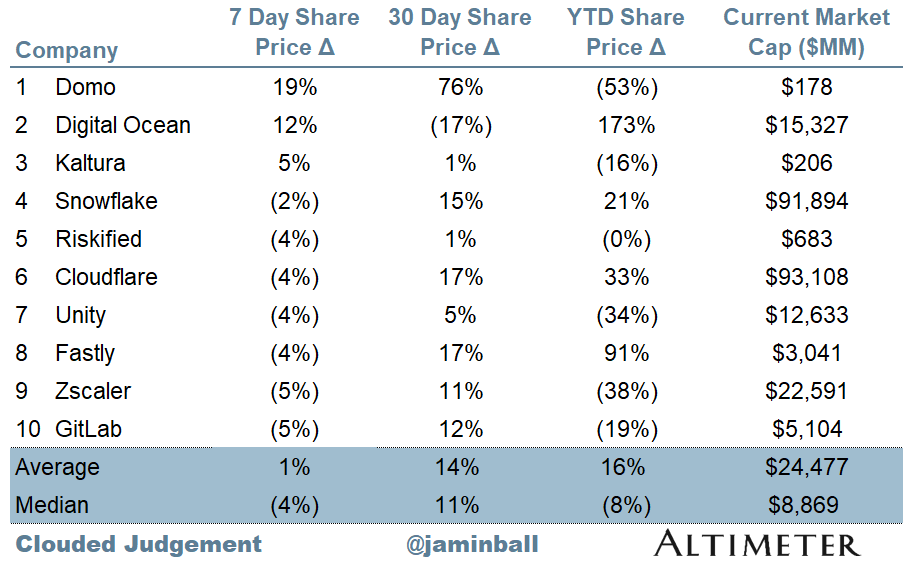
Top 10 Weekly Share Price Movement
Update on Multiples
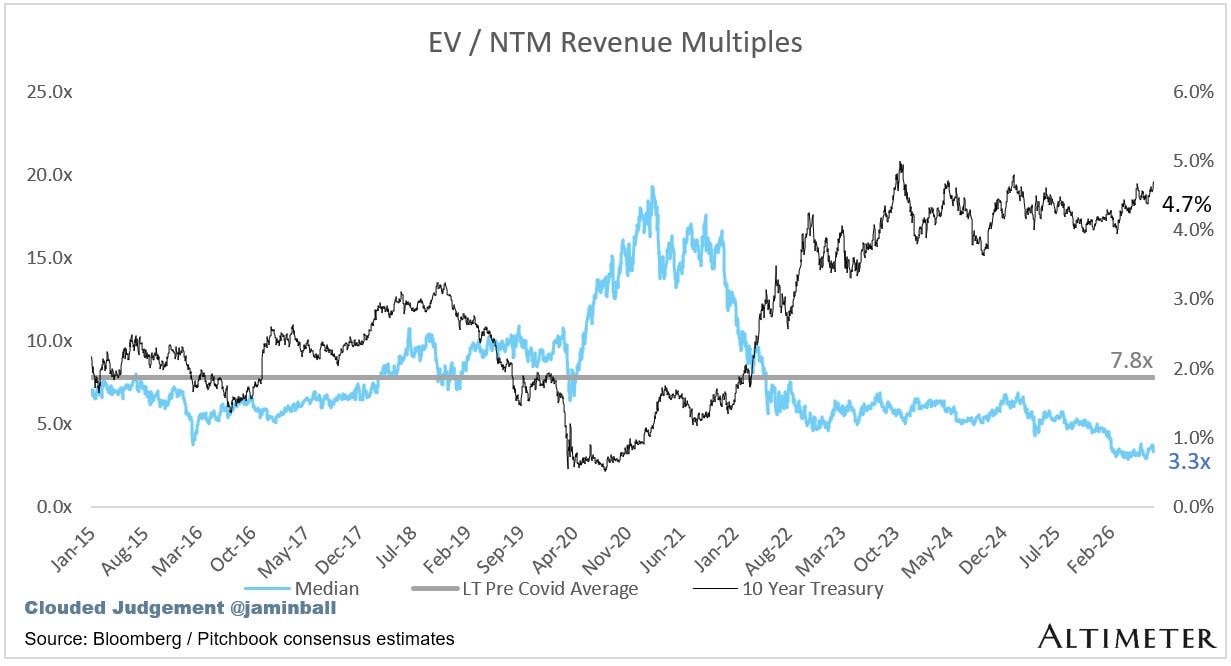
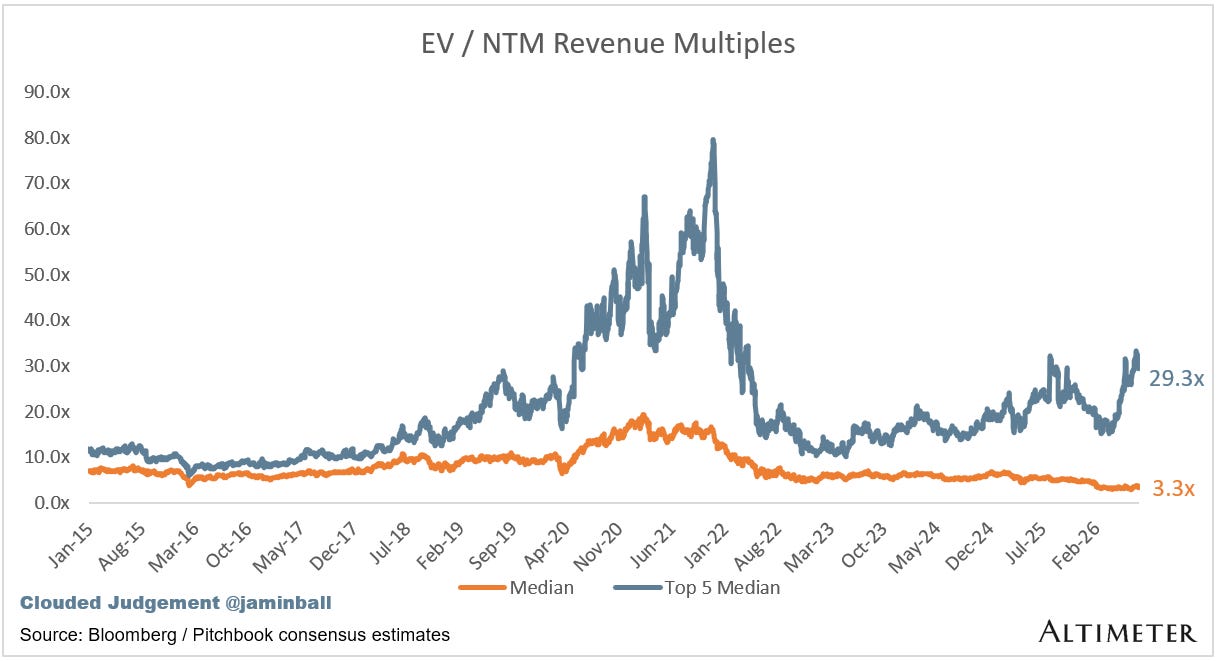
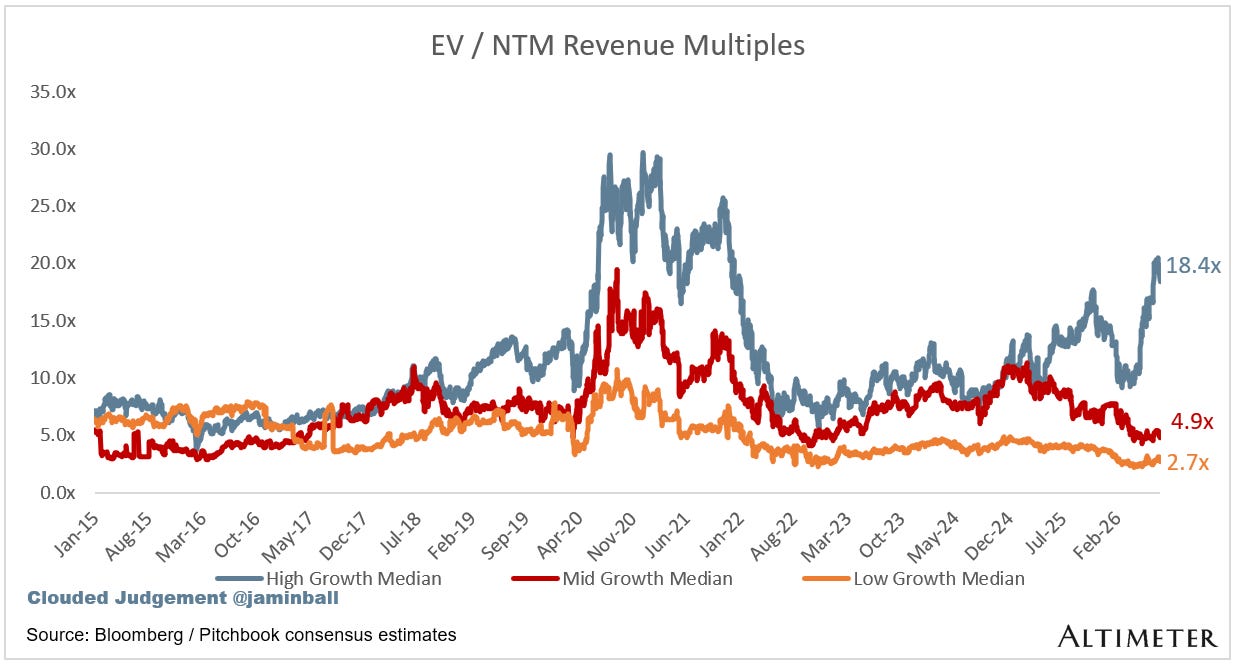
SaaS businesses are generally valued on a multiple of their revenue - in most cases the projected revenue for the next 12 months. Revenue multiples are a shorthand valuation framework. Given most software companies are not profitable, or not generating meaningful FCF, it’s the only metric to compare the entire industry against. Even a DCF is riddled with long term assumptions. The promise of SaaS is that growth in the early years leads to profits in the mature years. Multiples shown below are calculated by taking the Enterprise Value (market cap + debt - cash) / NTM revenue.
Overall Stats:
Overall Median: 3.3x
Top 5 Median: 29.3x
10Y: 4.7%
Bucketed by Growth. In the buckets below I consider high growth >22% projected NTM growth, mid growth 15%-22% and low growth <15%. I had to adjusted the cut off for “high growth.” If 22% feels a bit arbitrary, it’s because it is…I just picked a cutoff where there were ~10 companies that fit into the high growth bucket so the sample size was more statistically significant
High Growth Median: 18.4x
Mid Growth Median: 4.9x
Low Growth Median: 2.7x
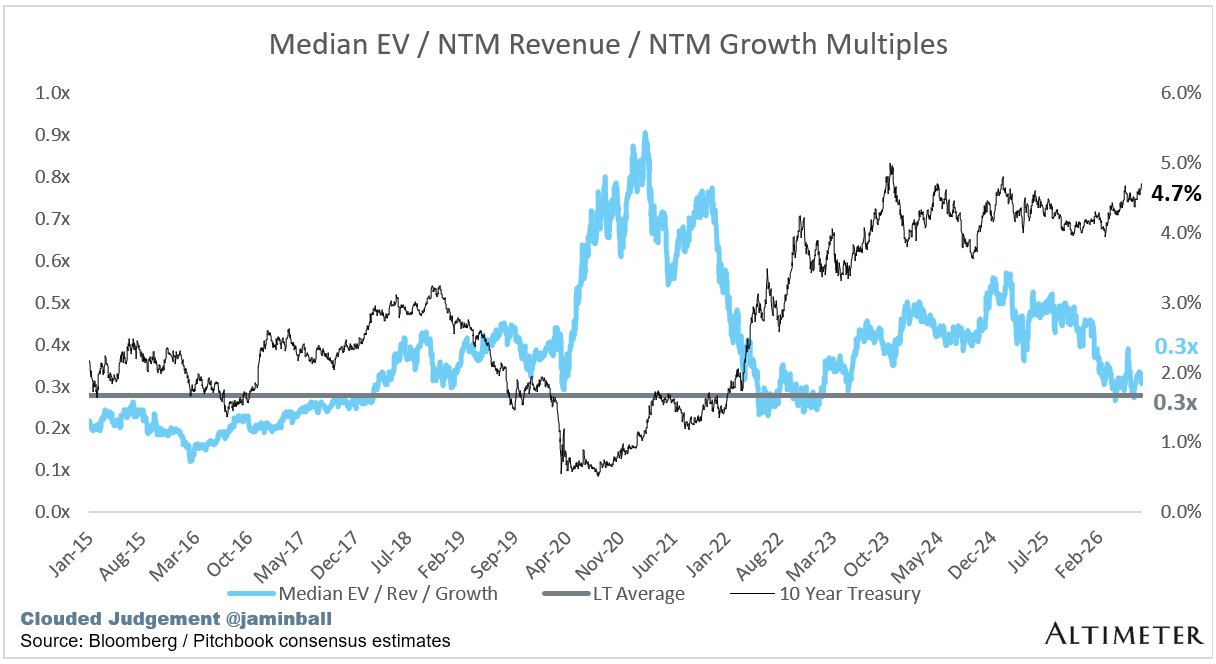
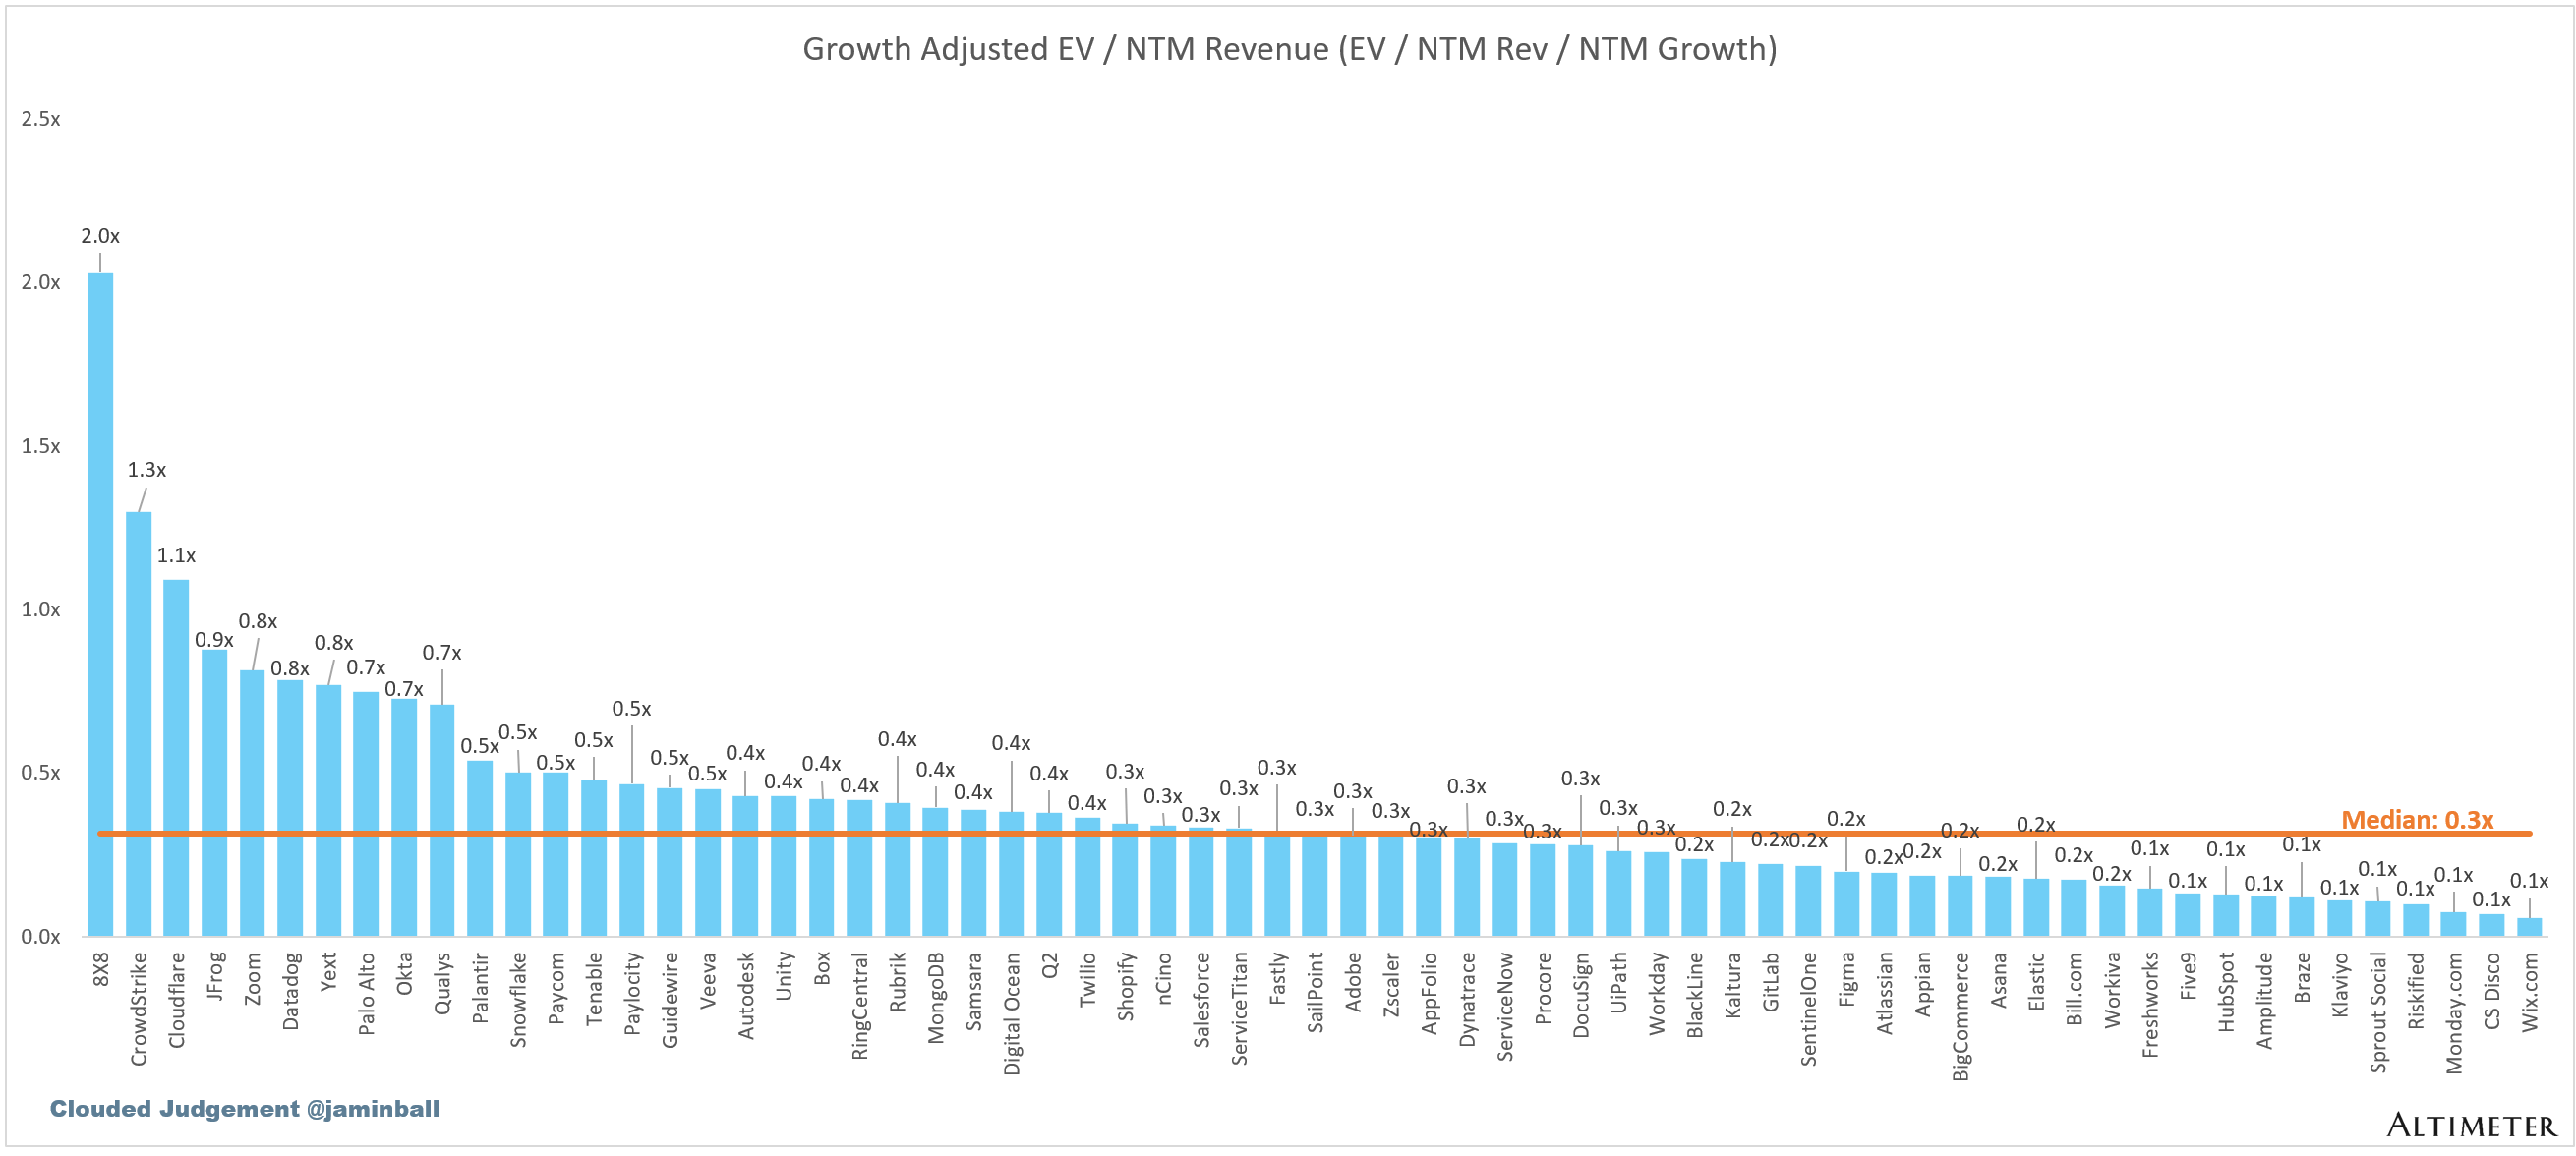
EV / NTM Rev / NTM Growth
The below chart shows the EV / NTM revenue multiple divided by NTM consensus growth expectations. So a company trading at 20x NTM revenue that is projected to grow 100% would be trading at 0.2x. The goal of this graph is to show how relatively cheap / expensive each stock is relative to its growth expectations.
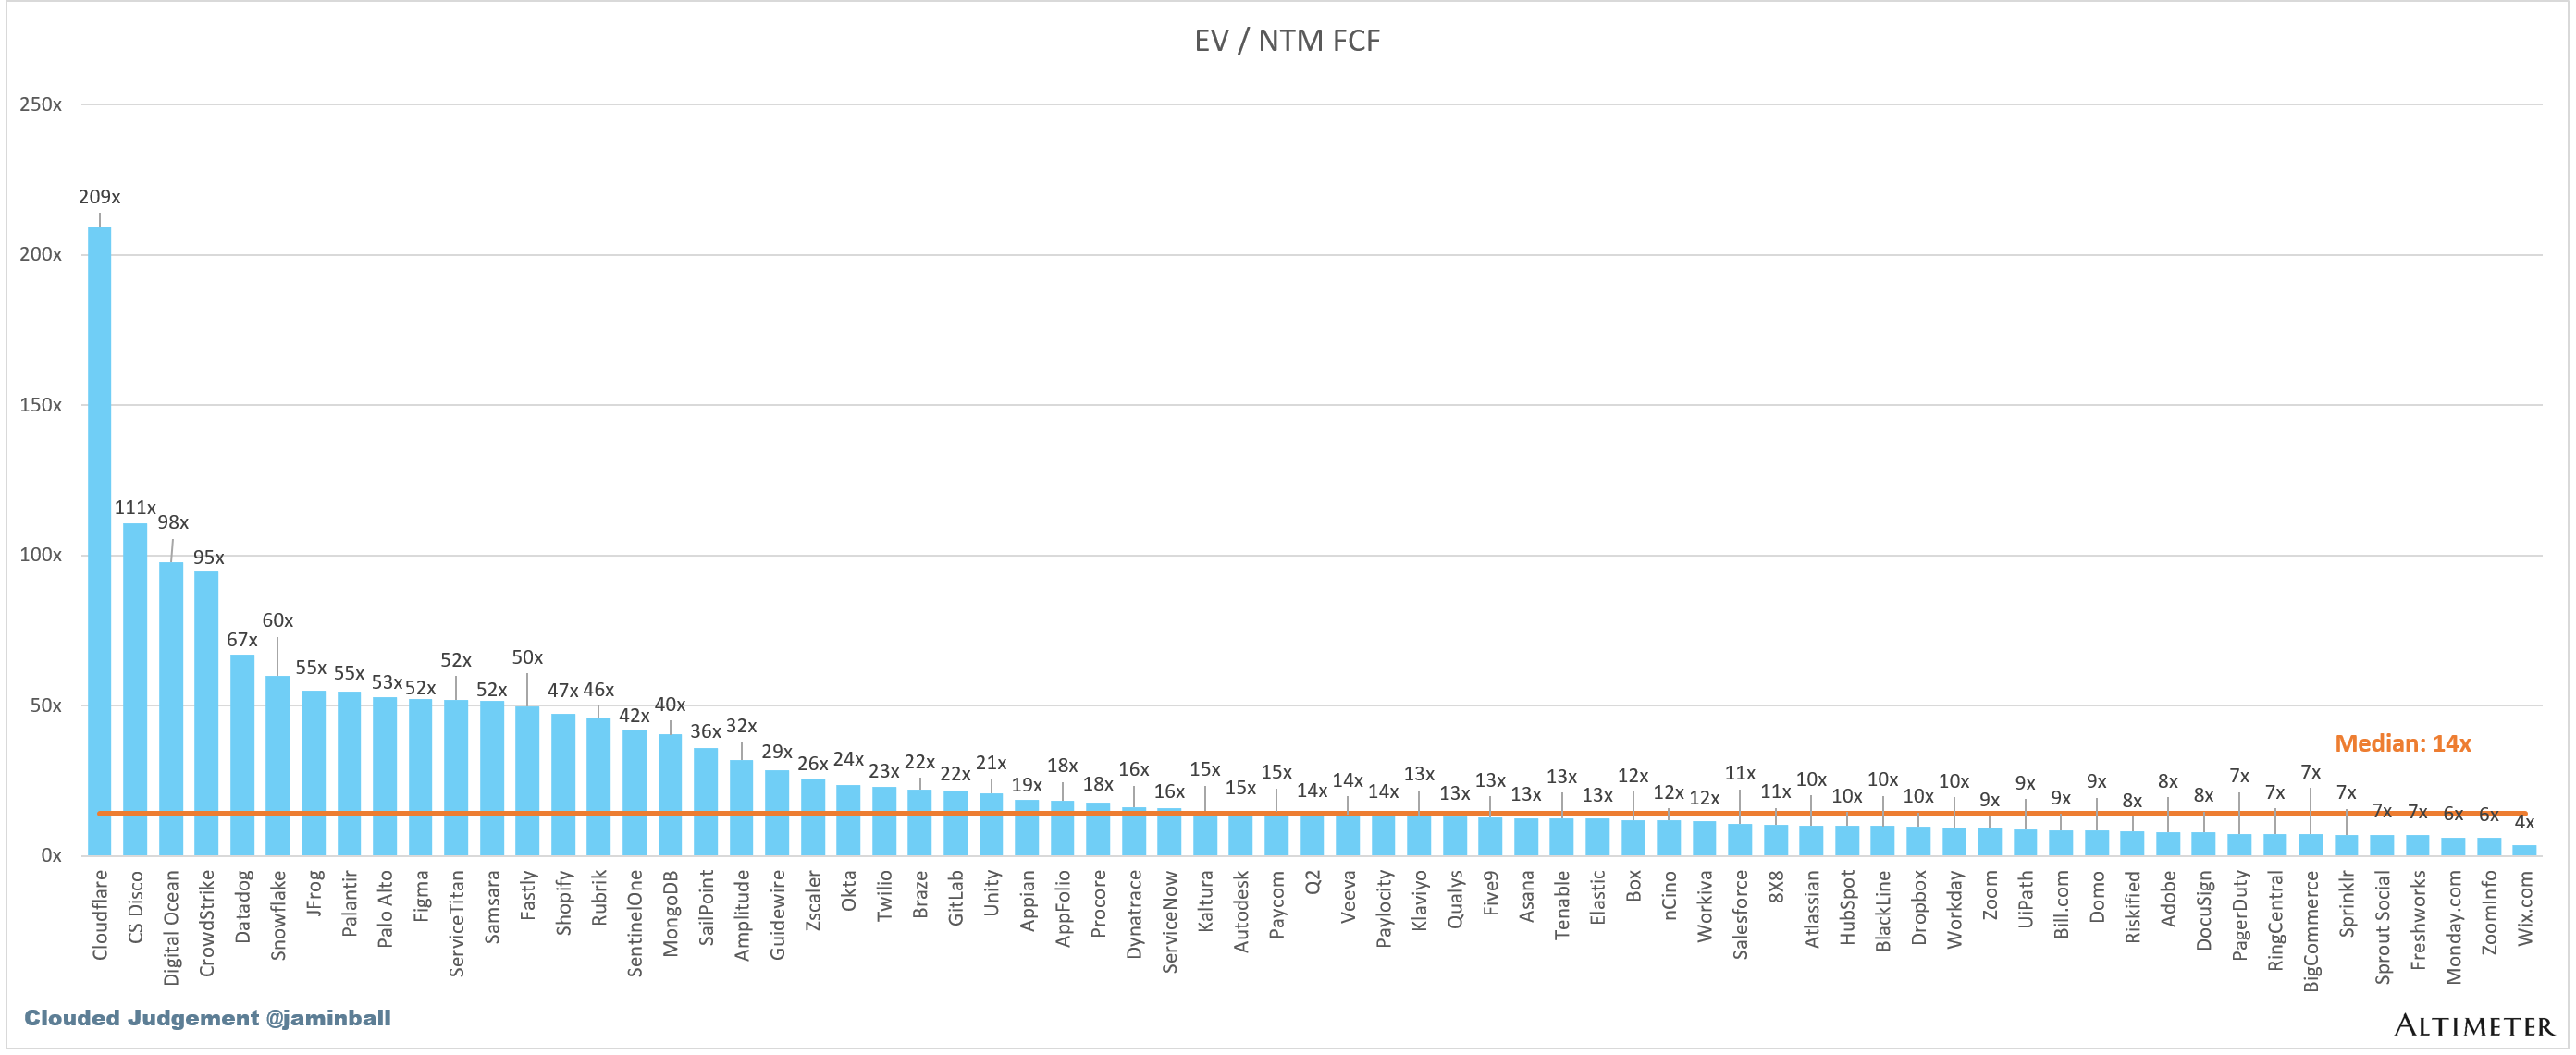
EV / NTM FCF
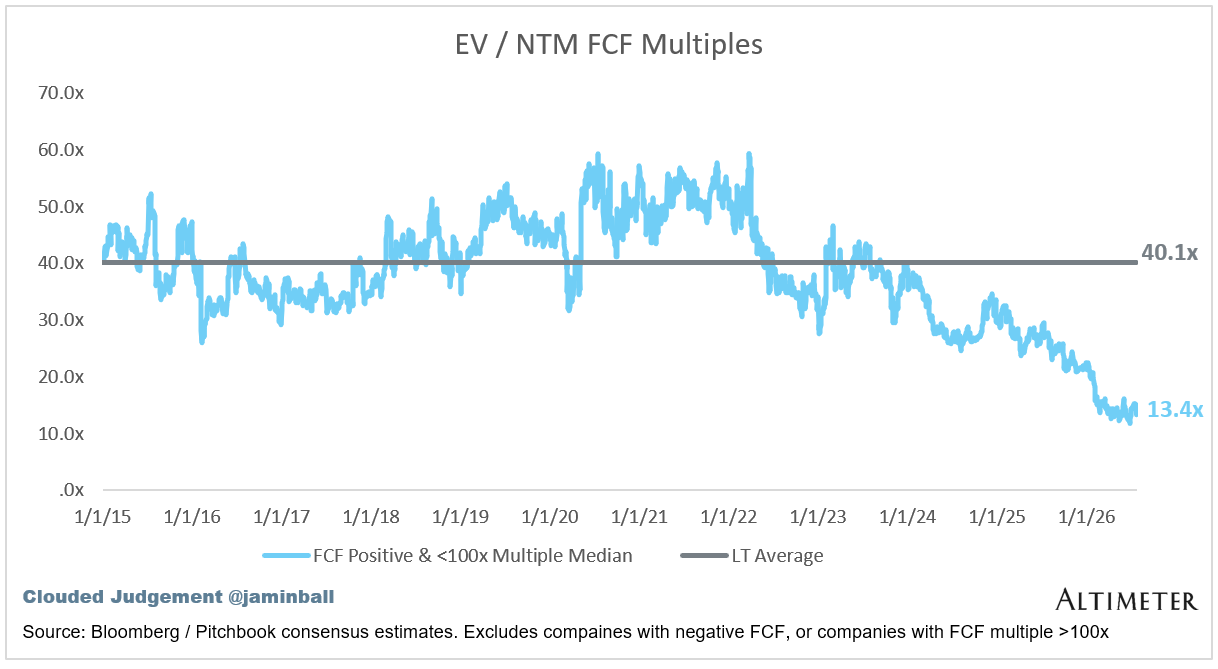
The line chart shows the median of all companies with a FCF multiple >0x and <100x. I created this subset to show companies where FCF is a relevant valuation metric.
Companies with negative NTM FCF are not listed on the chart
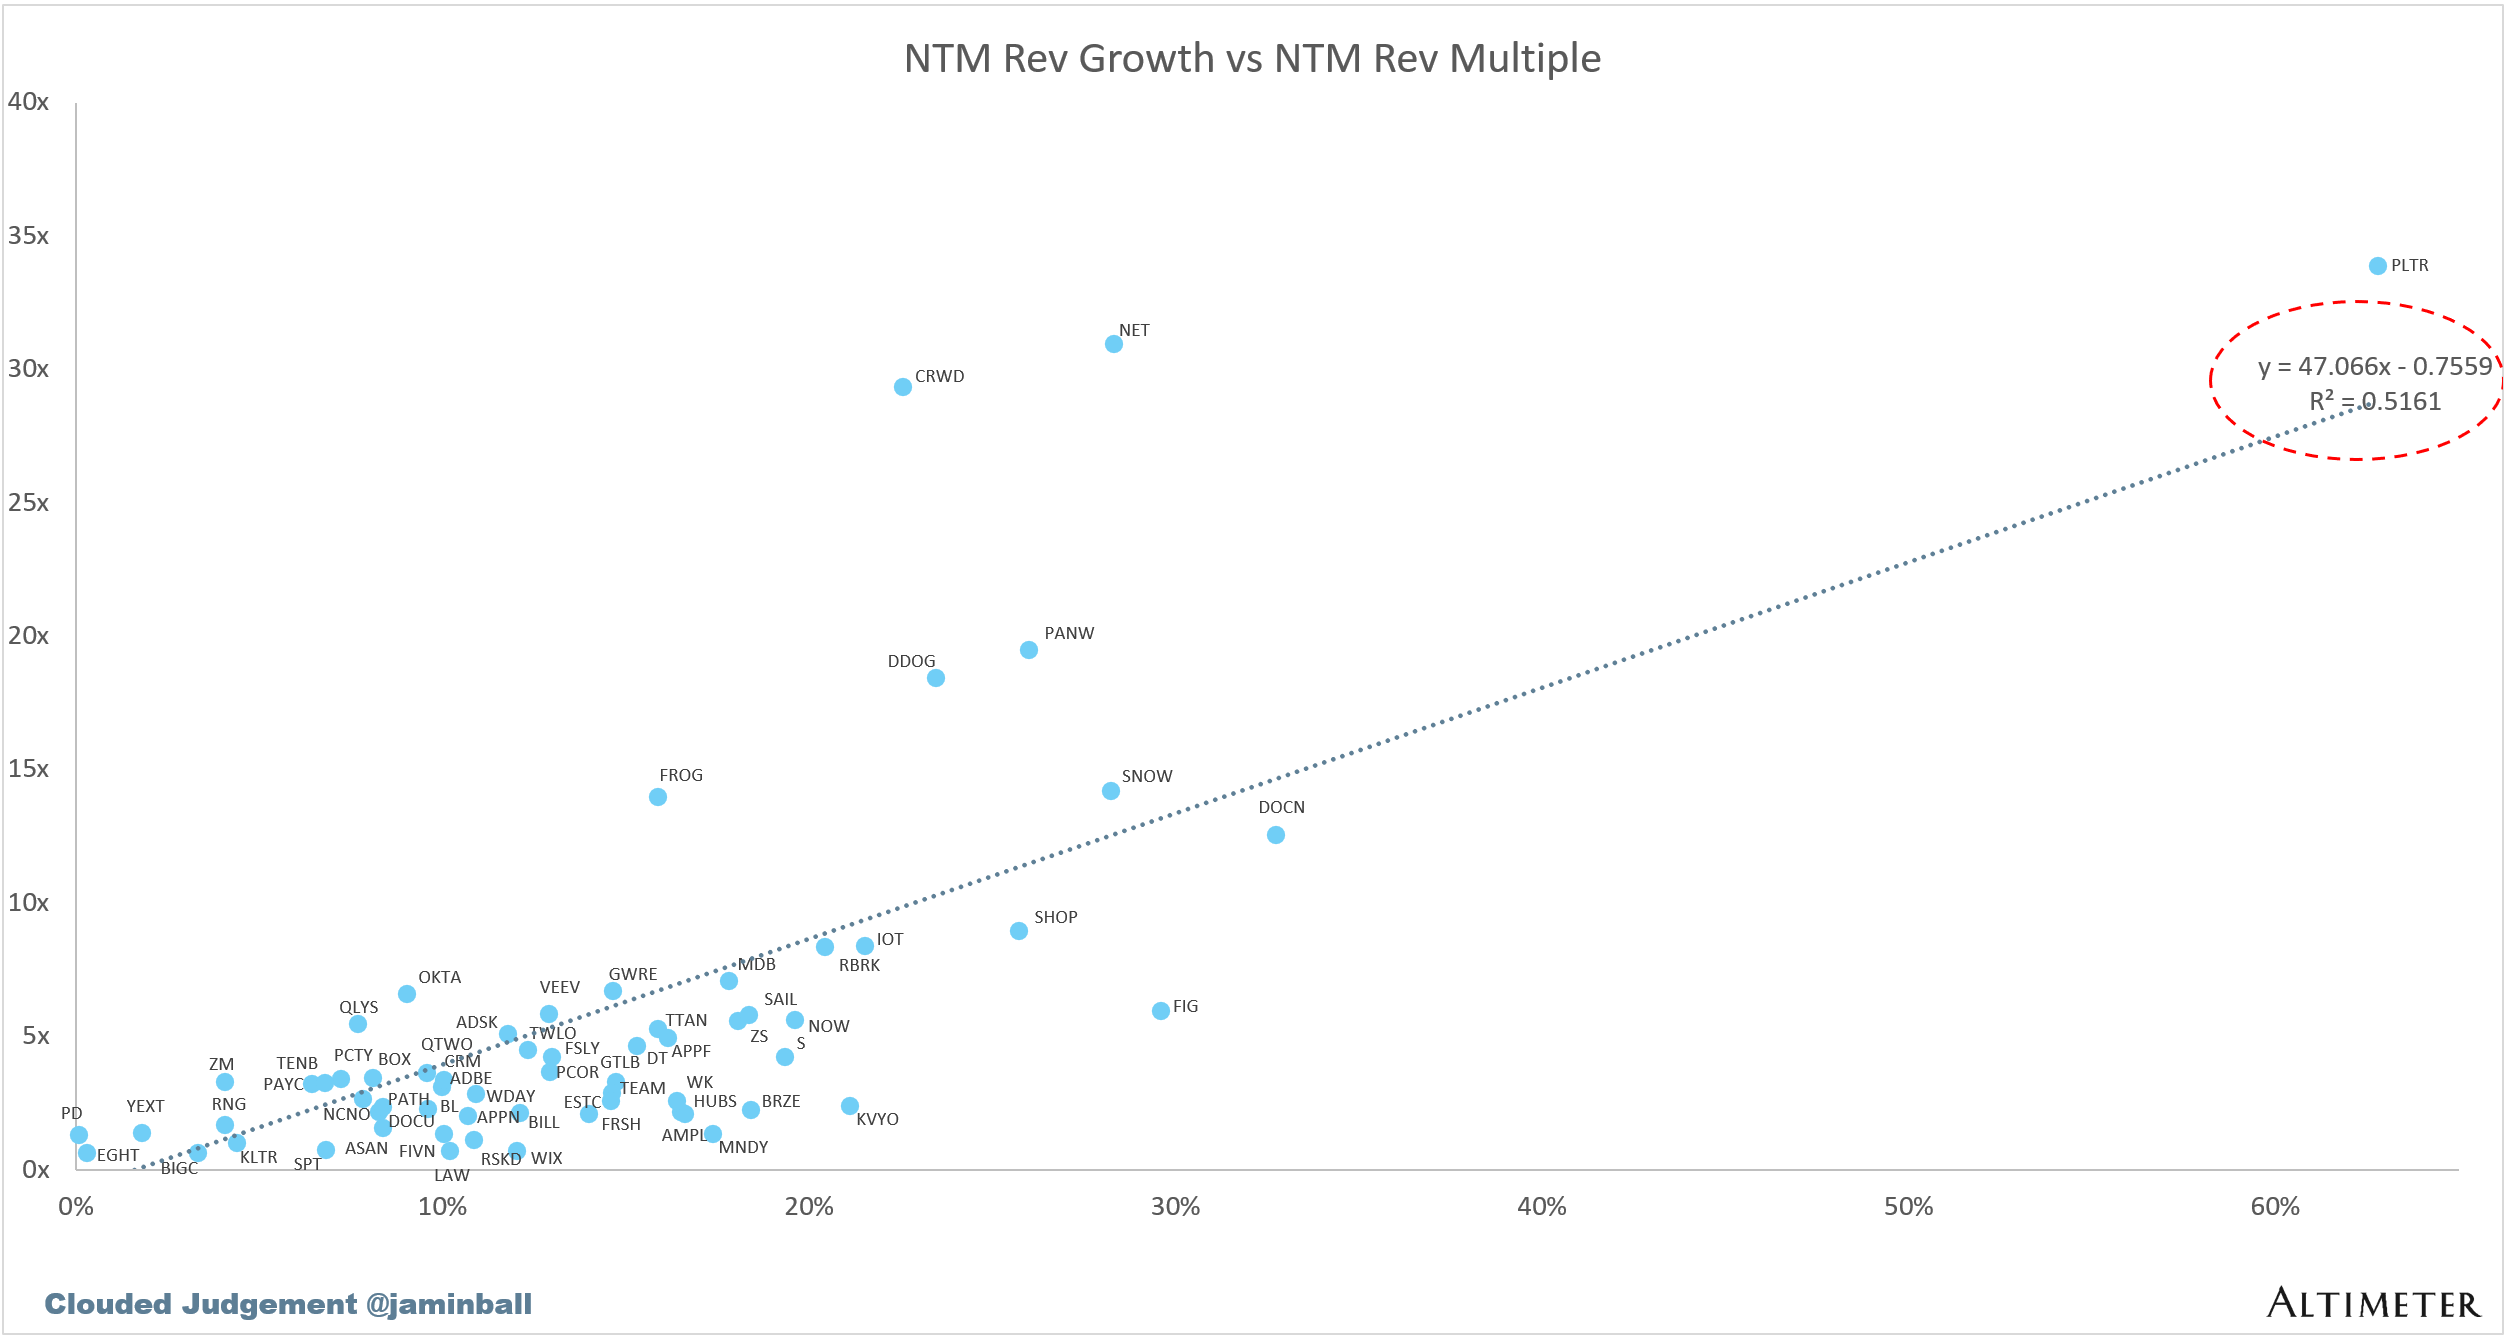
Scatter Plot of EV / NTM Rev Multiple vs NTM Rev Growth
How correlated is growth to valuation multiple?
Operating Metrics
Median NTM growth rate: 12%
Median LTM growth rate: 16%
Median Gross Margin: 75%
Median Operating Margin 2%
Median FCF Margin: 21%
Median Net Retention: 110%
Median CAC Payback: 48 months
Median S&M % Revenue: 34%
Median R&D % Revenue: 23%
Median G&A % Revenue: 13%
Comps Output
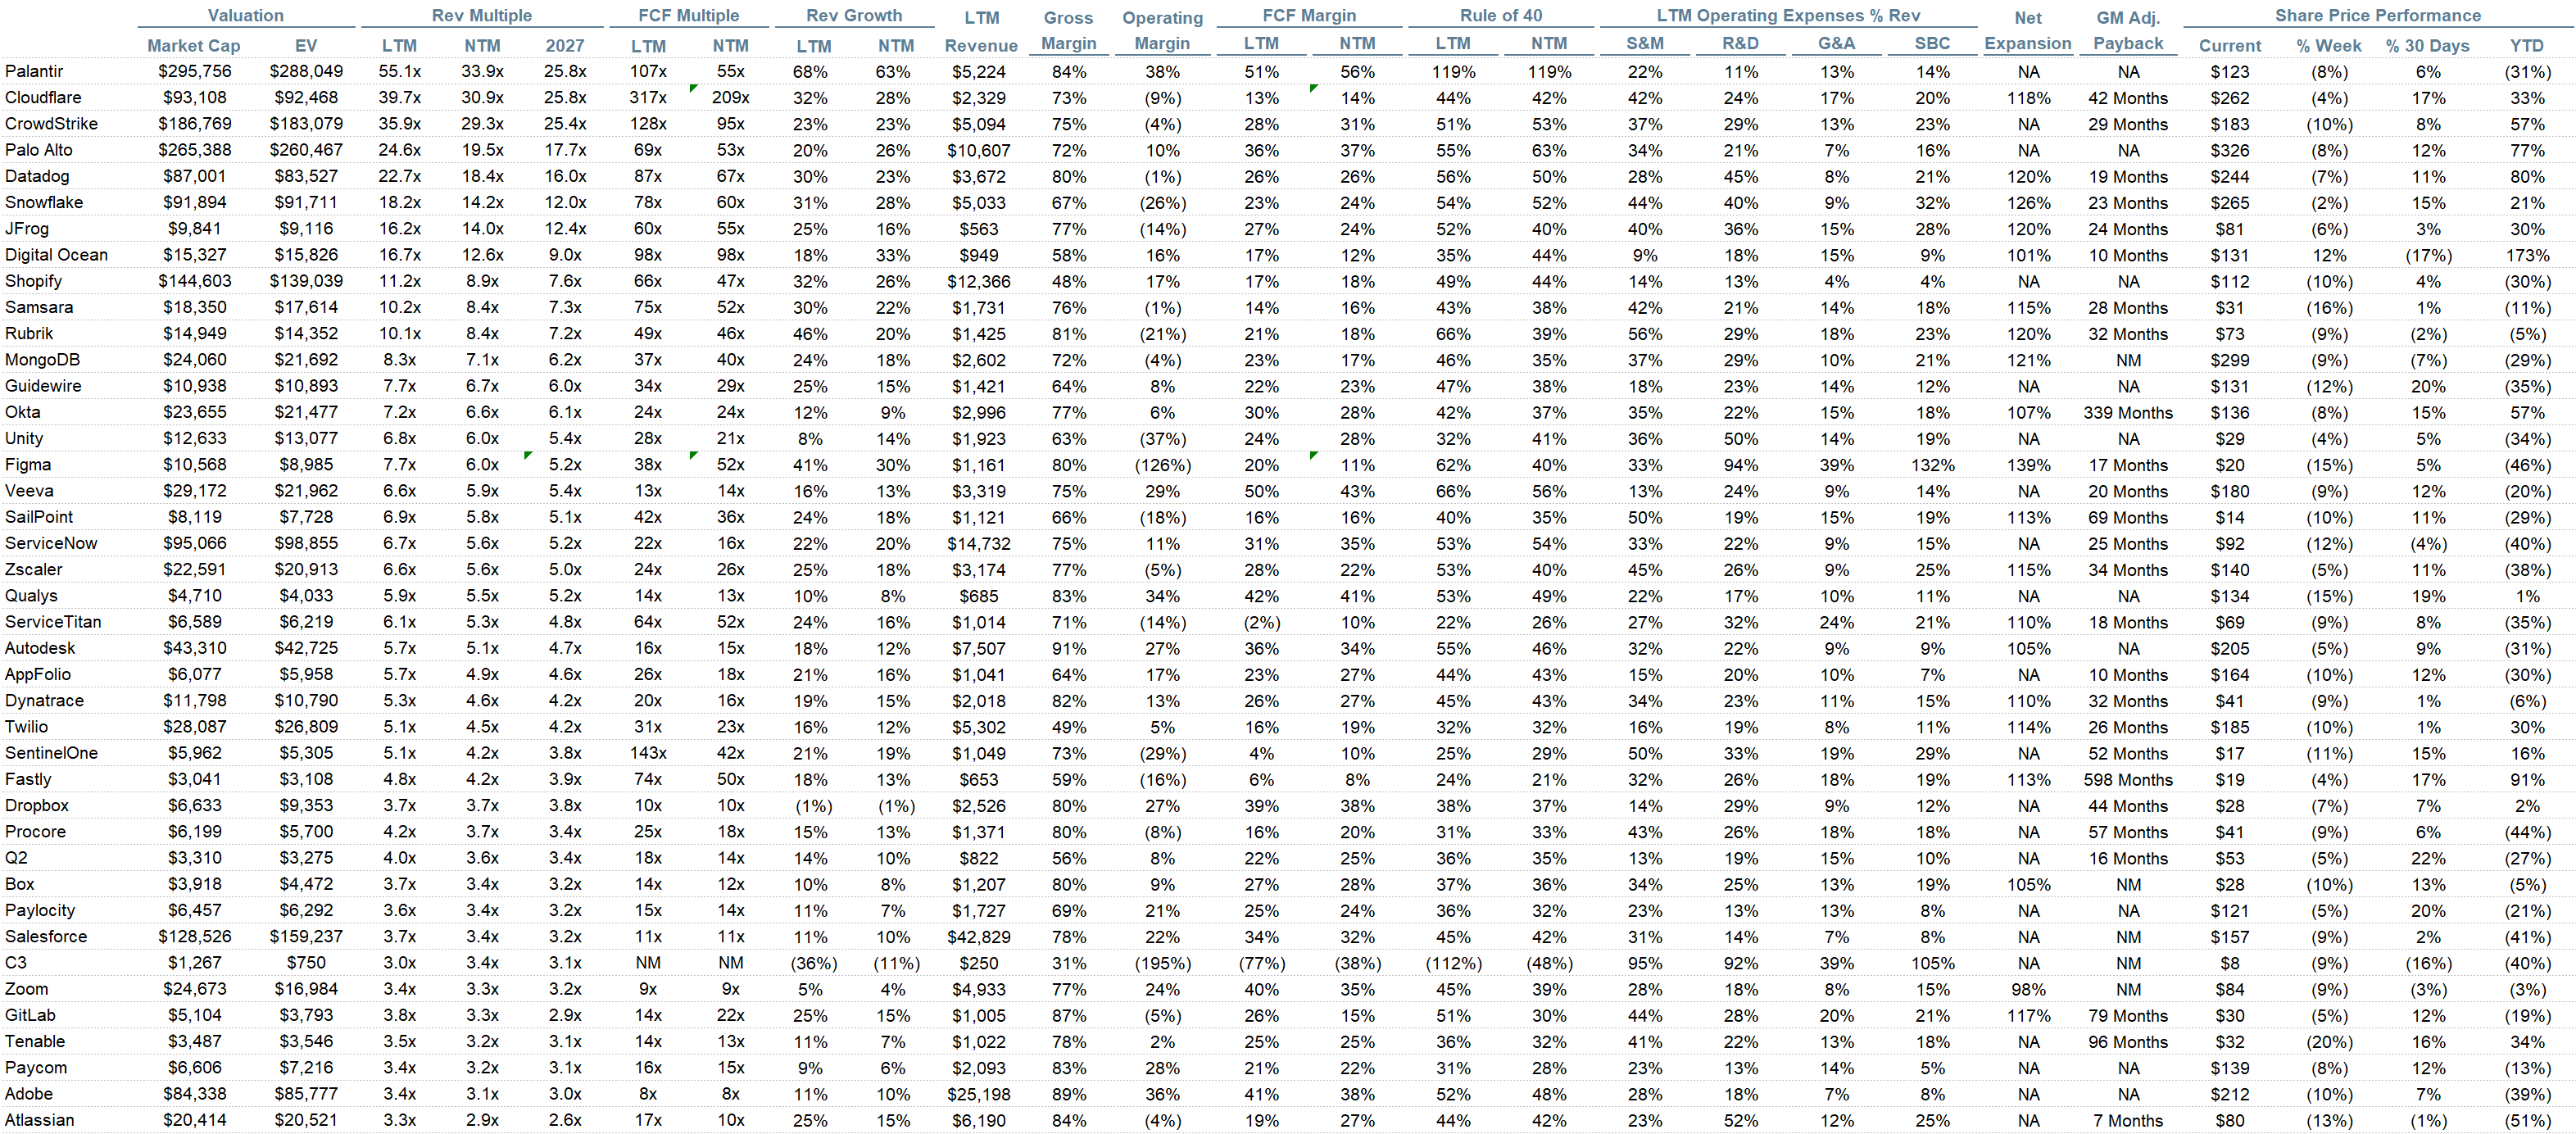
Rule of 40 shows rev growth + FCF margin (both LTM and NTM for growth + margins). FCF calculated as Cash Flow from Operations - Capital Expenditures
GM Adjusted Payback is calculated as: (Previous Q S&M) / (Net New ARR in Q x Gross Margin) x 12. It shows the number of months it takes for a SaaS business to pay back its fully burdened CAC on a gross profit basis. Most public companies don’t report net new ARR, so I’m taking an implied ARR metric (quarterly subscription revenue x 4). Net new ARR is simply the ARR of the current quarter, minus the ARR of the previous quarter. Companies that do not disclose subscription rev have been left out of the analysis and are listed as NA.
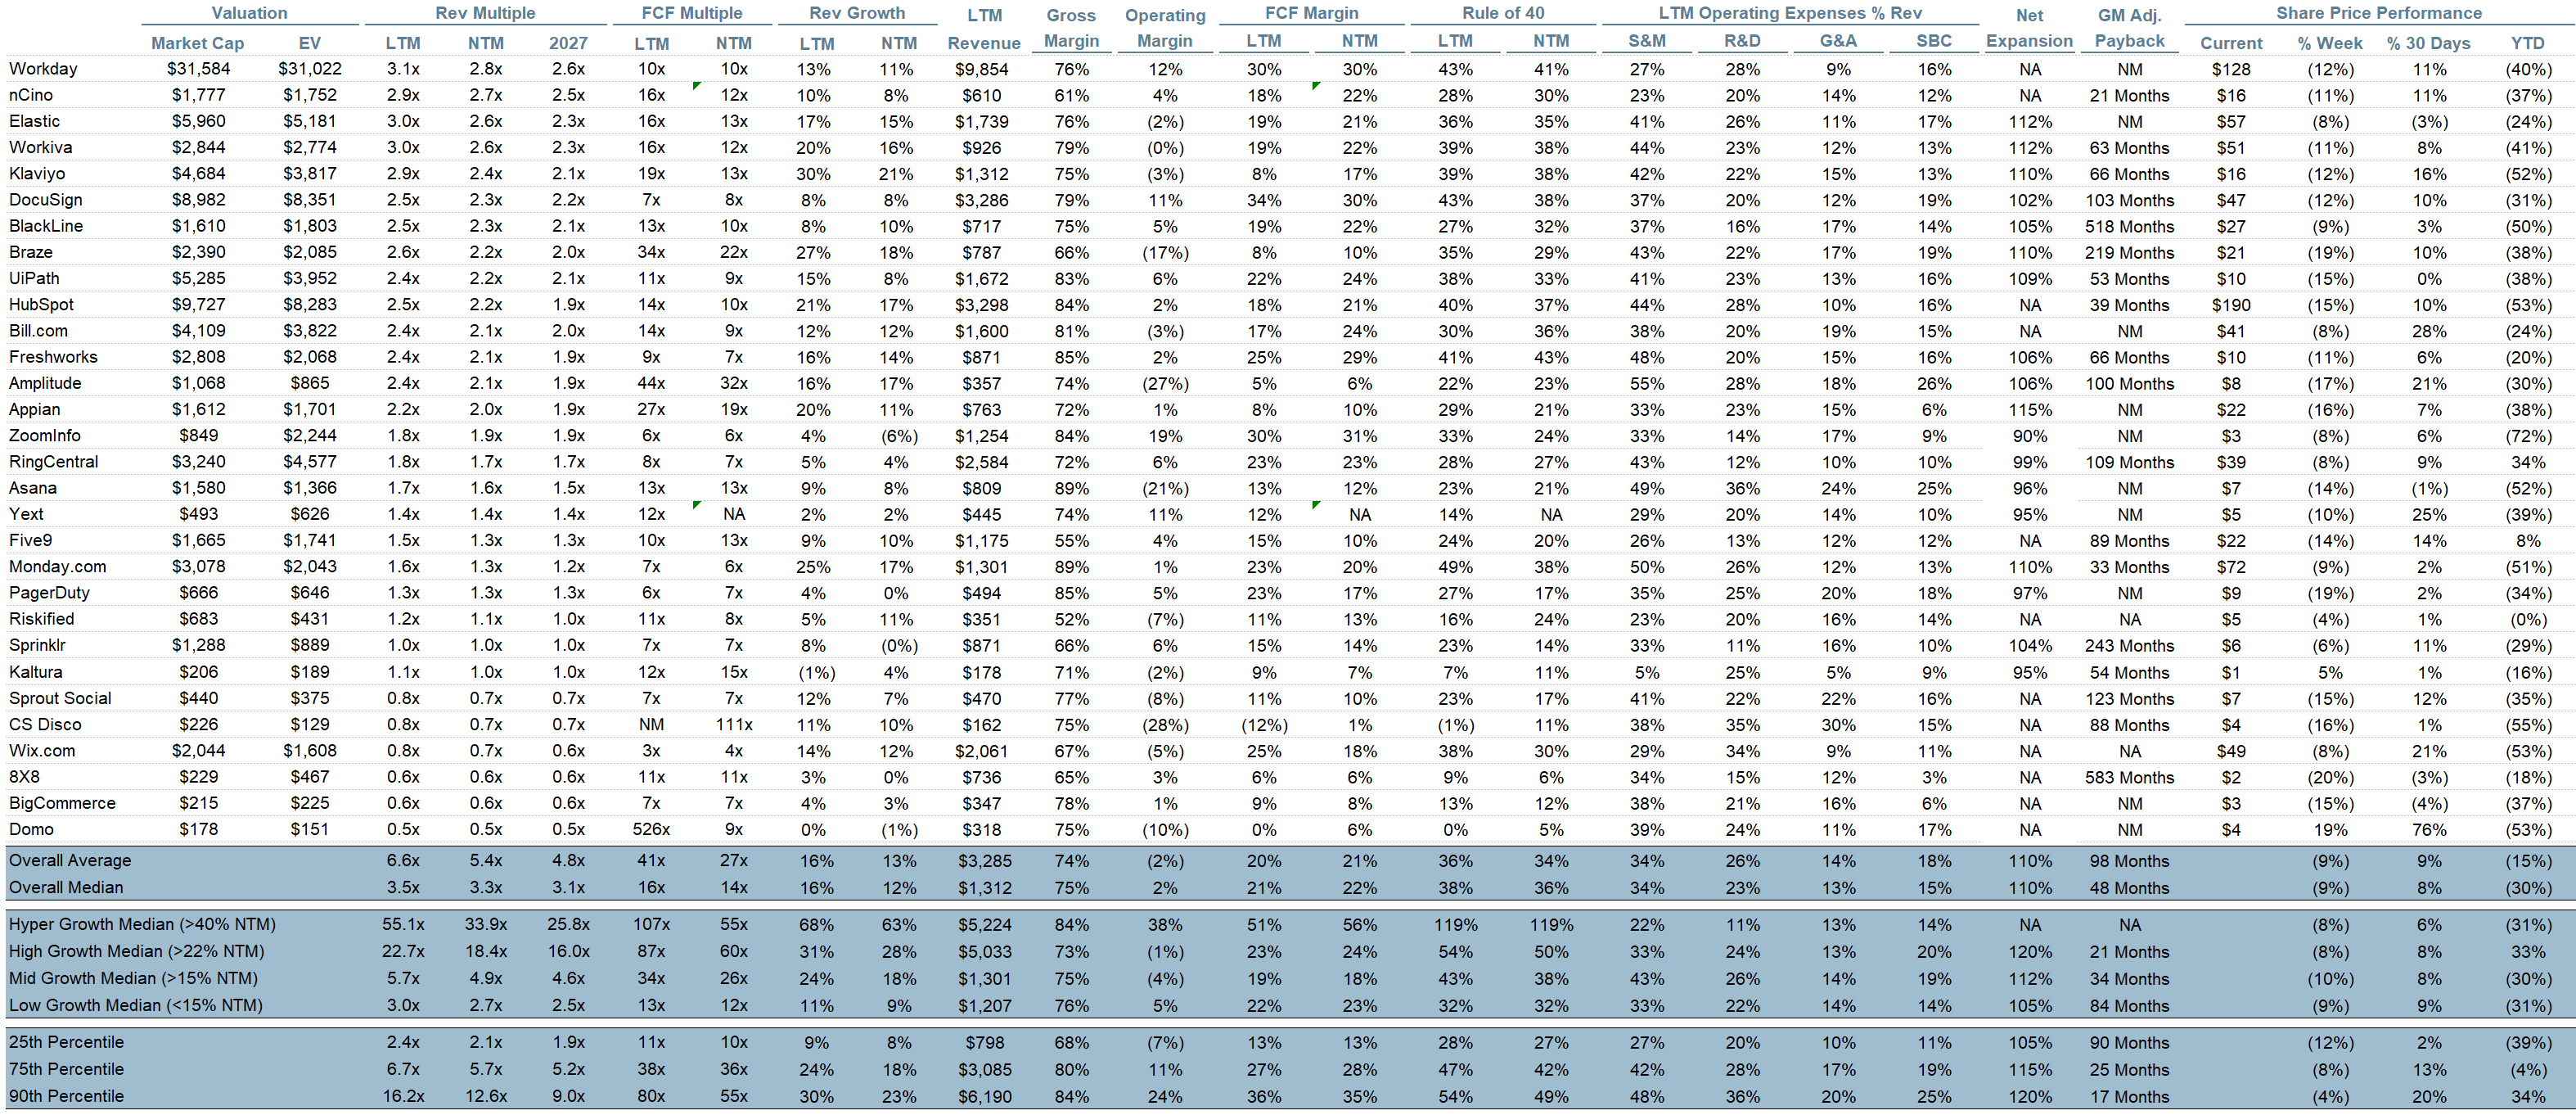
Sources used in this post include Bloomberg, Pitchbook and company filings
The information presented in this newsletter is the opinion of the author and does not necessarily reflect the view of any other person or entity, including Altimeter Capital Management, LP (”Altimeter”). The information provided is believed to be from reliable sources but no liability is accepted for any inaccuracies. This is for information purposes and should not be construed as an investment recommendation. Past performance is no guarantee of future performance. Altimeter is an investment adviser registered with the U.S. Securities and Exchange Commission. Registration does not imply a certain level of skill or training. Altimeter and its clients trade in public securities and have made and/or may make investments in or investment decisions relating to the companies referenced herein. The views expressed herein are those of the author and not of Altimeter or its clients, which reserve the right to make investment decisions or engage in trading activity that would be (or could be construed as) consistent and/or inconsistent with the views expressed herein.
This post and the information presented are intended for informational purposes only. The views expressed herein are the author’s alone and do not constitute an offer to sell, or a recommendation to purchase, or a solicitation of an offer to buy, any security, nor a recommendation for any investment product or service. While certain information contained herein has been obtained from sources believed to be reliable, neither the author nor any of his employers or their affiliates have independently verified this information, and its accuracy and completeness cannot be guaranteed. Accordingly, no representation or warranty, express or implied, is made as to, and no reliance should be placed on, the fairness, accuracy, timeliness or completeness of this information. The author and all employers and their affiliated persons assume no liability for this information and no obligation to update the information or analysis contained herein in the future.
In the Cambrian Explosion, the setting was right for complex stuff like eyesight to develop, resulting in a wild explosion of experiments in what life could be. This is sort of similar, the setting is ripe for this massive new force to enter our economy, right when it really needs fixing. But it is just at its first few blinks, tripping over its toes, and no one has a clue how to really use it. Even OpenAI was stunned when its own agent figured out how to penetrate Hugging Face despite their own attempts to sandbox it. No one knows if the current builds will be cash flow positive before the bills start becoming due. IBM management was sure they would sell 5 mainframes over the life of the product. We are probably in for a decade of a steep learning curve, this looks that powerful. One suggestion is to be very careful what you assume. Keep your eyes open and listen to as much input as you can tolerate. Pay attention to Big Problems that need solving, as people there tend to swing from the fences first.
Love "Positive Sum".
Thank you for the article. I learn a lot. As I've been putting together spreadsheets to try a to see how to value companies where traditional benchmarks seem to be moving. I learn a few new term. I should I'm pretty novice at this.
At the end of the article I have the same question I have for my own forays into this.
"And so what is you take?. What is you judgement call. So much data, so much perspective, now what?
Jeff