Every week I’ll provide updates on the latest trends in cloud software companies. Follow along to stay up to date!
Busy week! Lots to unpack, I’ll hit on a couple of my favorite topics from this week below.
AI = Data + Compute
I’ll continue beating this drum, but we got two great quotes from Azure and AWS this week. Satya at Microsoft said “Every AI app starts with data and having a comprehensive data and analytics platform is more important than ever.” Then at AWS Summit they called out “Your data is your differentiator when it comes to Generative AI.” Data is more important than ever!
Economy / Macro Update
The Fed hiked rates 25 bps this week (this was expected). What was more interesting was their commentary. Powell said the Fed staff no longer is forecasting a recession. This would imply we get back to the 2% target inflation without significant job losses or a contracting economy (GDP). Here’s a quote: “So the staff now has a noticeable slowdown in growth starting later this year in the forecast, but given the resilience of the economy recently, they are no longer forecasting a recession.” Said another way, their base case now appears to be soft landing vs recession. We did get a few more data points this week to support this. Q2 GDP came in at 2.4% YoY vs expectations of 1.8% (ie economy growing faster than expected). Jobless claims came in lower than expectations (221k vs 235k expected). Meaning labor markets continue to be strong! And finally, Core PCE came in at 3.8% vs 4% expected (PCE is another inflation indicator, and it came in lower than expected). Overall, the incremental data points this week showed economy is stronger, labor market is tighter, and inflation coming down faster than expected. All signs of a soft landing, which support a “higher for longer” policy when it comes to interest rates. If the economy and labor market remain strong, it suggests the Fed has more wiggle room to keep rates higher to curb inflation. Given the incremental data we got this week the 10Y jumped back up to >4%. Time will tell if the strong economy and labor market lead to a resurgence of inflation in the back half of the year.
Cycle of Cloud Optimizations
Q2 earning season has officially kicked off! This week we had two of the hypserscalers report (Microsoft / Azure and Google / GCP), and everyone was eager to see their results. AWS reports next week. So what did we learn? Are buying behaviors and the demand environment getting better?? I think the answer to that question (with the data we have so far) is still “not getting better yet, but not getting worse.” Azure growth dropped from 31% last quarter to 27% this quarter in constant currency (27% to 26% not including currency effects). Google Cloud doesn’t report constant currency, and their growth stayed steady at 28% last quarter and this quarter. Overall, the rate of deceleration is definitely slowing (good thing!). Azure guided to 25-26% growth in constant currency, so they expect even less deceleration in the upcoming quarter (but remember, Q3 ‘22 was when the optimization headwinds really kicked in, so the YoY growth comparison for Q3 ‘23 is against an “easier comp”).
Satya at Microsoft described the optimization cycle over the last 12 months well, and I wanted to summarize it here. He described customer cycles in normal times as following 3 main phases: (1) new purchase, (2) expansion of usage, (3) optimization of usage. 2 and 3 then rinse / repeat over time. What happened in 2021 is that phase 2 (expansion of usage) was turbo charged. Expansions happened much faster without much resistance. At the same time, the normal cycle of optimization didn’t happen. So what we’ve seen over the last 12 months is not only normal optimization cycles resume, but “catch-up” optimizations from the period where we had none (ie optimizing all of the expansion from 2021). We’ll be back to “normal” when we get through these “catch-up” optimizations.
So when will we be done with these catch-up optimizations? Unfortunately, we didn’t get tons of clarity here. On the Microsoft call, they said they’ll continue to see these catch up optimizations for the next “couple quarters.” Optimizations were definitely less of a part of the prepared remarks in the Microsoft call (so seems like they’re emphasizing less). But they’re still seeing them, and the fear is we’re “a couple quarters away” for a while.
I think there was an expectation that Q3 would be the first quarter where things really got better. After the Microsoft call, I think the likelihood of that went down. Not to say Q3 will be bad, or the odds of improvement in Q3 went down materially, but I don’t think Q3 is necessarily the slam dunk to be the light at the end of the tunnel people expected. On the flip side, ServiceNow also reported this week, and they called out a strong demand environment going into the second half of the year! Specifically, they said “we actually see higher pipeline coverage ratios going into Q3 than we saw last year.” Pipeline coverage is a good leading indicator. Of course, if the goal for next quarter is lower, then you need less pipeline to cover it. Overall, ServiceNow did sound a lot more bullish on the demand environment on their call. And they have some data to back it up. When we look at the year-over-year growth of net new ARR added each quarter, it has inflected recently. I show YoY growth given some of the seasonality in the net new ARR added (using quarterly subscription rev x 4 to approximate ARR). This could be a trend of improving buyer dynamics?
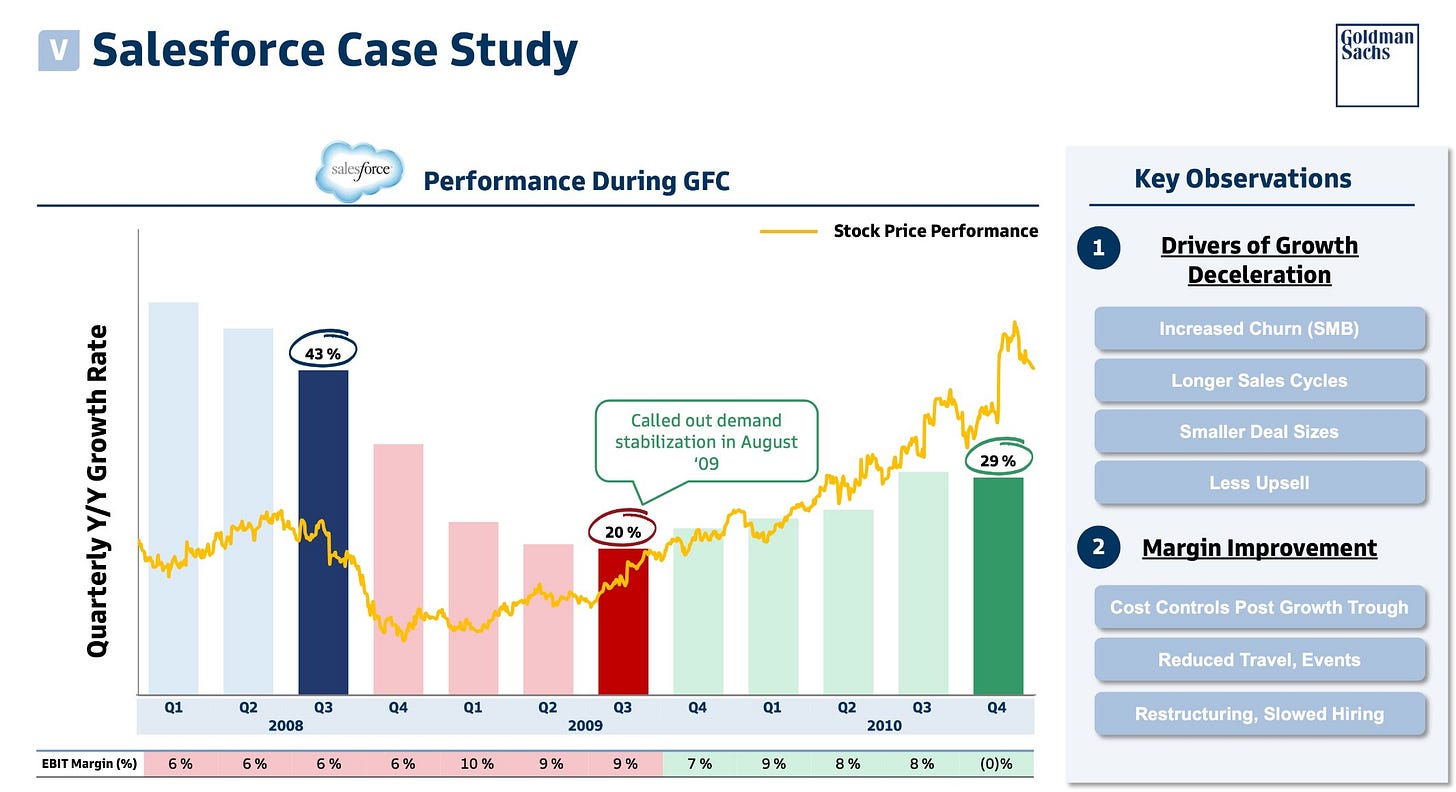
I set all of this up to discuss the following chart someone sent me on twitter (below). It’s a Salesforce case study from ‘08. The bars represent the YoY revenue growth, and the yellow line is the stock price. As you can see, the stock price bottomed and started going up in Q4 ‘08. However, revenue growth didn’t bottom until Q3 ‘09. The takeaway being stock prices move ahead of fundamentals, and if we’re drawing similar conclusions to today we should expect revenue growth to inflect 3 quarters after stocks inflect. If we look at parallels to today we saw stocks bottom in Q4 ‘22. If the market was as forward looking today as it was back in ‘08, that would imply we’d see revenue growth inflecting in Q3 ‘23. Or said another way, stocks bottom in Q4 ‘22 meant that the expectation was for revenue growth to inflect in Q3 ‘23. But what if it doesn’t? What if it takes longer for revenue growth to inflect (and these catch-up optimizations continue)? Will the market get impatient? Only time will tell. I’m really looking forward to getting more data on software performance (and outlook for the rest of the year) as we get further into Q2 earnings season.
Quarterly Reports Summary
Top 10 EV / NTM Revenue Multiples
Mongo edges out Snowflake for the top spot!
Top 10 Weekly Share Price Movement
Update on Multiples
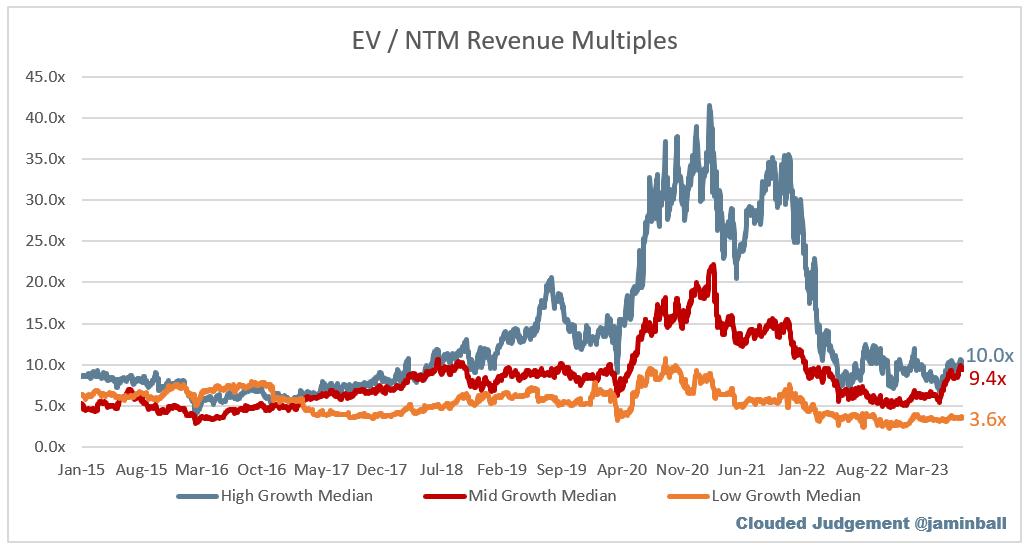
SaaS businesses are generally valued on a multiple of their revenue - in most cases the projected revenue for the next 12 months. Revenue multiples are a shorthand valuation framework. Given most software companies are not profitable, or not generating meaningful FCF, it’s the only metric to compare the entire industry against. Even a DCF is riddled with long term assumptions. The promise of SaaS is that growth in the early years leads to profits in the mature years. Multiples shown below are calculated by taking the Enterprise Value (market cap + debt - cash) / NTM revenue.
Overall Stats:
Overall Median: 6.3x
Top 5 Median: 15.6x
10Y: 4.0%
Bucketed by Growth. In the buckets below I consider high growth >30% projected NTM growth, mid growth 15%-30% and low growth <15%
High Growth Median: 10.0x
Mid Growth Median: 9.4x
Low Growth Median: 3.6x
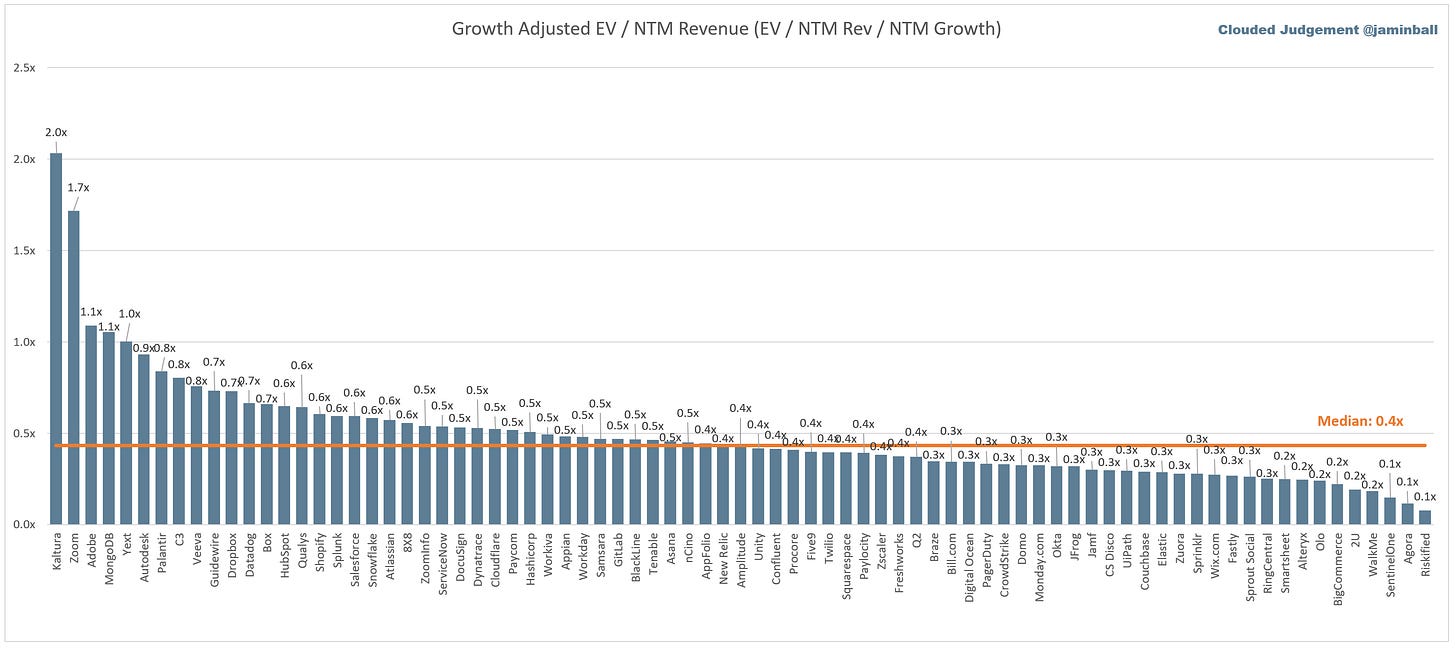
EV / NTM Rev / NTM Growth
The below chart shows the EV / NTM revenue multiple divided by NTM consensus growth expectations. So a company trading at 20x NTM revenue that is projected to grow 100% would be trading at 0.2x. The goal of this graph is to show how relatively cheap / expensive each stock is relative to their growth expectations
EV / NTM FCF
Companies with negative NTM FCF are not listed on the chart
Scatter Plot of EV / NTM Rev Multiple vs NTM Rev Growth
How correlated is growth to valuation multiple?
Operating Metrics
Median NTM growth rate: 15%
Median LTM growth rate: 24%
Median Gross Margin: 75%
Median Operating Margin (20%)
Median FCF Margin: 5%
Median Net Retention: 115%
Median CAC Payback: 57 months
Median S&M % Revenue: 46%
Median R&D % Revenue: 27%
Median G&A % Revenue: 18%
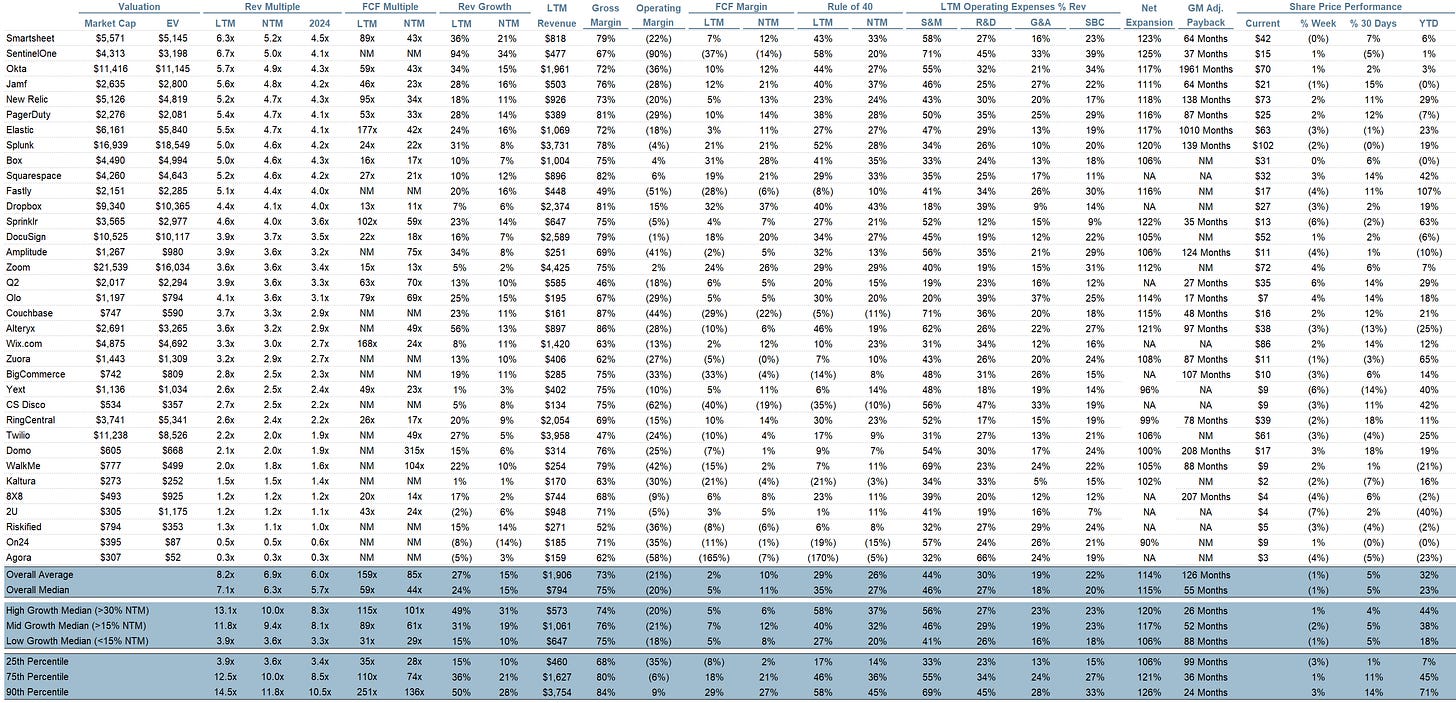
Comps Output
Rule of 40 shows rev growth + FCF margin (both LTM and NTM for growth + margins). FCF calculated as Cash Flow from Operations - Capital Expenditures
GM Adjusted Payback is calculated as: (Previous Q S&M) / (Net New ARR in Q x Gross Margin) x 12 . It shows the number of months it takes for a SaaS business to payback their fully burdened CAC on a gross profit basis. Most public companies don’t report net new ARR, so I’m taking an implied ARR metric (quarterly subscription revenue x 4). Net new ARR is simply the ARR of the current quarter, minus the ARR of the previous quarter. Companies that do not disclose subscription rev have been left out of the analysis and are listed as NA.
This post and the information presented are intended for informational purposes only. The views expressed herein are the author’s alone and do not constitute an offer to sell, or a recommendation to purchase, or a solicitation of an offer to buy, any security, nor a recommendation for any investment product or service. While certain information contained herein has been obtained from sources believed to be reliable, neither the author nor any of his employers or their affiliates have independently verified this information, and its accuracy and completeness cannot be guaranteed. Accordingly, no representation or warranty, express or implied, is made as to, and no reliance should be placed on, the fairness, accuracy, timeliness or completeness of this information. The author and all employers and their affiliated persons assume no liability for this information and no obligation to update the information or analysis contained herein in the future.


Thanks for sharing, can get some insights on Digital Infrastructure growth and trends and forward multiples ?
The reason SNOW fell in 2008 was the market crash. When portfolios are getting margin calls, indiscriminate selling happens irrespective of company fundamentals. Then, the share price picks up as the Fed comes to the rescue in line with the rest of the market (risk-on sentiment).